- The paper demonstrates that deep-learning models recover Δν, νₘₐₓ, and ΔΠ₁ from low-resolution Gaia XP spectra with accuracies within 10–20% error margins.
- The study employs a hybrid CNN-LSTM architecture that extracts subtle spectral features, particularly in the red wavelength range, to distinguish red giant evolutionary stages.
- The paper validates its approach with external Kepler and LAMOST comparisons, revealing new evolutionary structures and offering transformative insights for galactic studies.
Deep Learning for Asteroseismology with Gaia XP Spectra: Inference of Red Giant Parameters
Introduction
The study presents a systematic investigation of the capacity of Gaia XP low-resolution spectra (R∼15–$85$) for deriving global asteroseismic parameters of red giant stars using deep learning. Focusing on the large frequency separation (Δν), frequency of maximum oscillation power (νmax), and dipole-mode period spacing (ΔΠ1), the work evaluates whether these critical internal-structure diagnostics can be recovered at scale from Gaia XP spectra despite their limited spectral resolution, as opposed to traditionally required high-fidelity time-domain photometry or moderate to high-resolution spectroscopy. The methodology leverages hybrid convolutional neural network (CNN) and long short-term memory (LSTM) architectures, trained on Gaia DR3 XP spectra cross-matched with legacy Kepler photometric seismic labels. The resulting models enable global asteroseismic inference for over two million Galactic red giants and provide new population-level constraints.
Data and Experimental Design
The data pipeline builds a training set by cross-identifying ∼16,000 red giants with robust Kepler Δν and νmax labels (Yu et al. 2018) and ∼6,000 with ΔΠ1 (Vrard et al. 2016), matching to Gaia DR3 XP spectra after quality, extinction, and photometric error vetting. The distribution of asteroseismic parameters in the sample is non-uniform but adequately covers the RGB-RC regime.
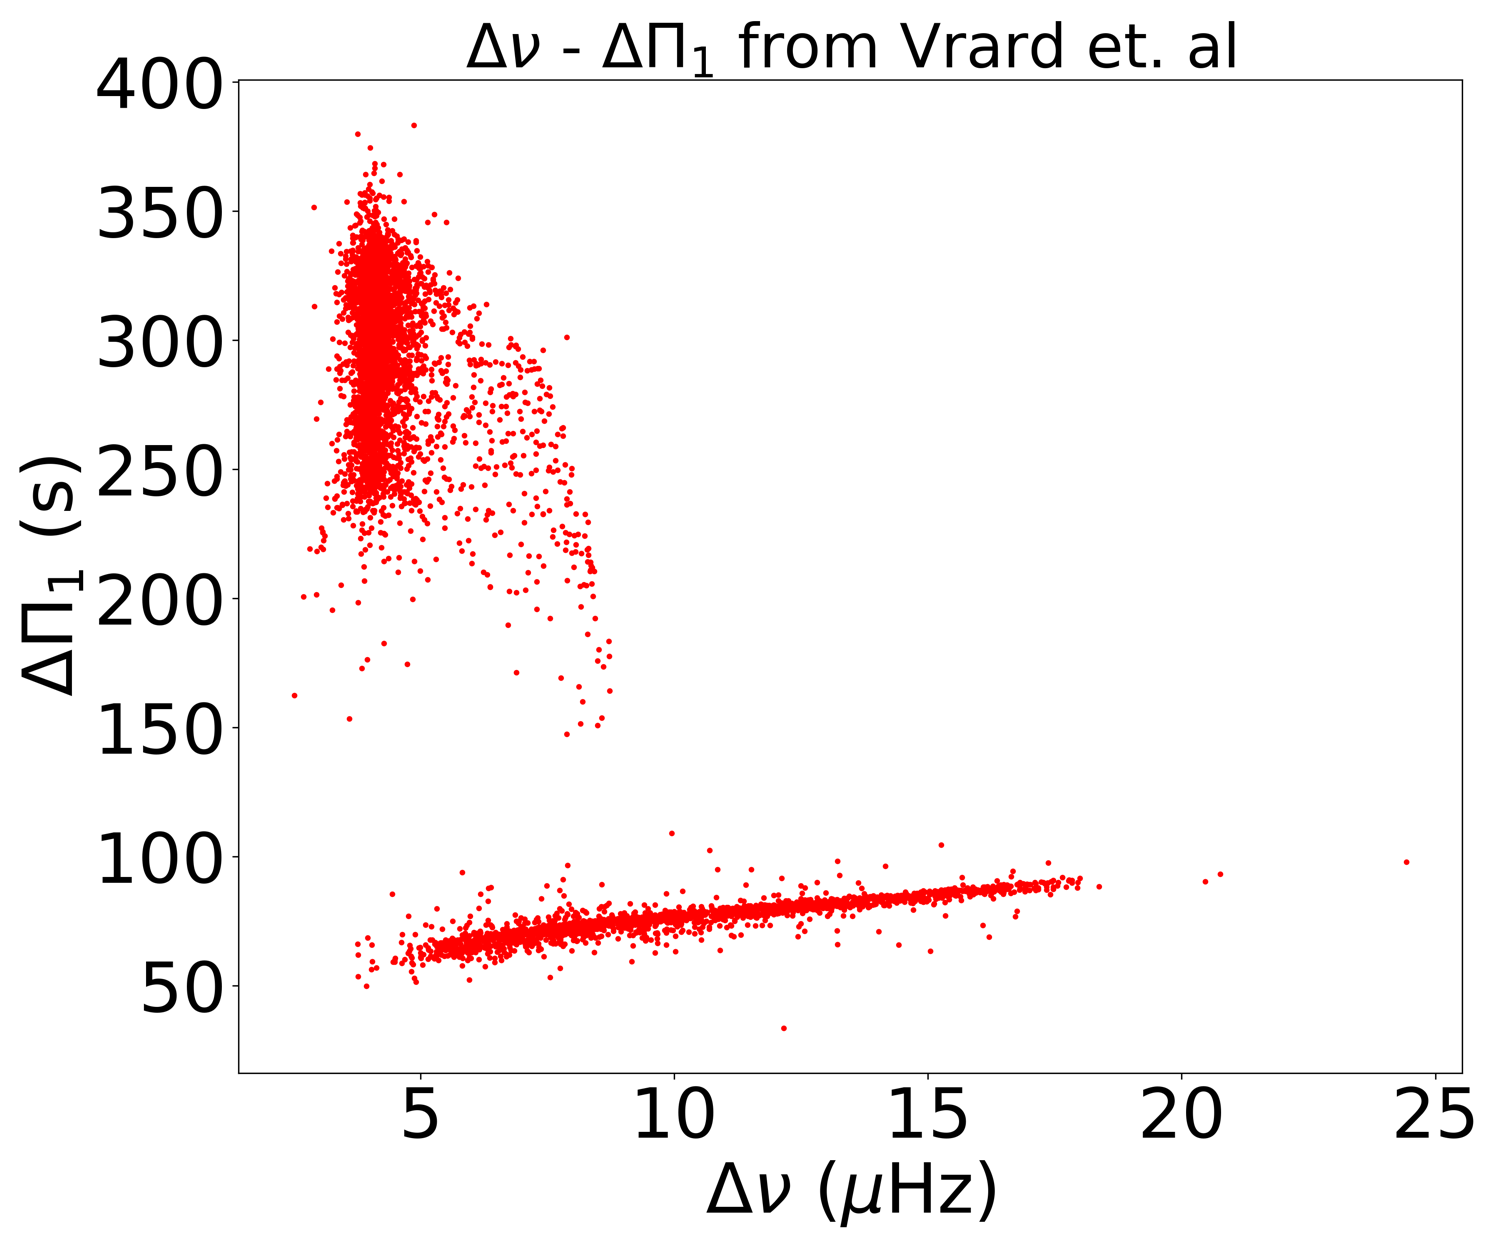
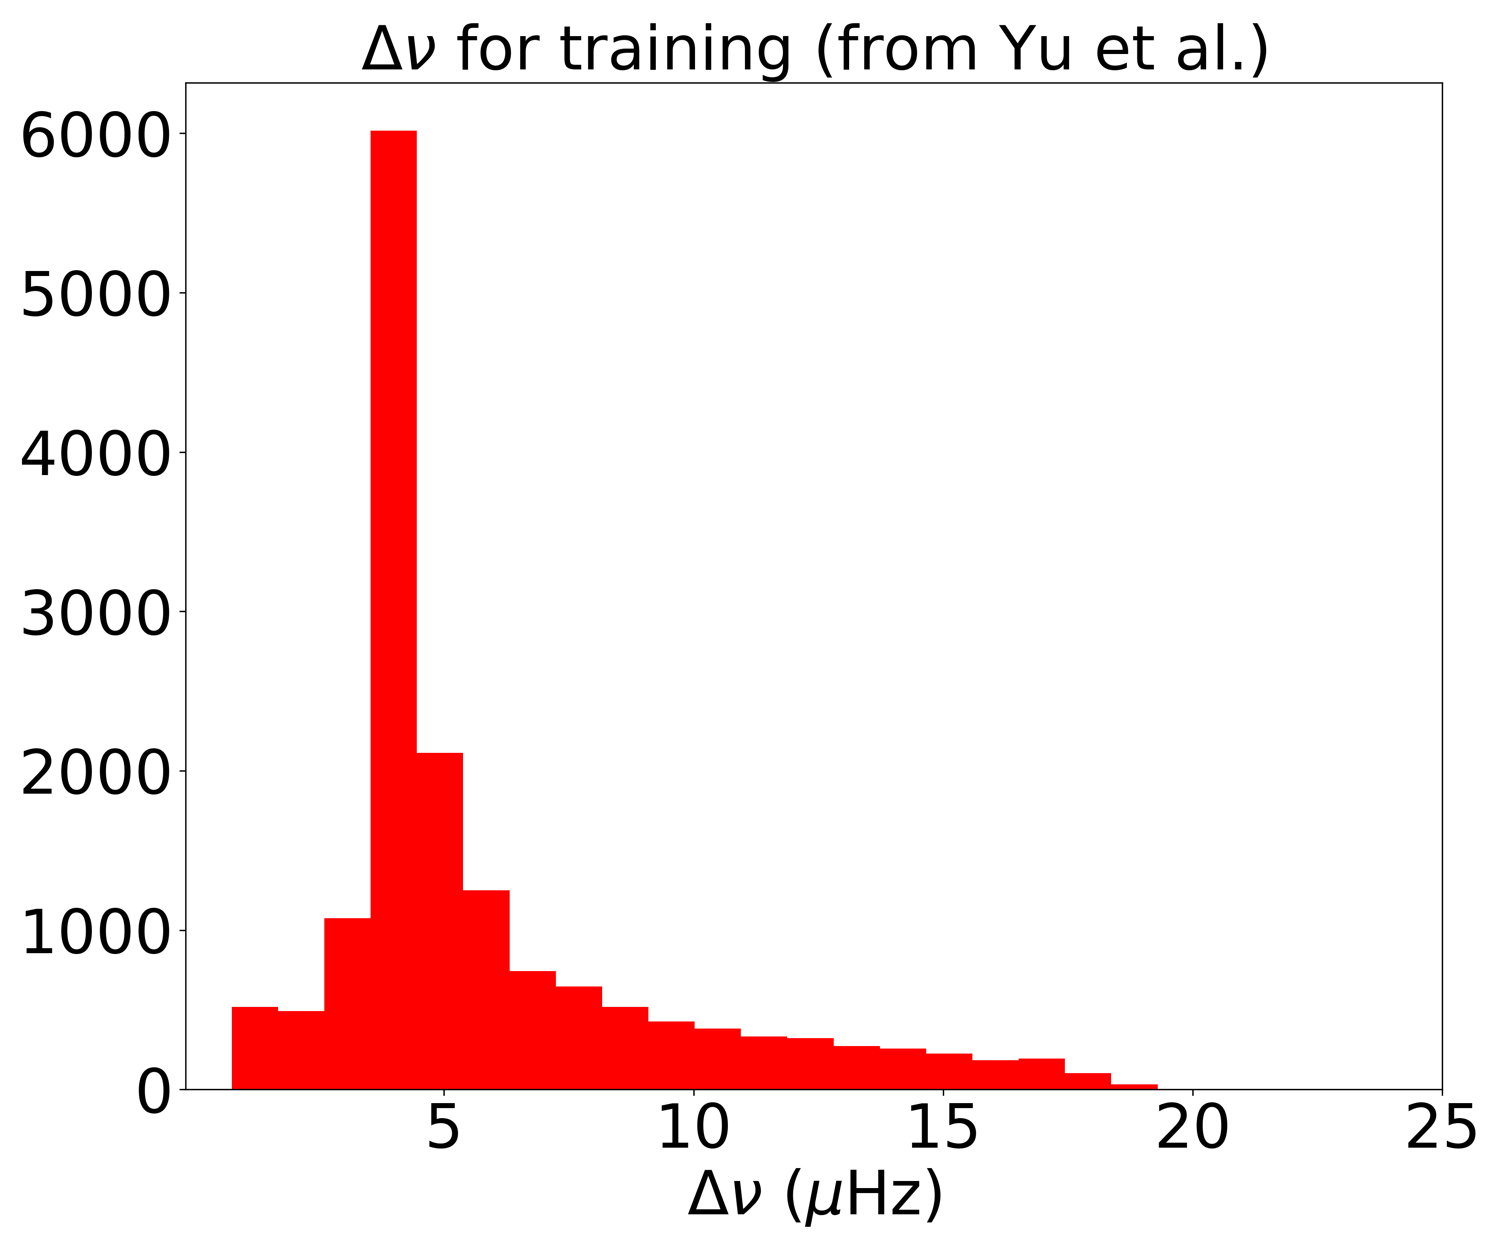
Figure 1: The distribution of $85$0 and $85$1 in the Kepler reference sample.
Model Architecture and Loss Functions
Delta $85$2 and $85$3 are inferred using a hybrid CNN-LSTM architecture: one-dimensional convolutional layers extract local flux-shape features followed by sequence-modeling LSTM layers for correlational structure, culminating in dense regressors. $85$4 is derived with a three-layer CNN, with dropout for uncertainty estimation via Monte Carlo Dropout. The input features are normalized Gaia XP spectra; the output is either the predicted quantity or its heteroskedastic error.
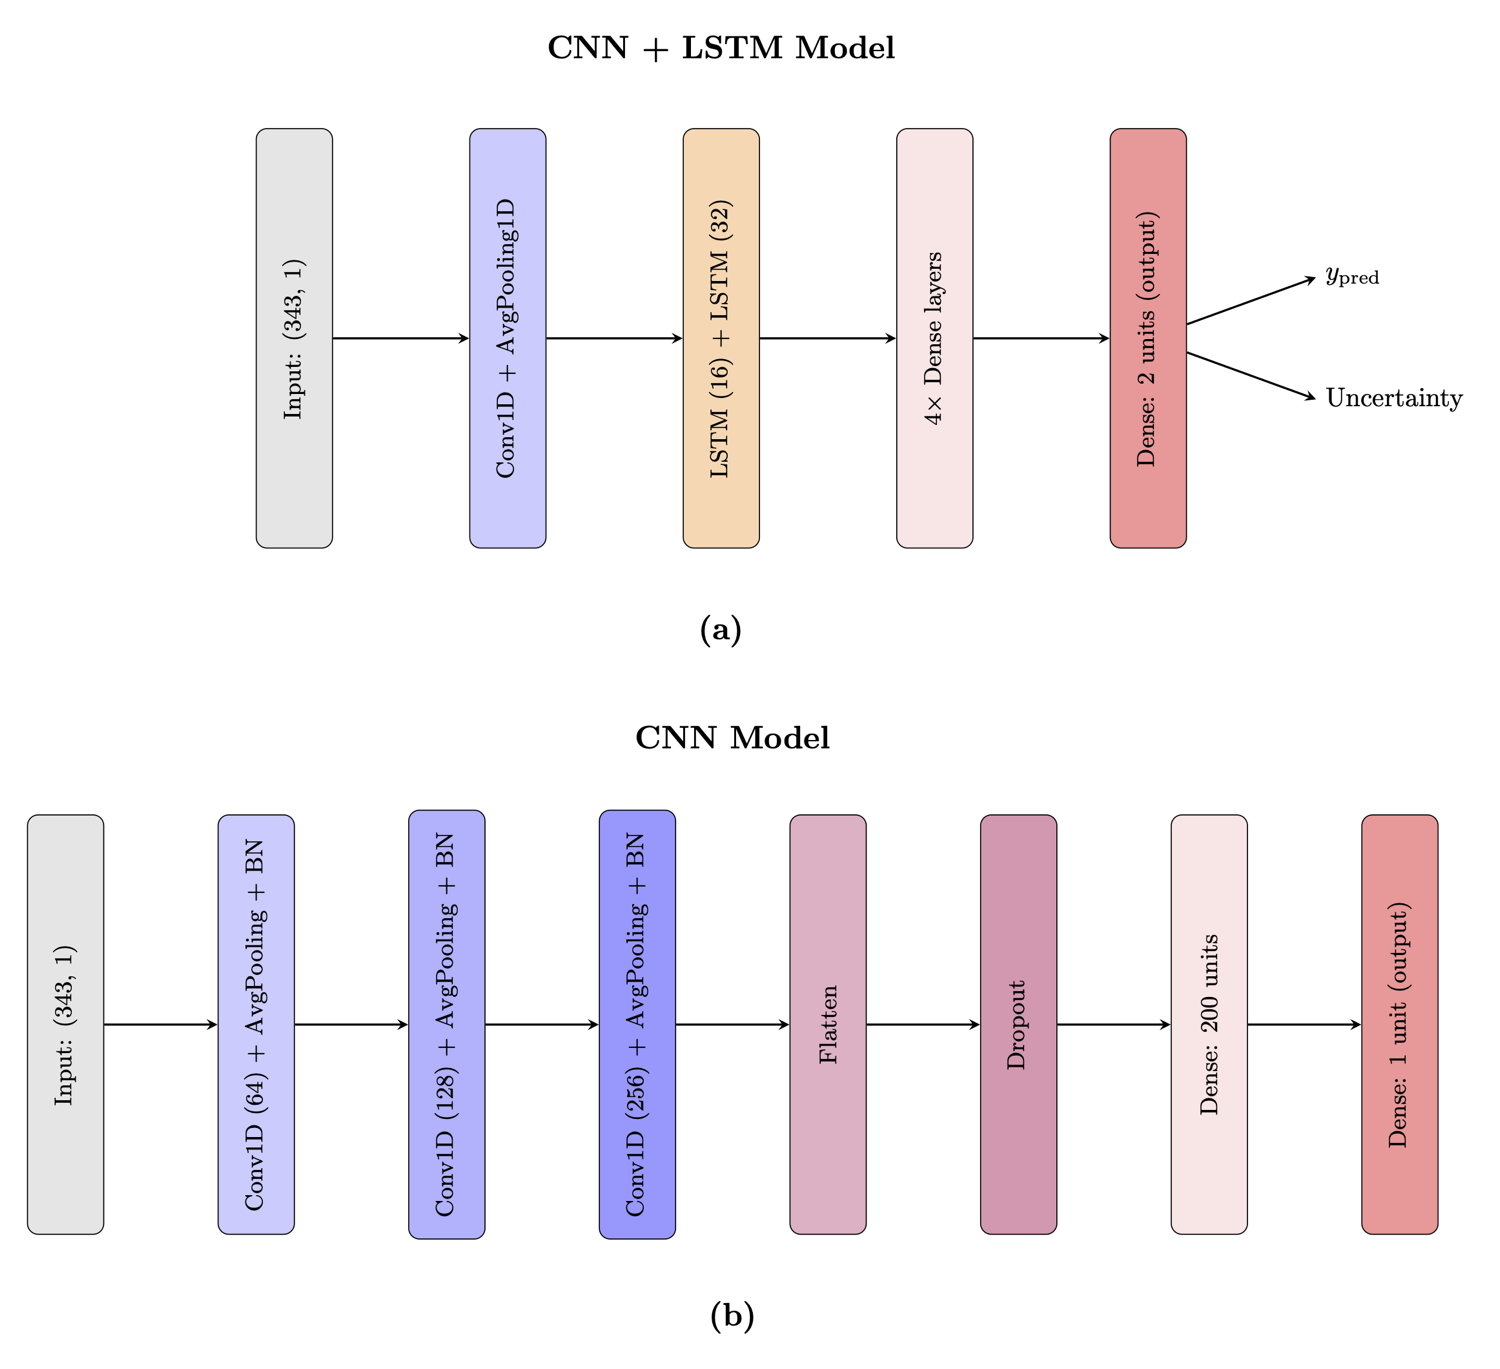
Figure 2: The hybrid CNN-LSTM and CNN-only architectures used to infer $85$5, $85$6, and $85$7 from Gaia XP spectra.
Distinct loss functions are optimized: heteroskedastic Laplacian and Gaussian log-likelihoods for $85$8 and $85$9; MAE for Δν0. The loss curves converge with minimal overfitting and strong generalization, as shown via five-fold cross-validation and comparison with linear and CNN-only ablations.
The CNN-LSTM models recover all three asteroseismic parameters from Gaia XP spectra with strong fidelity. On the test set: accuracy within 10% is 54.9%/46.2%/59.2% (for Δν1/Δν2/Δν3), and within 20% is 78.9%/70.5%/79.0%; median absolute percentage errors are 9.9%, 11.3%, and 8.4%. Predictions remain within 20% error for the majority of the sample, with no strong degradation at higher extinction or low metallicity (Δν4[M/H]Δν5).
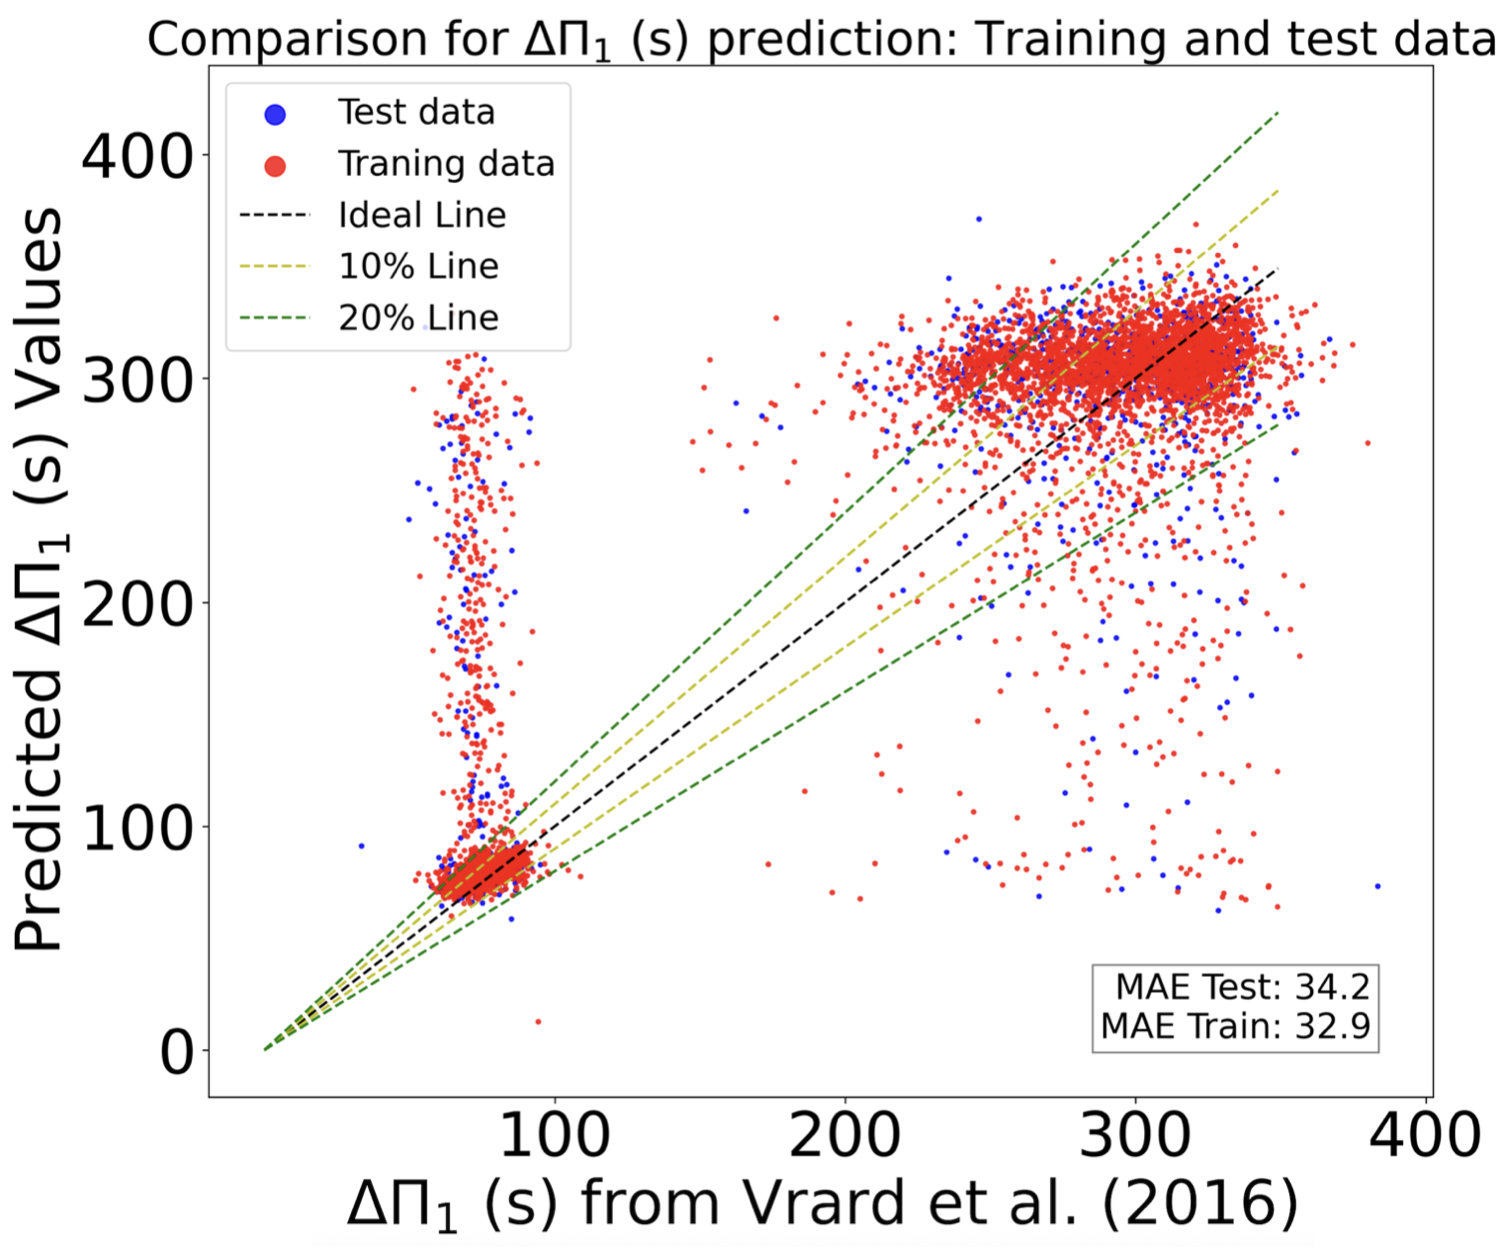
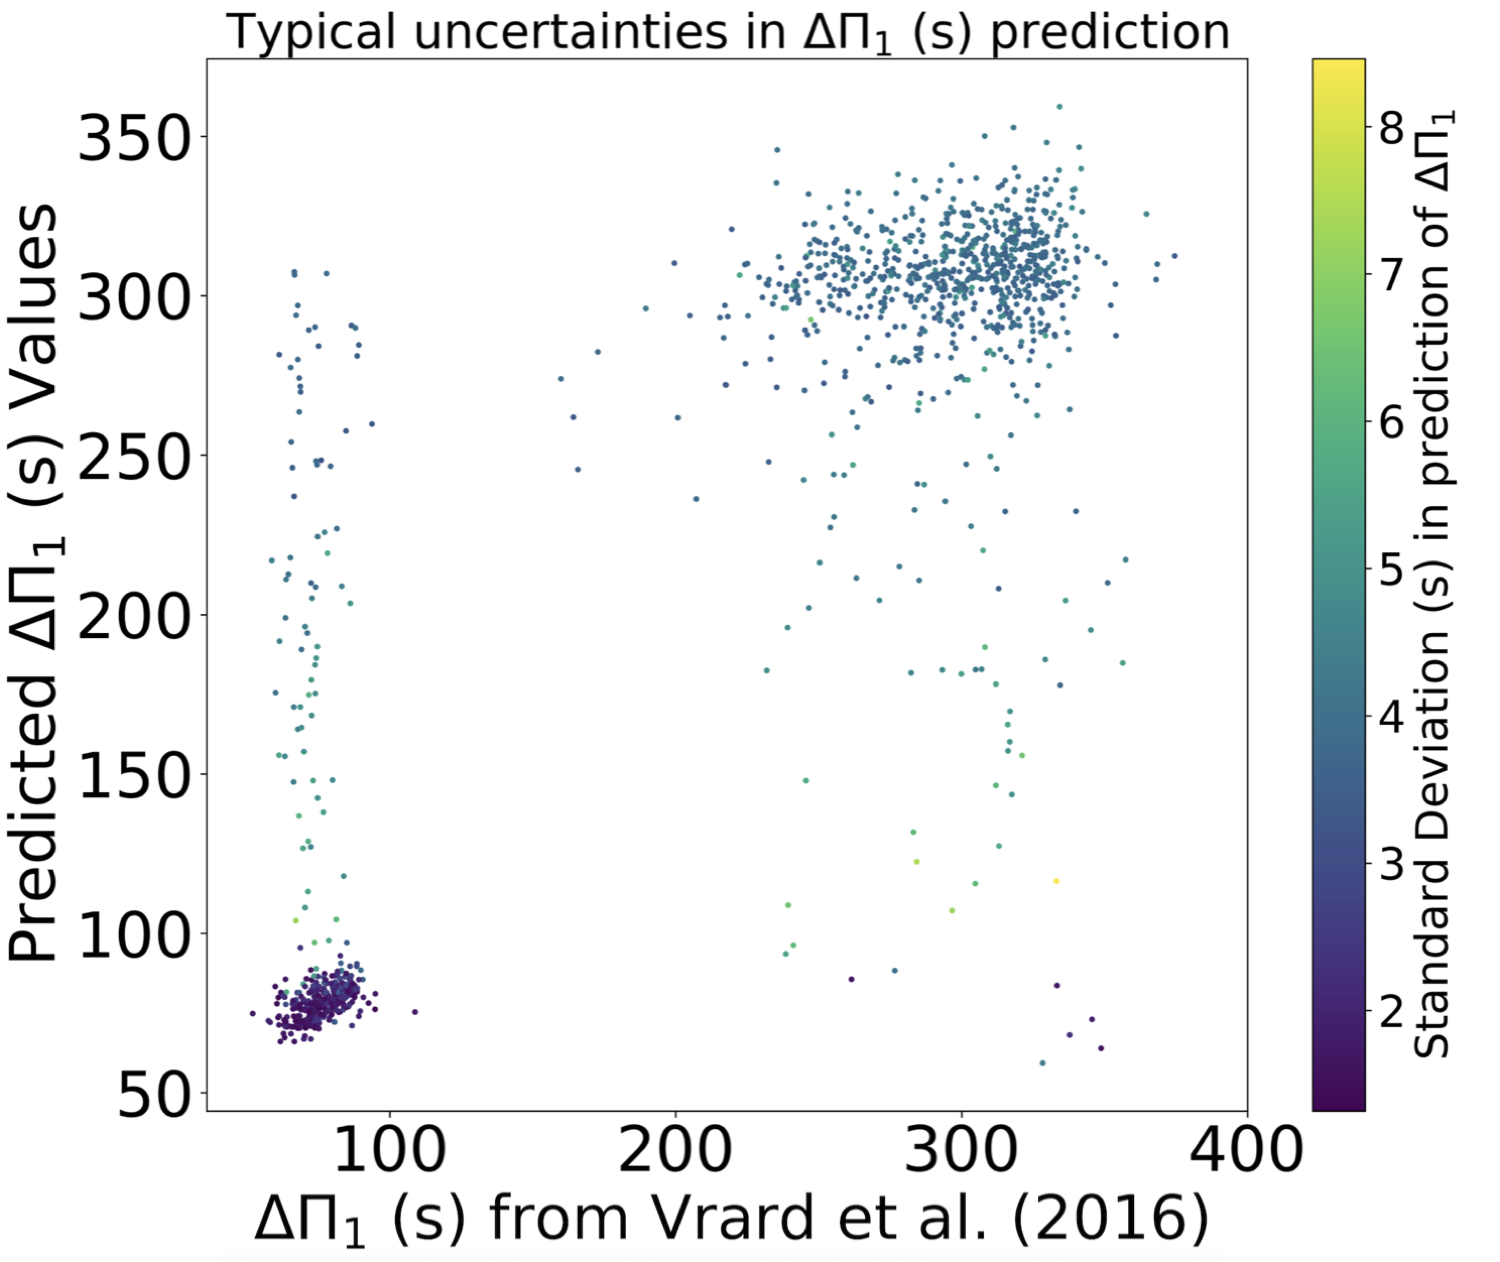
Figure 3: Model measurements for Δν6 and assessment of Monte Carlo Dropout-predicted uncertainty distributions.
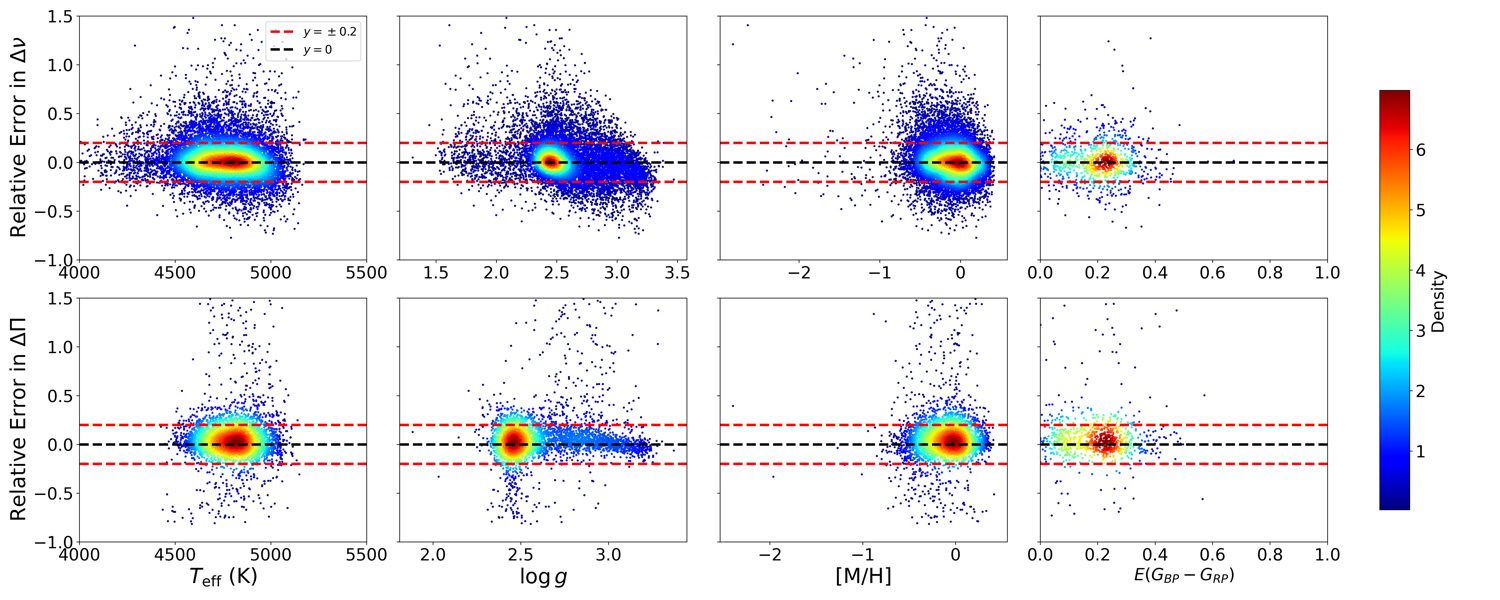
Figure 4: Relative errors in predicted Δν7 and Δν8 across Δν9, νmax0, [M/H], and reddening.
Key population-level correlations such as the νmax1–νmax2 power-law are recovered with high precision, matching Kepler slopes within error bars.
Gaia-Scale Inference and Parameter Space Analysis
Applying the models to 2.5 million Gaia DR3 red giants, the characteristic structures of the asteroseismic νmax3–νmax4 plane are reproduced: separation of the RC and RGB, and the presence of evolutionary features traced in the literature. Notably, the study reports a statistically significant arm-like structure in the νmax5 s, νmax6 νmax7Hz regime, a region theoretically associated with post-He-flash stellar evolution and rarely sampled previously. This feature persists for both solar and low-metallicity stars, consistent with secondary clump/post-He-flash evolutionary tracks predicted by MESA models but not previously confirmed at population scale.
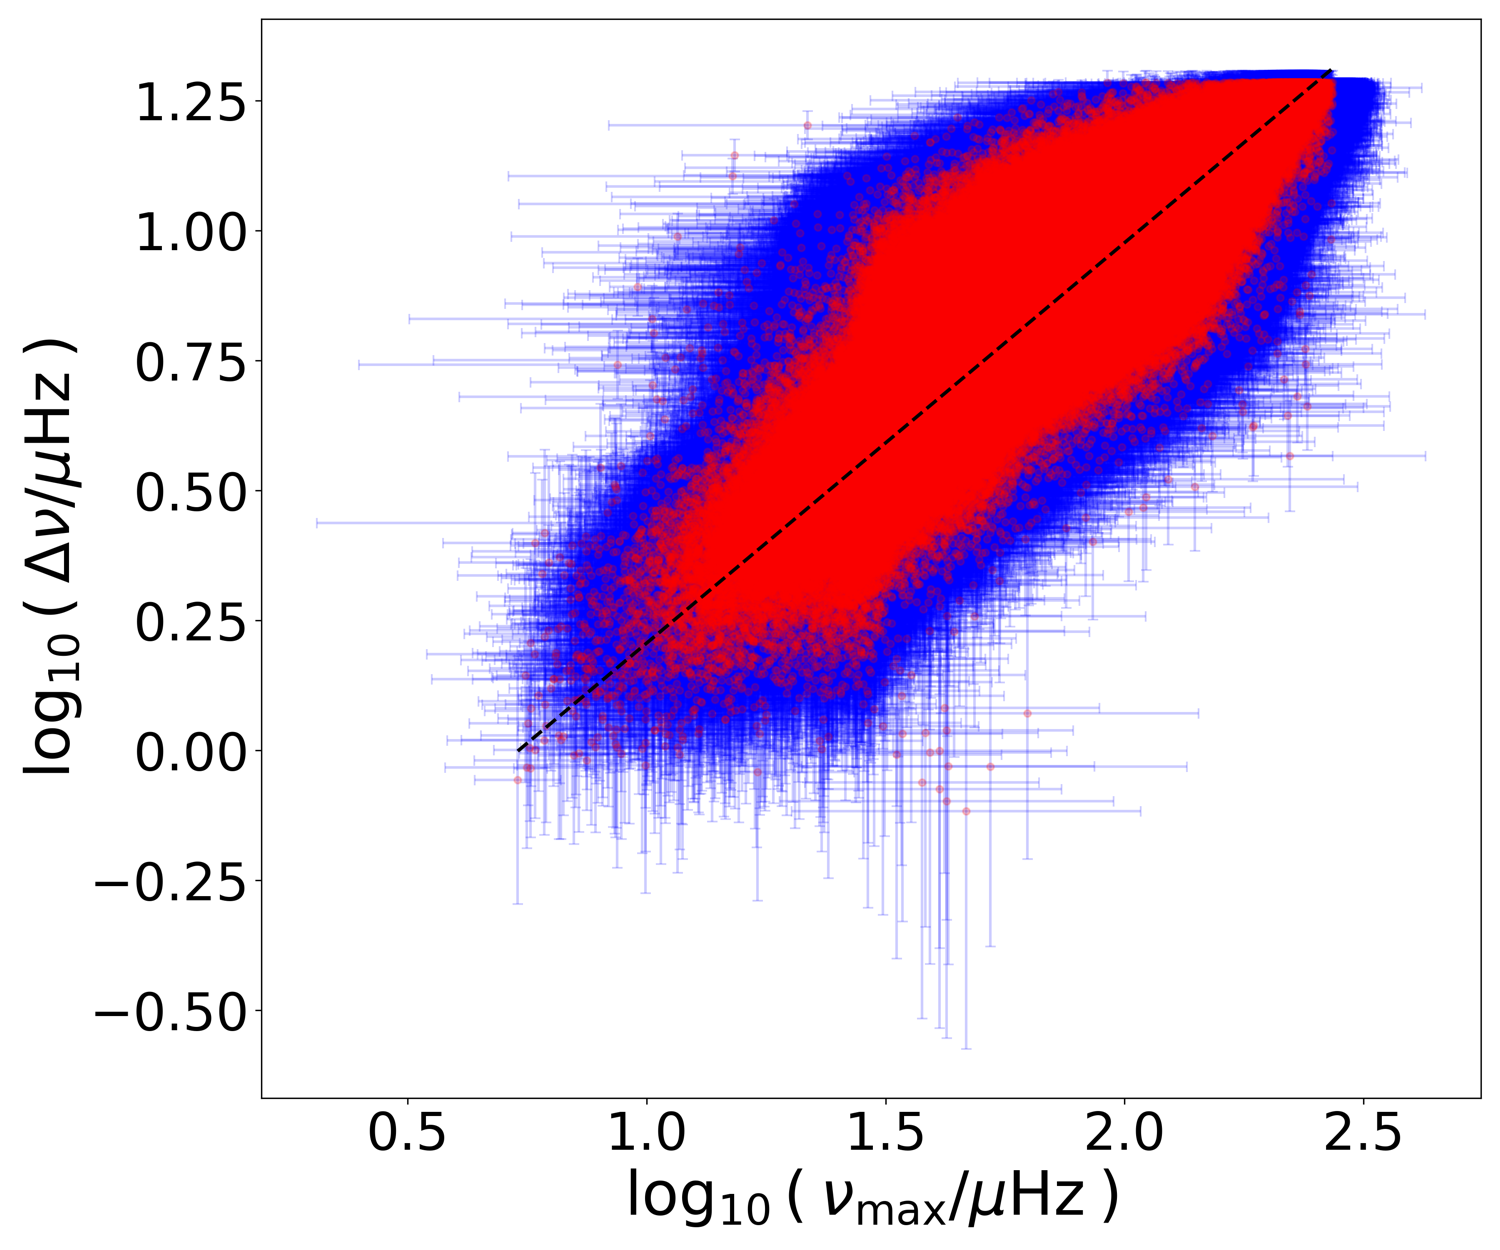
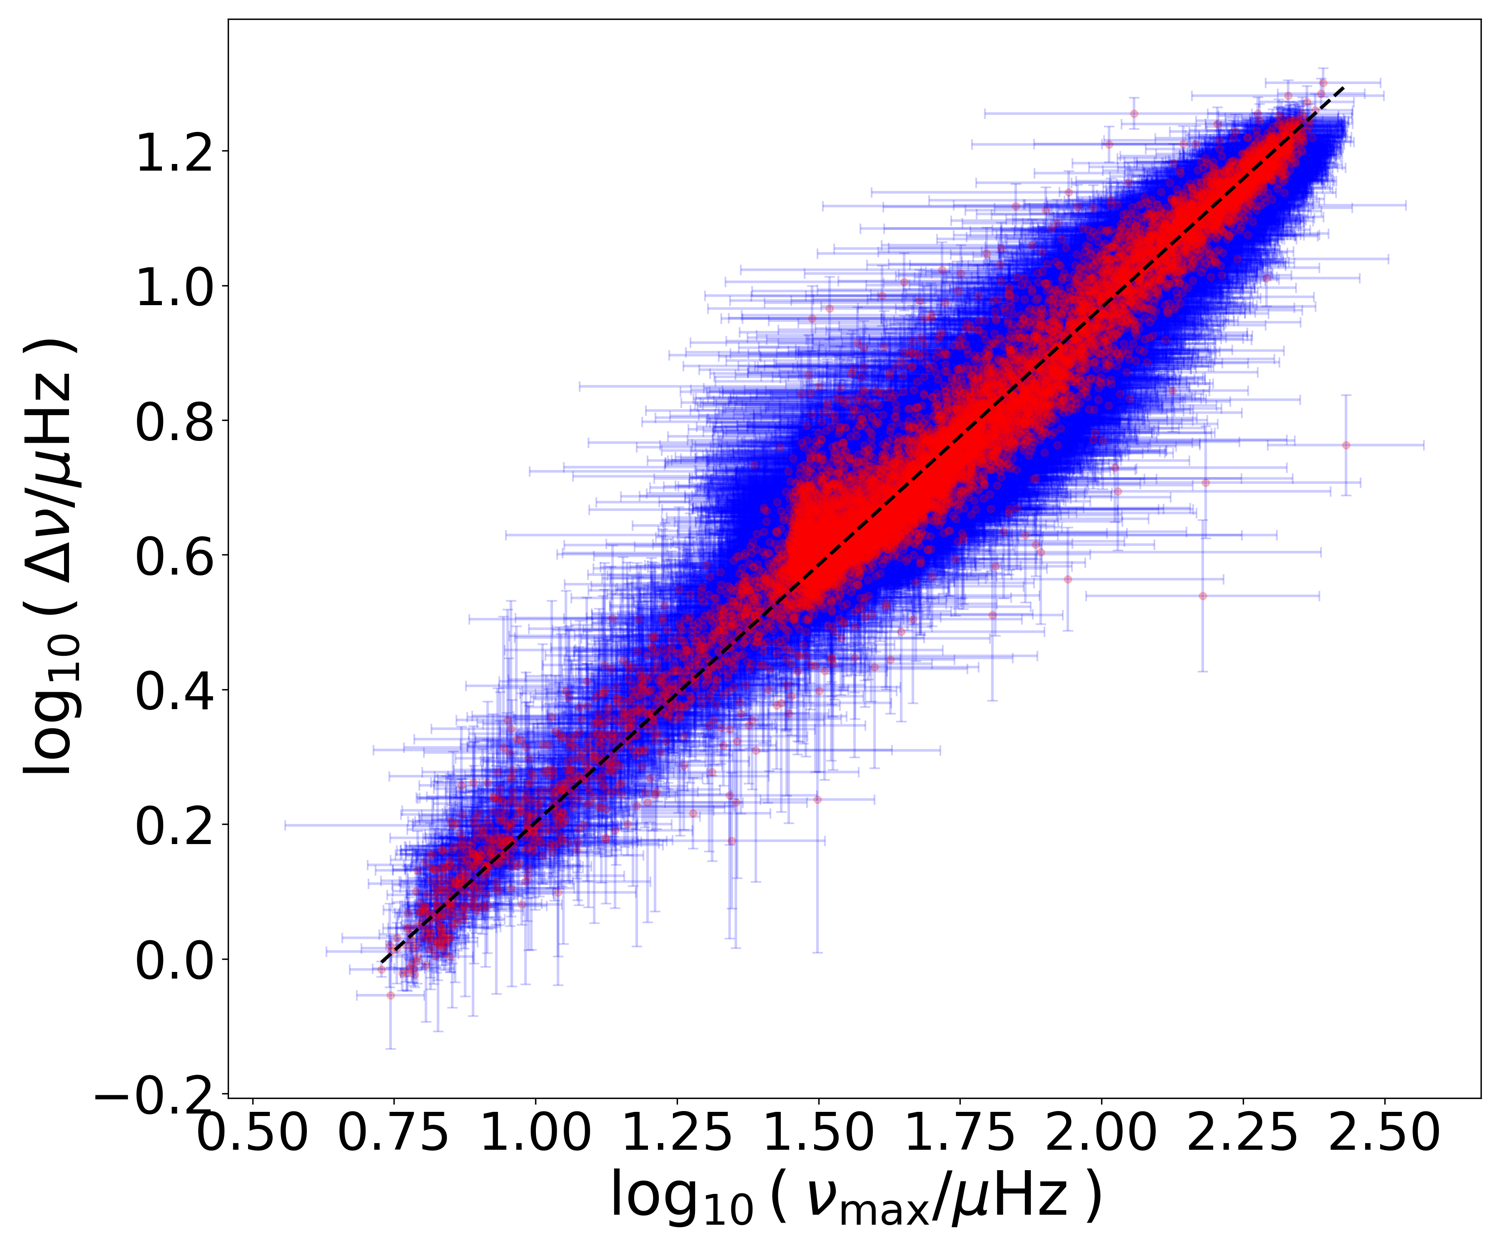
Figure 5: Predictions of νmax8 and νmax9 for all Gaia stars, revealing structure in the global asteroseismic parameter space.
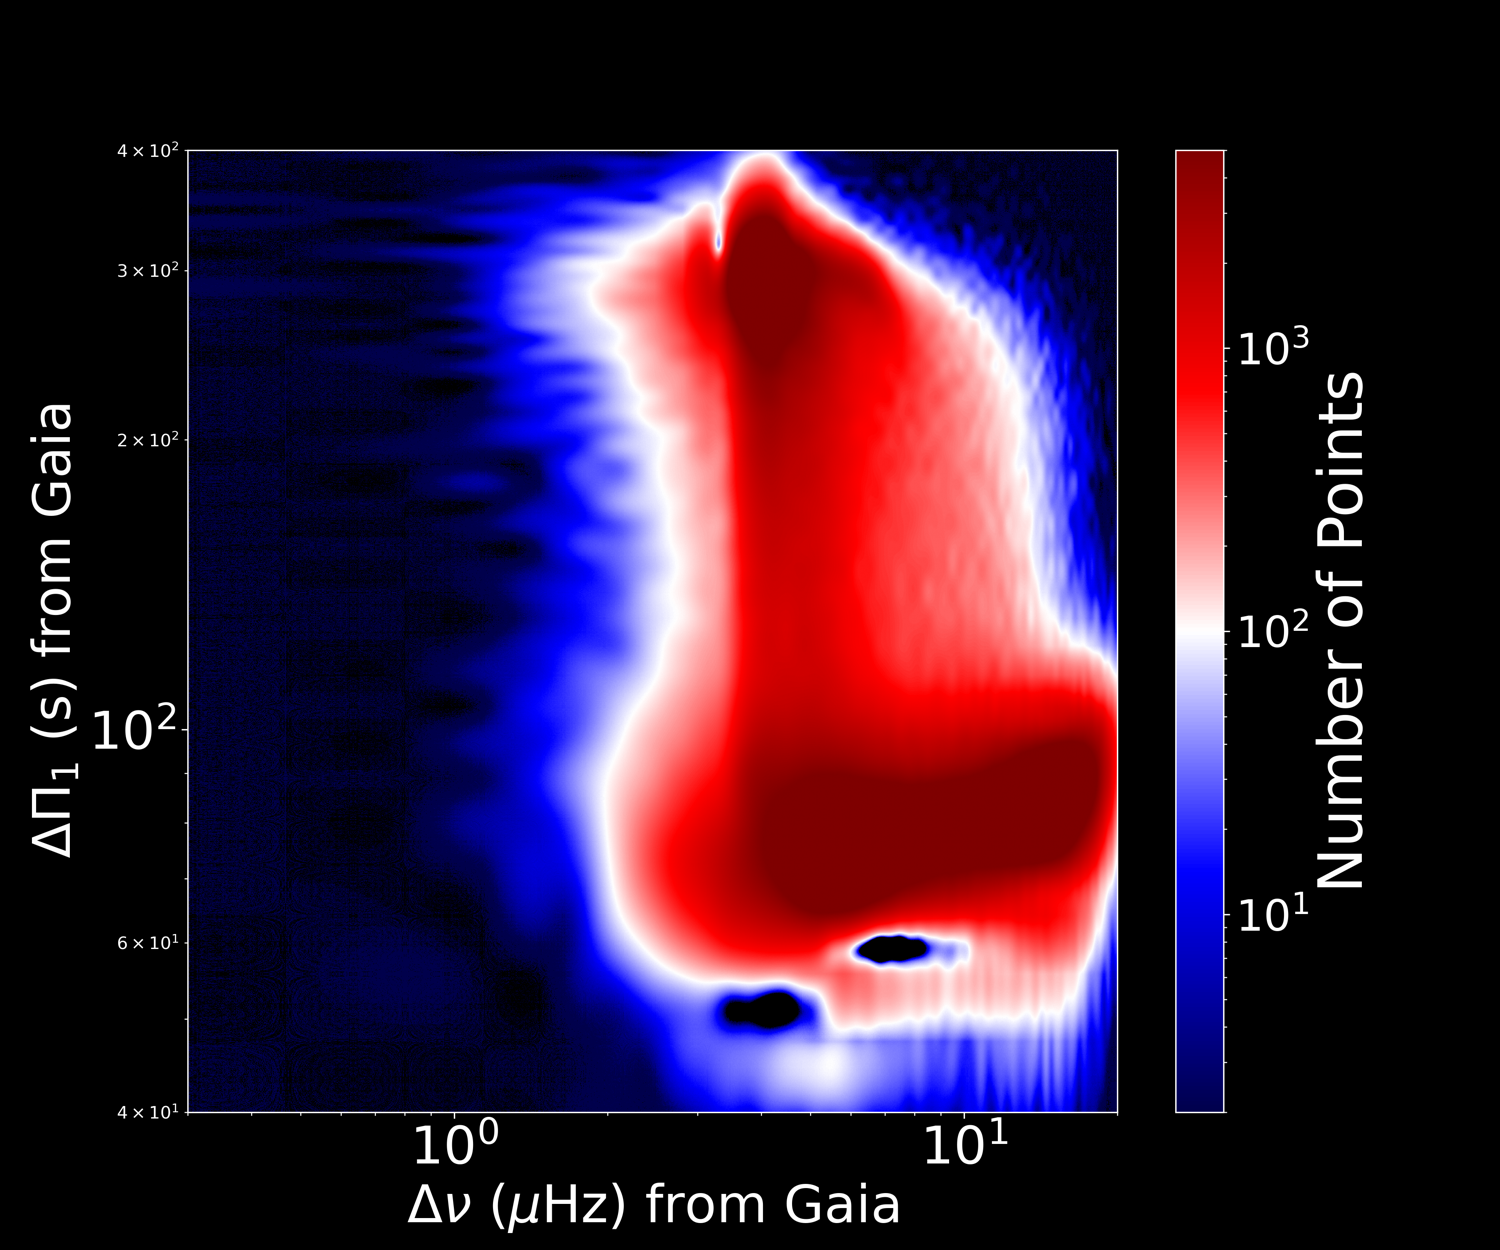
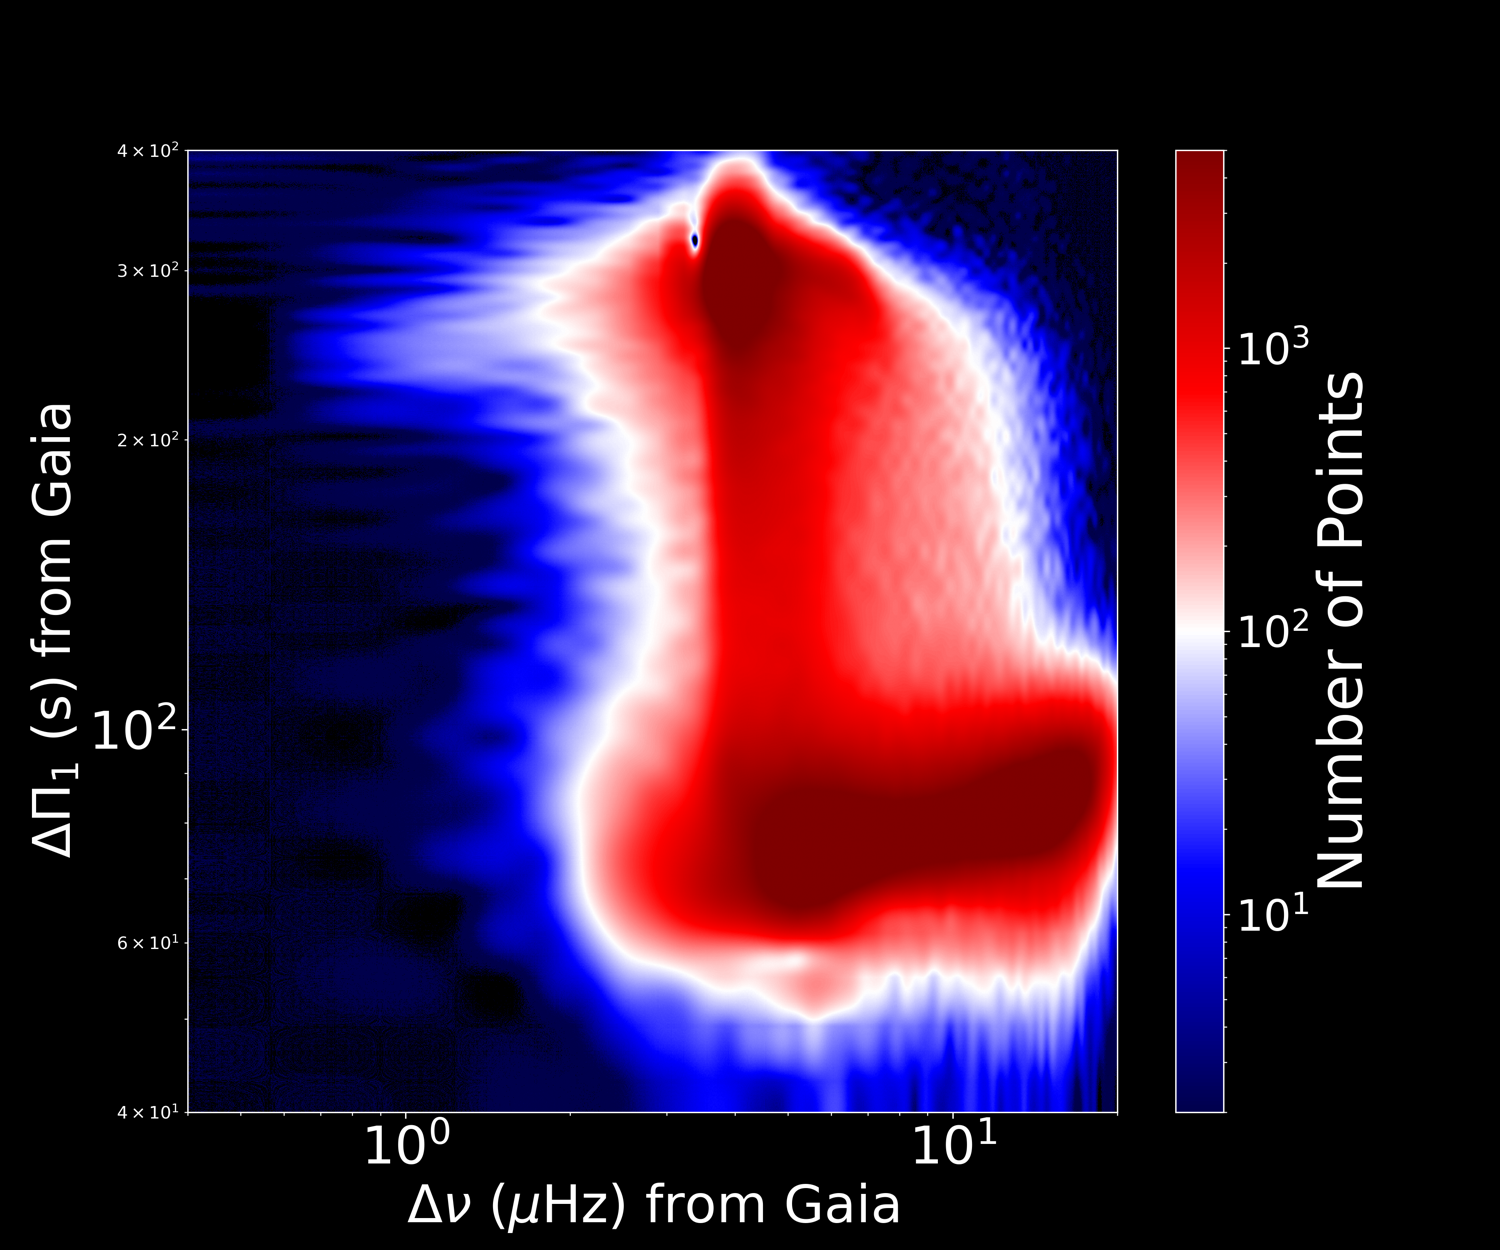
Figure 6: The ΔΠ10–ΔΠ11 plane for 2.5M Gaia DR3 red giants, showing RGB/RC loci and the distinct arm-like feature at low ΔΠ12, ΔΠ13 s.
Model Interpretation: Saliency Analysis
Gradient-based saliency methods are deployed to identify which XP spectral regions drive the model's distinction between RGB and RC stars. The results show that, while the blue (330–600 nm) is largely uninformative, pronounced differential saliency emerges in the red (600–850 nm), specifically in broad regions encompassing 658–664, 685–699, and 820–834 nm, despite Gaia XP’s severe blending of line diagnostics. The CNN-LSTM leverages subtle continuum-shape and molecular-band absorption contrasts, capturing integrated signature differences in global flux rather than resolved lines.
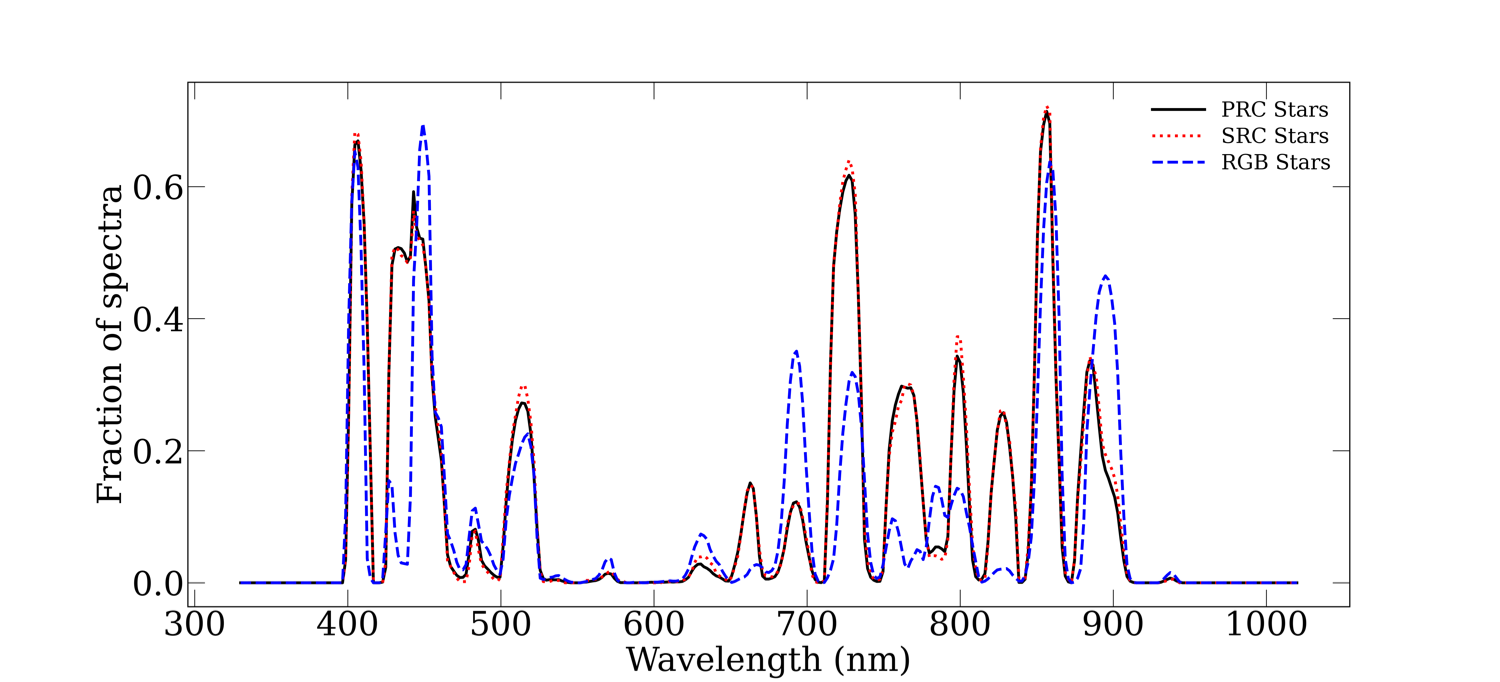
Figure 7: Saliency maps showing the spectral regions contributing to differentiation between RGBs and RCs in the ΔΠ14 model.
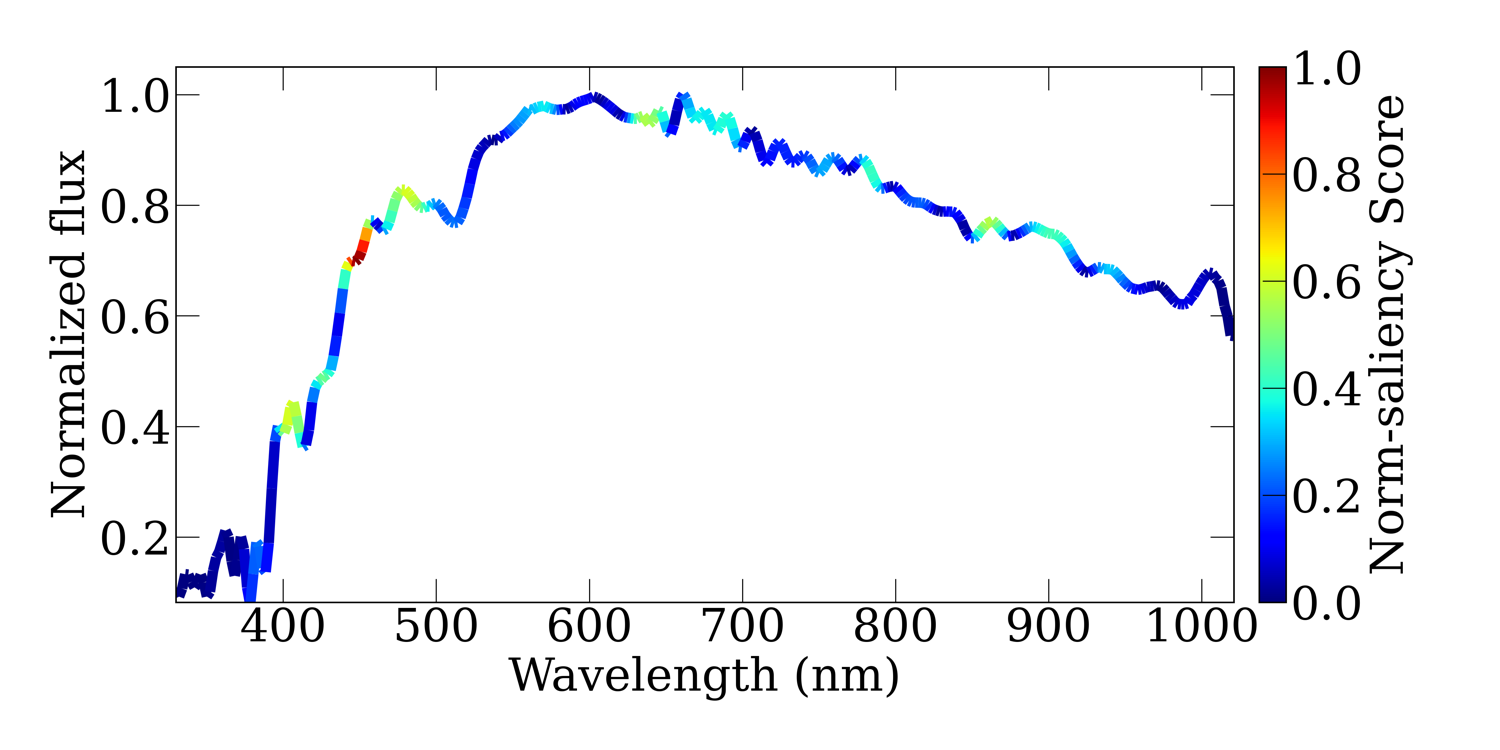
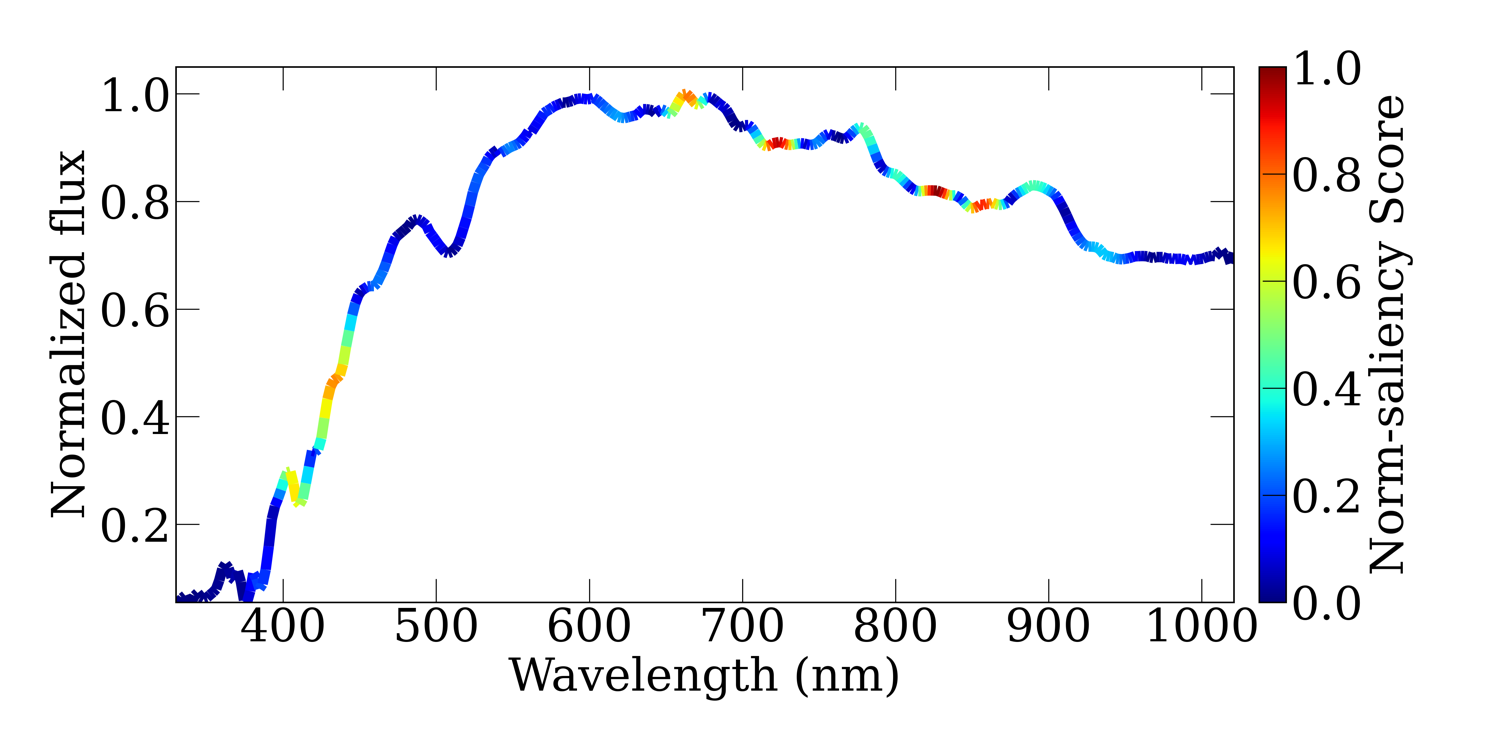
Figure 8: Saliency overlay on Gaia XP spectra for an RGB versus RC star, emphasizing enhanced red-region importance in RCs.
Additional analysis quantifies wavelength-dependent saliency trends across ΔΠ15 and ΔΠ16; distinct bands show systematic increases or decreases in sensitivity along evolutionary sequences.
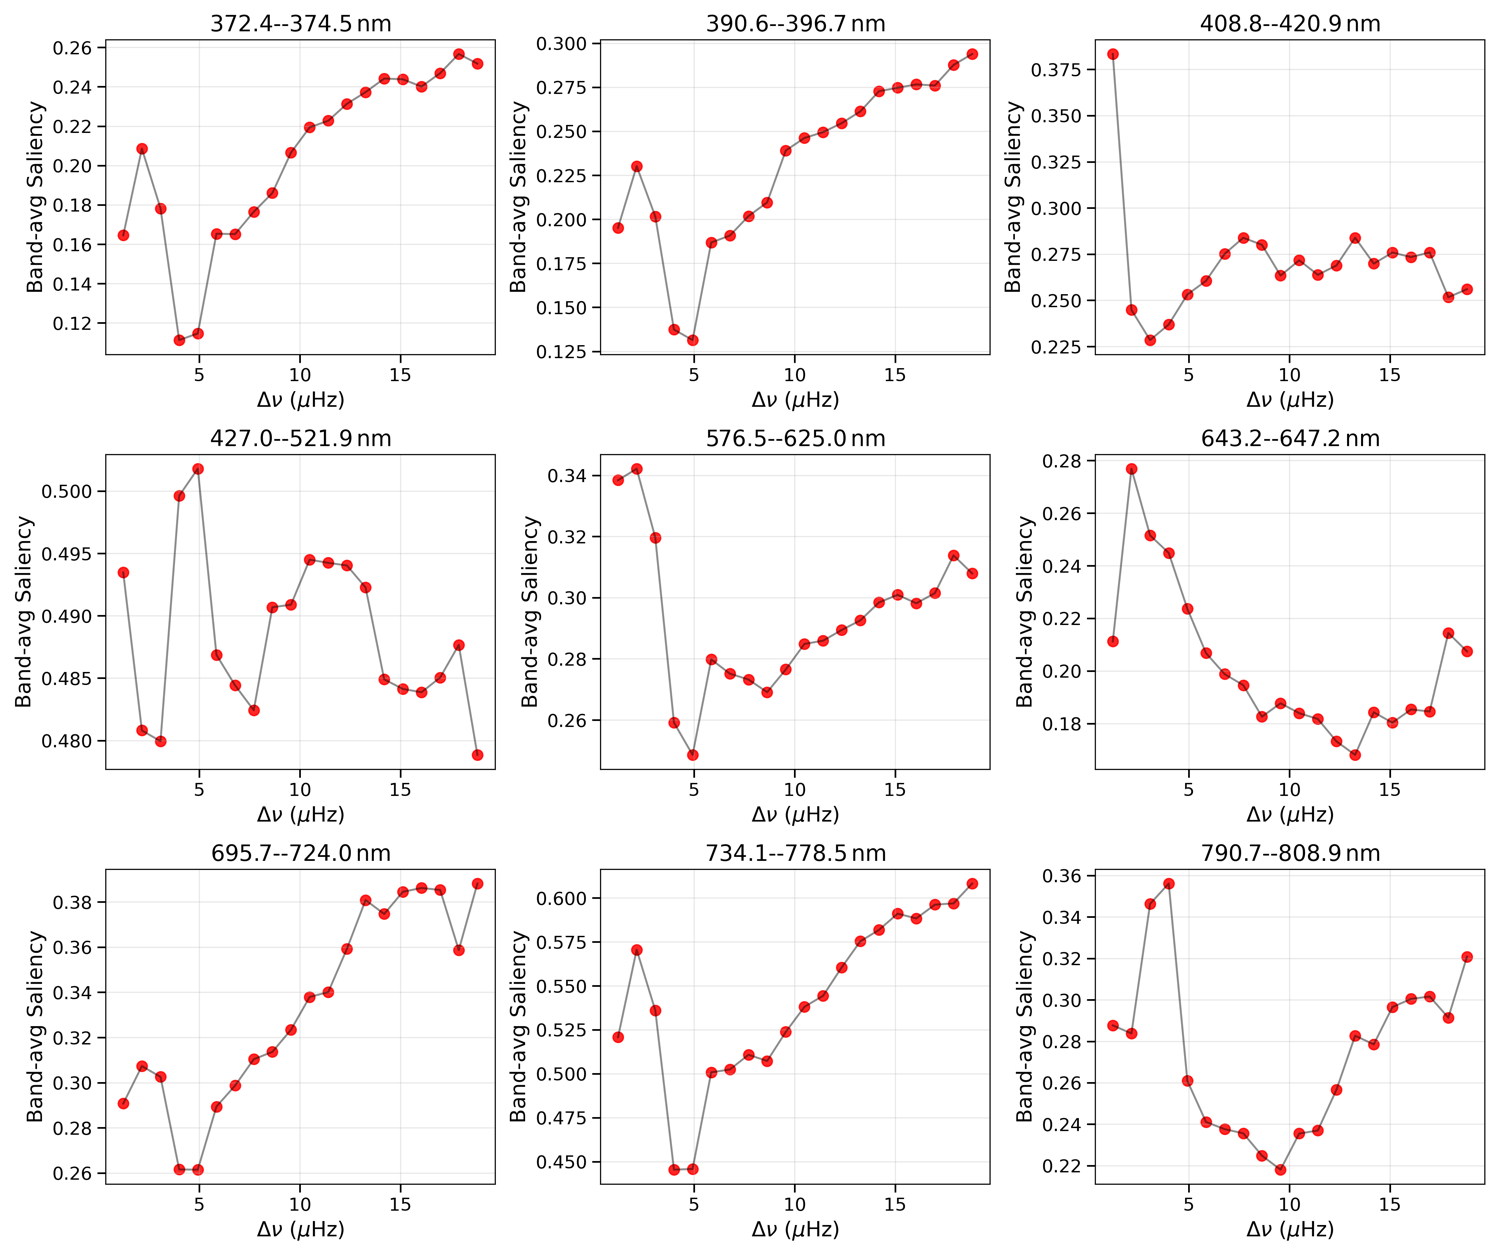
Figure 9: Saliency as a function of ΔΠ17 for select wavelength bands in RGB giants.
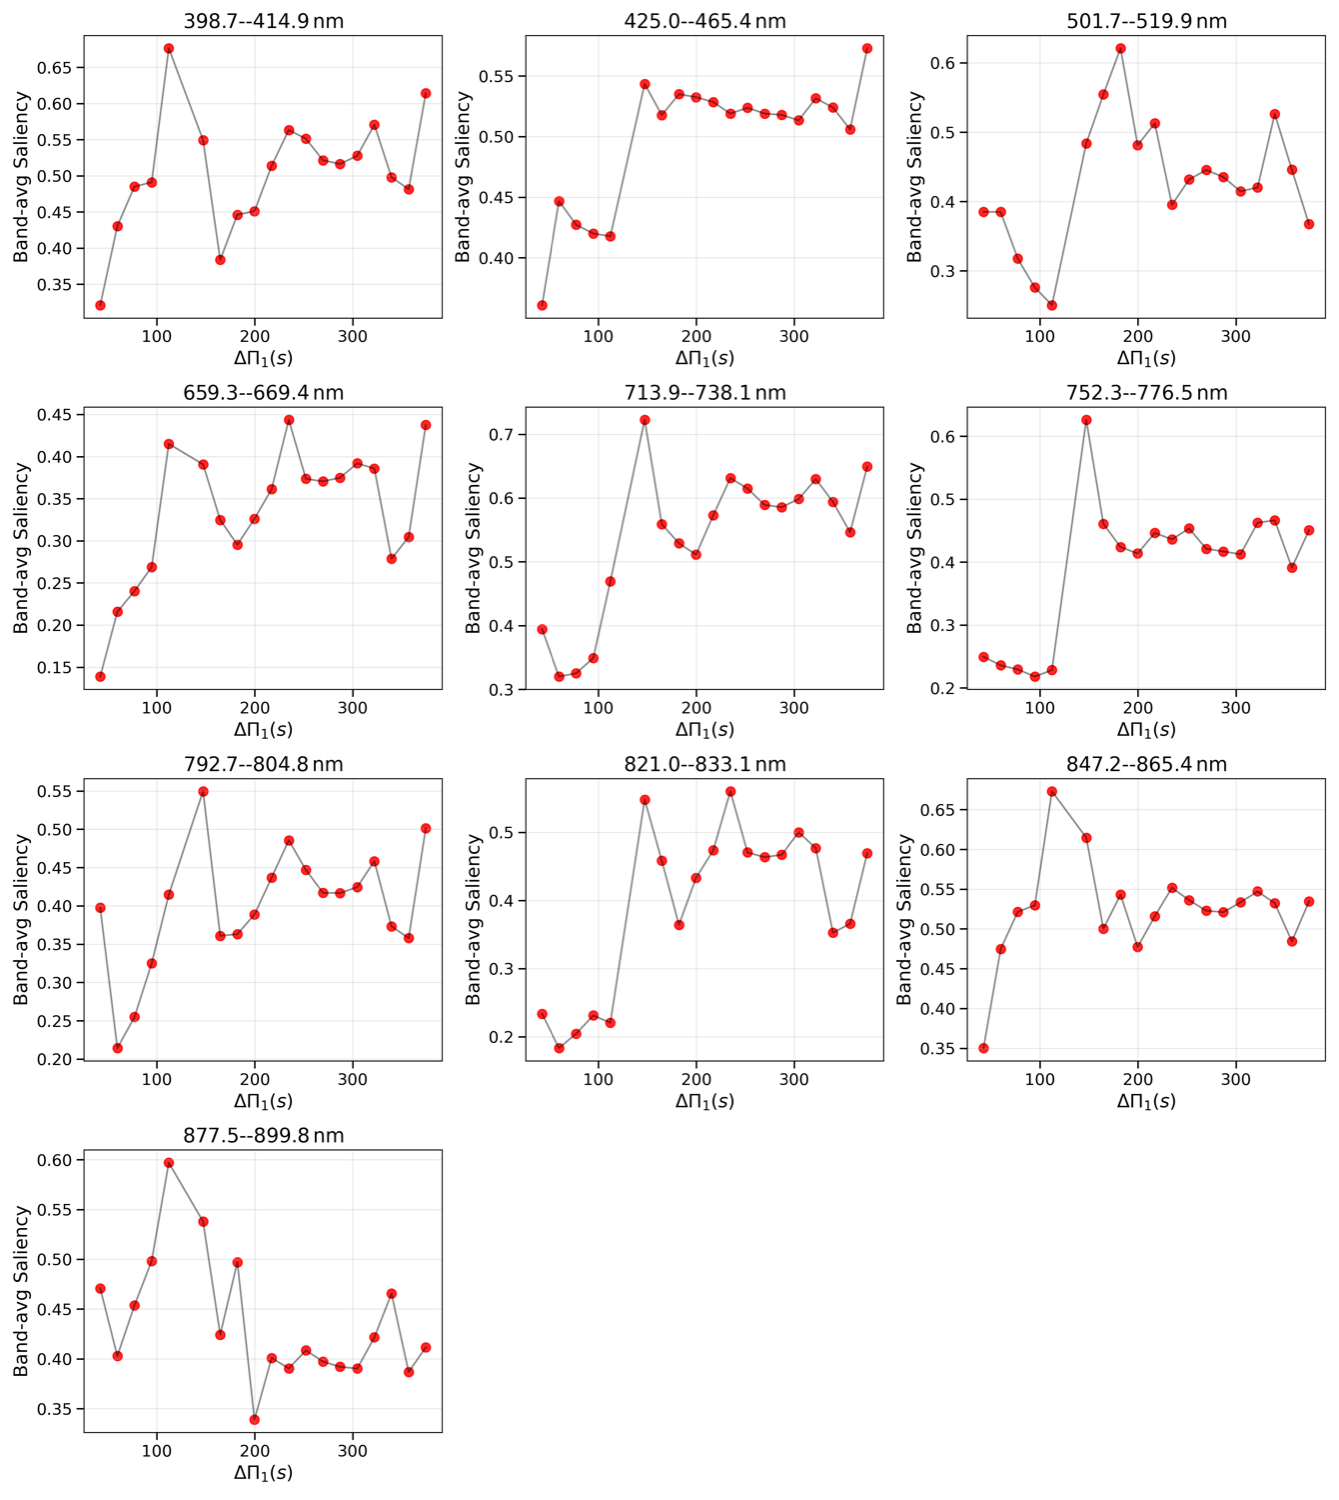
Figure 10: Saliency trends as a function of ΔΠ18 for select wavelength bands.
External Validation and Consistency Checks
Robustness is assessed via external comparison with independent asteroseismic and spectroscopic catalogs (from Kepler power spectra and LAMOST). Gaia XP-inferred ΔΠ19 and ∼0 show high degree of agreement with those derived from higher-resolution data; accuracy within 10% can reach 71% for Gaia-LAMOST matching, with no catastrophic divergence for RC/RGB discrimination.
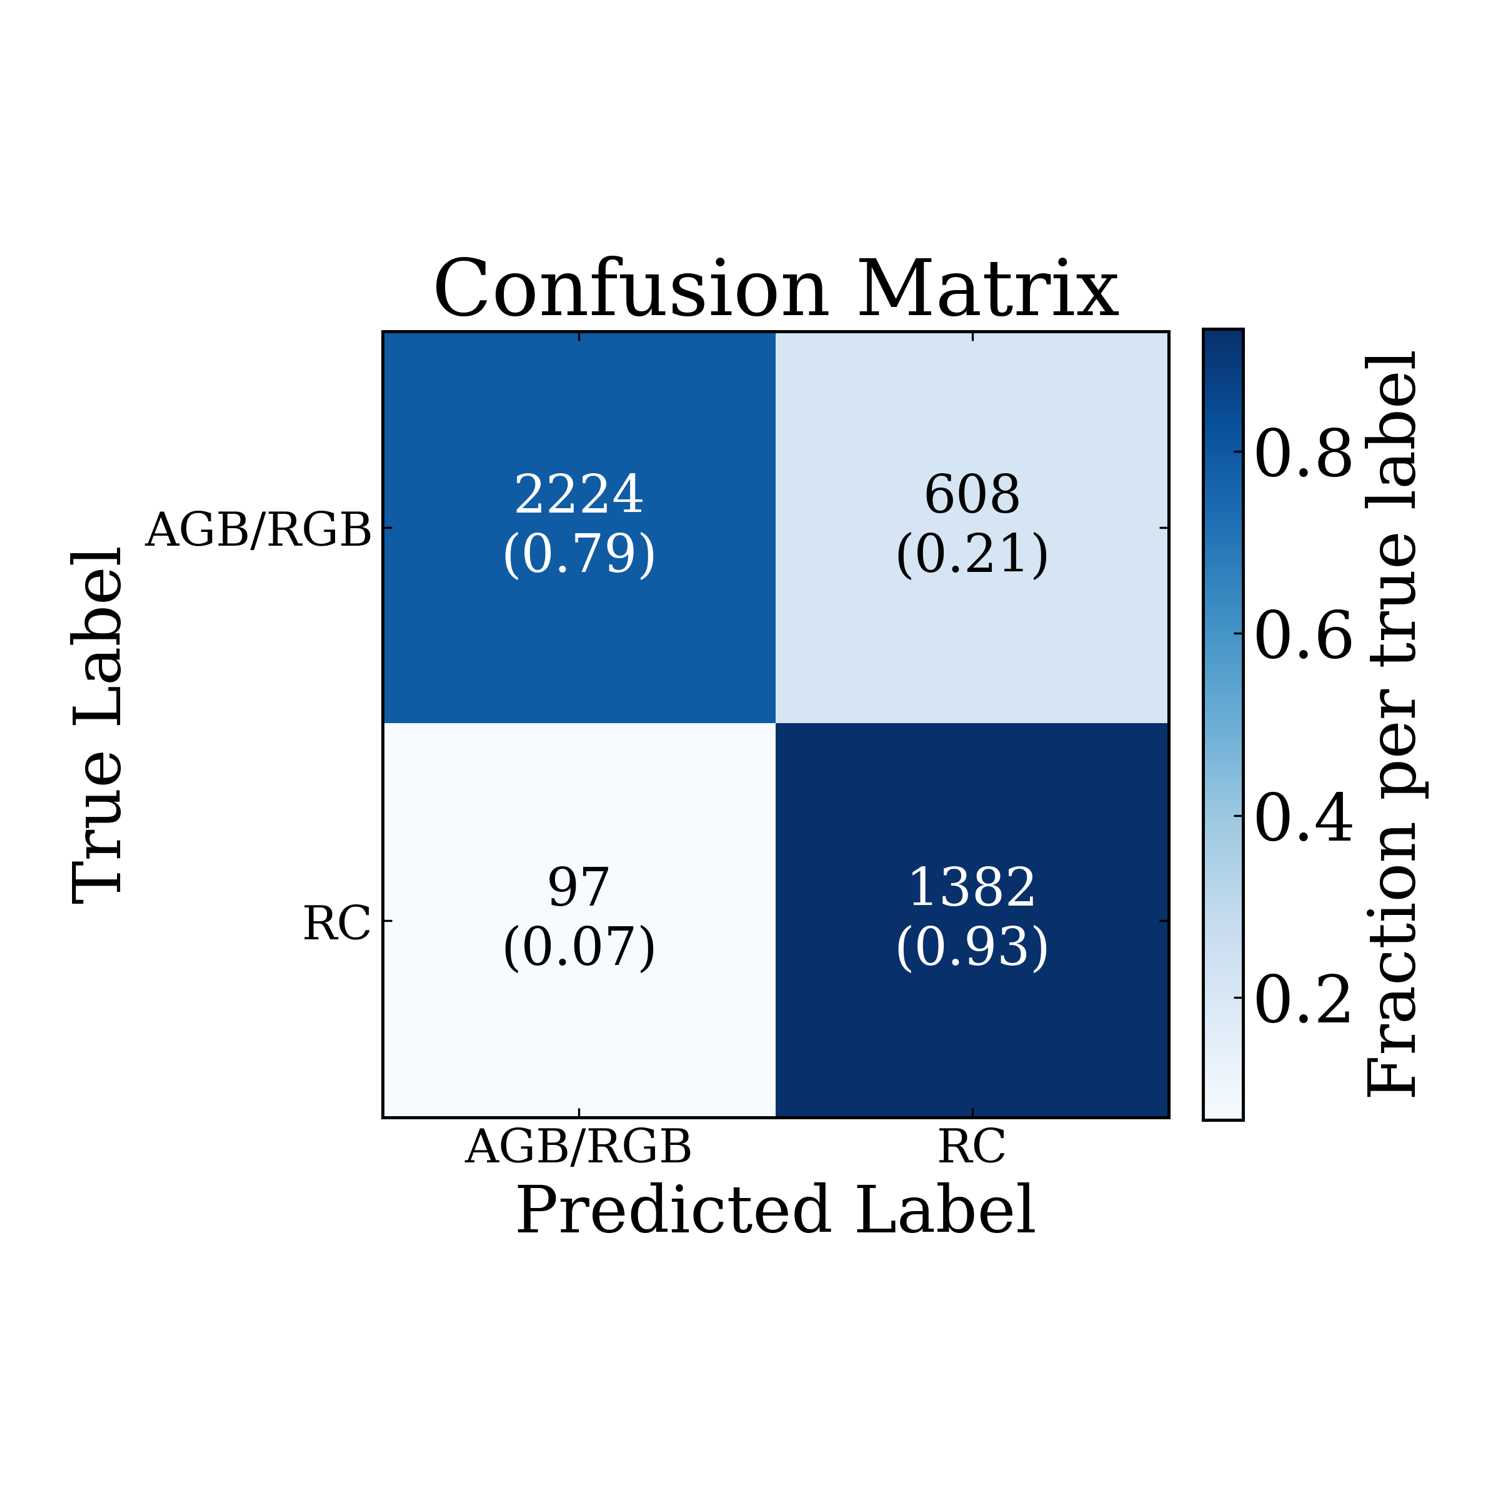
Figure 11: Confusion matrix for ∼1-based classification versus evolutionary status from an independent Kepler-based catalog.
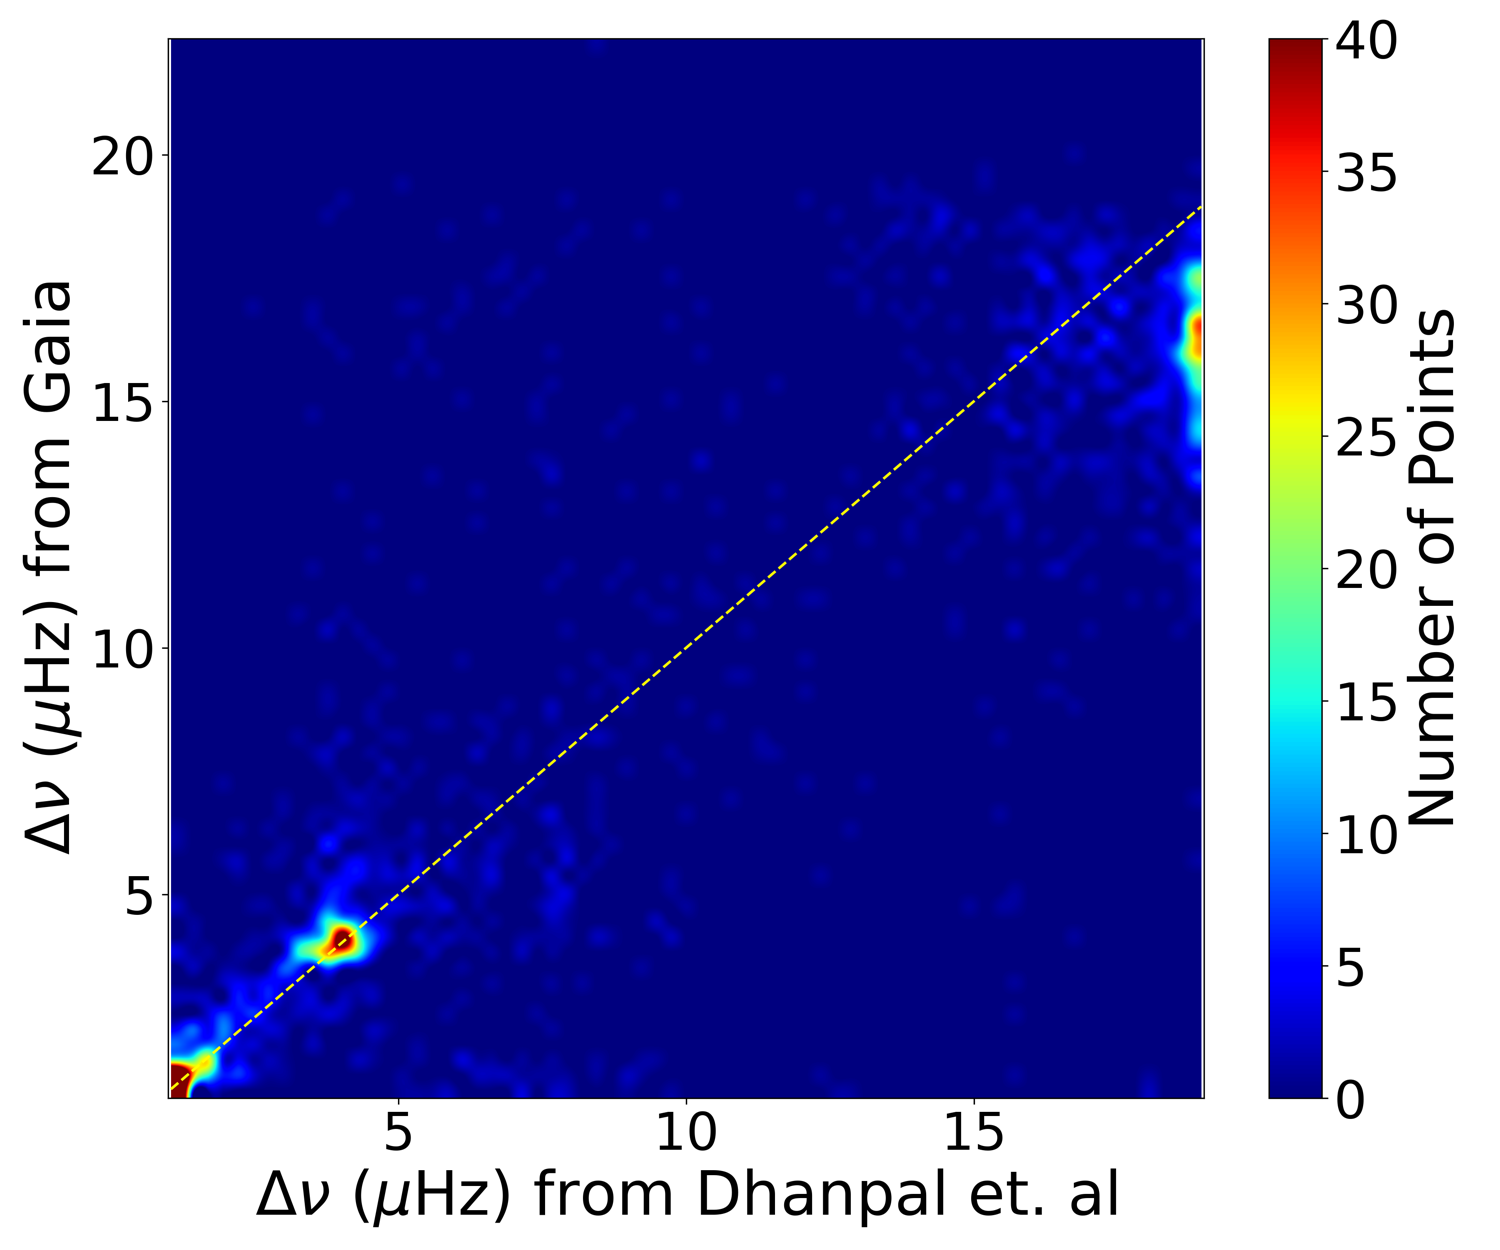
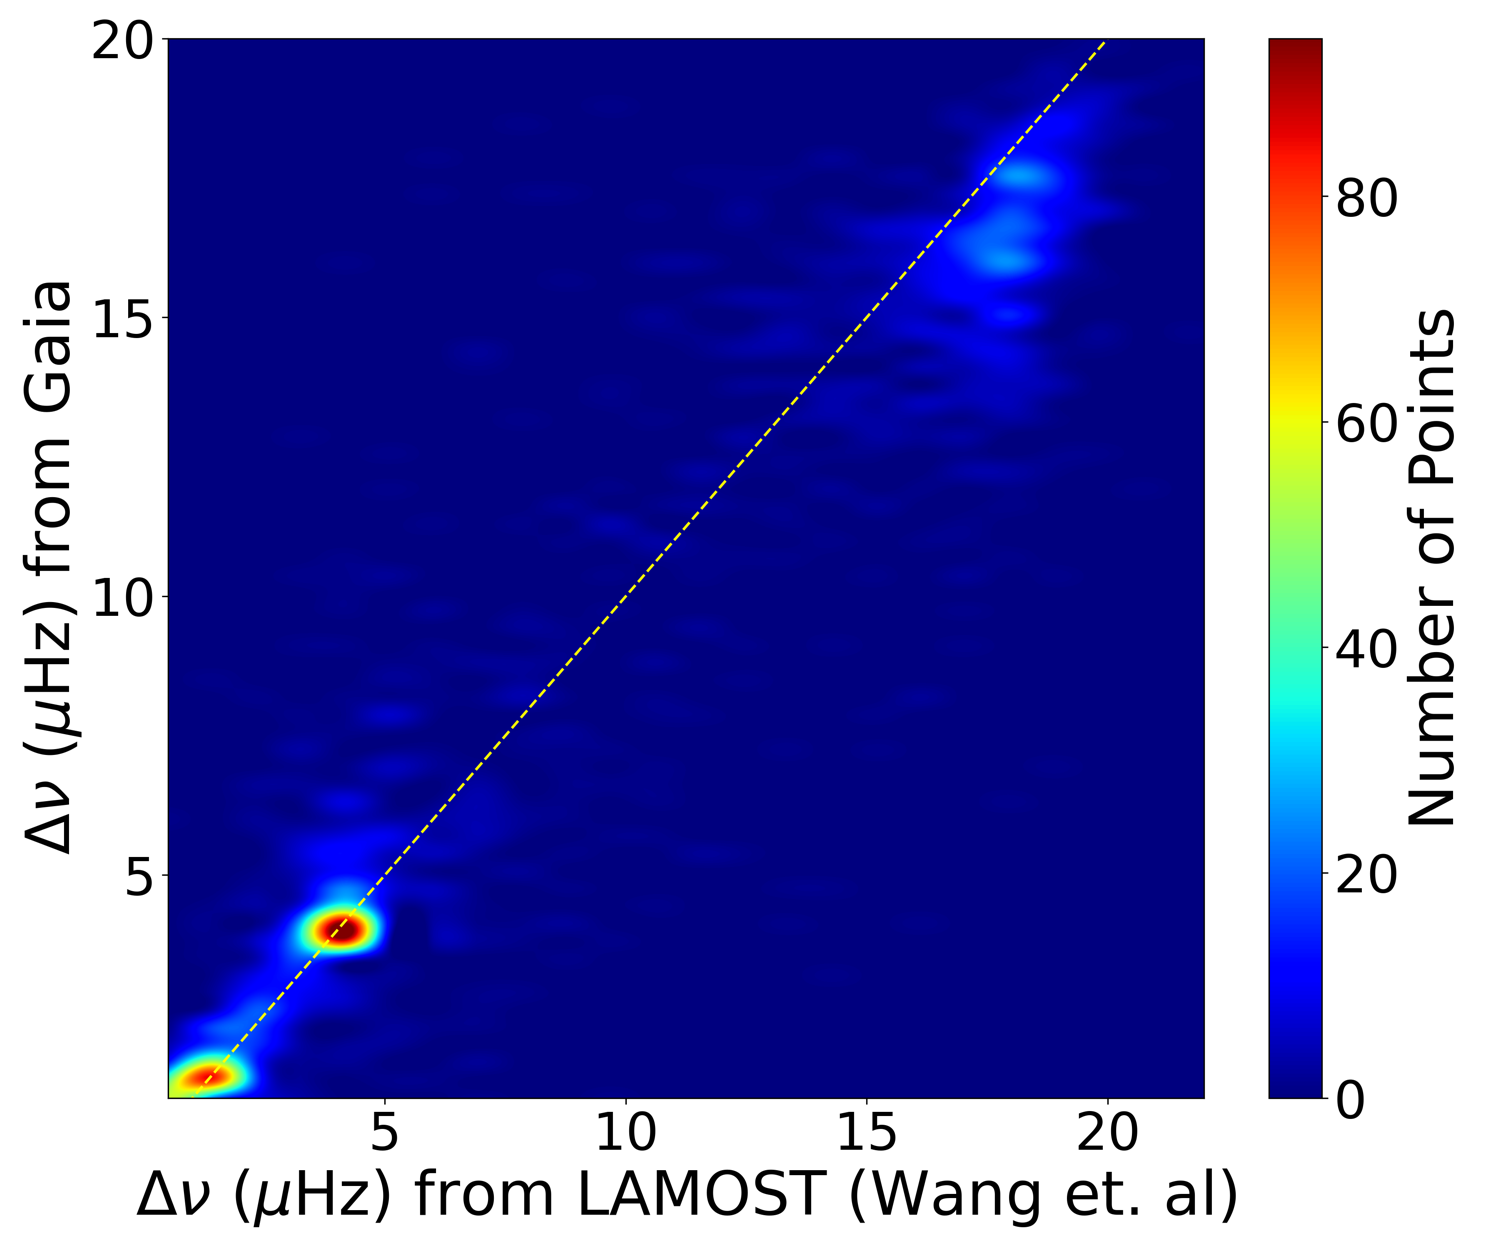
Figure 12: Comparison between Gaia XP–derived and independent Kepler-based ∼2 values.
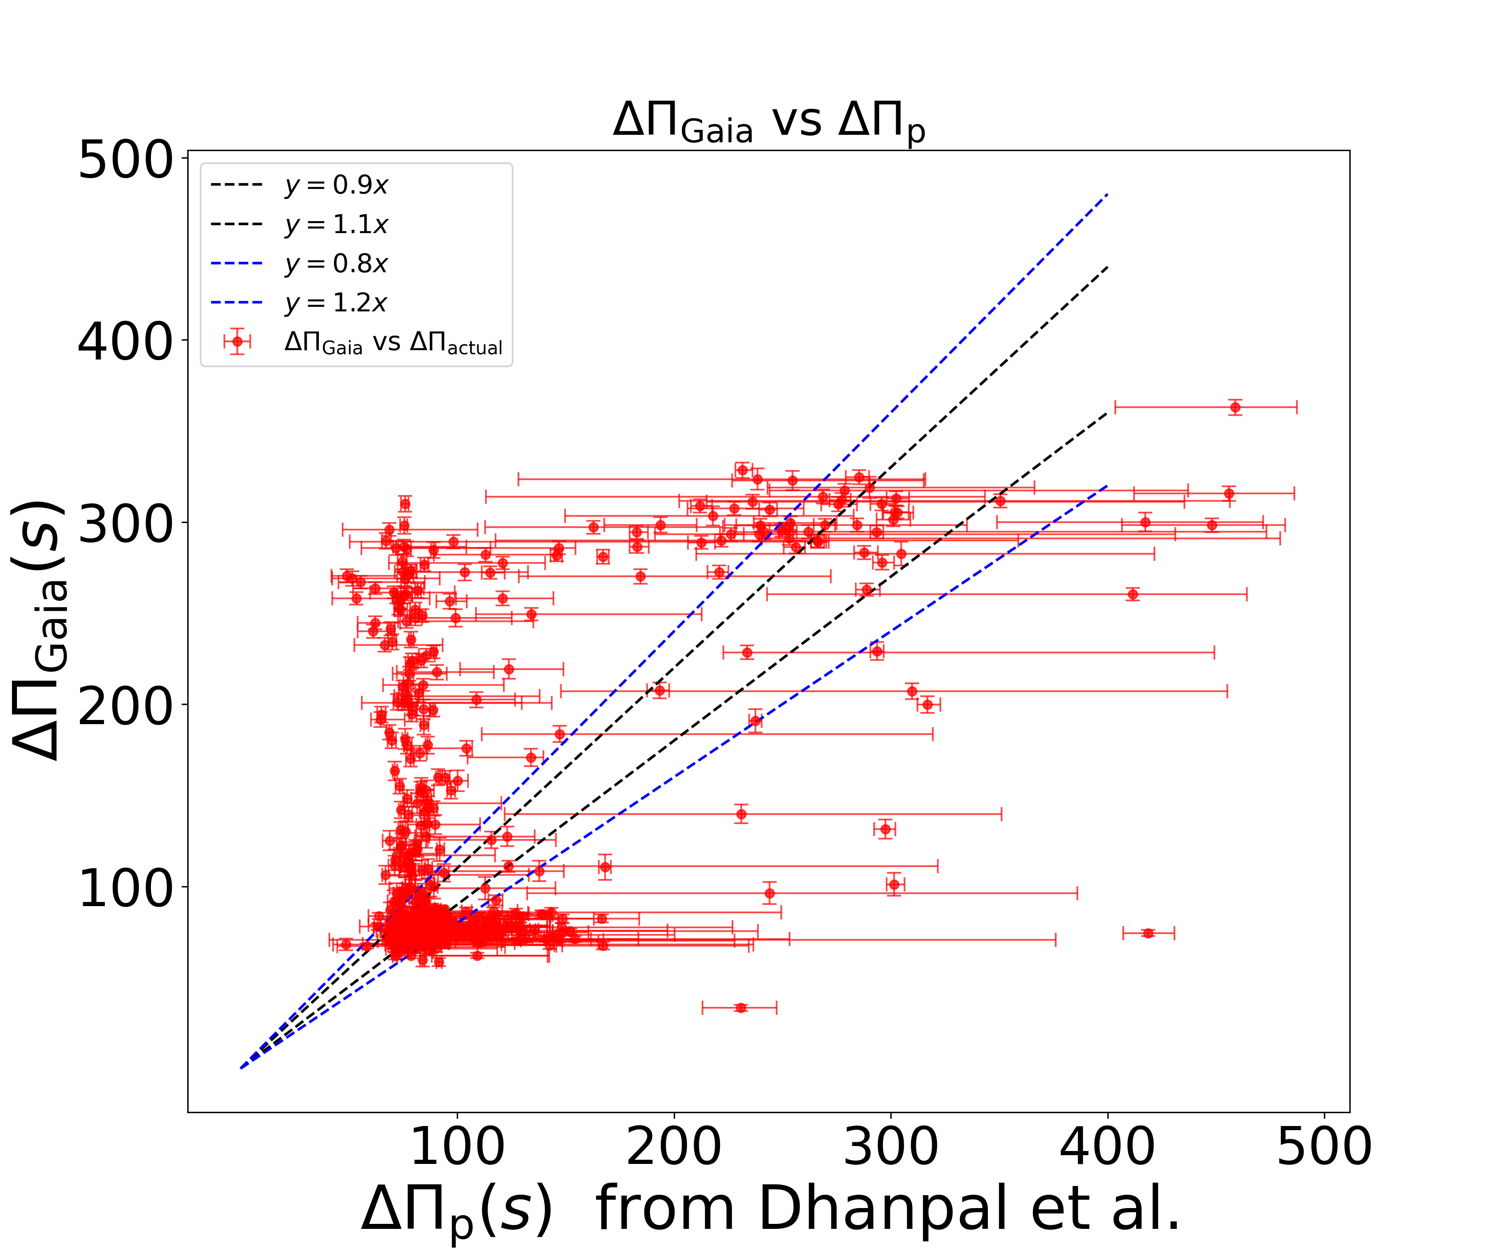
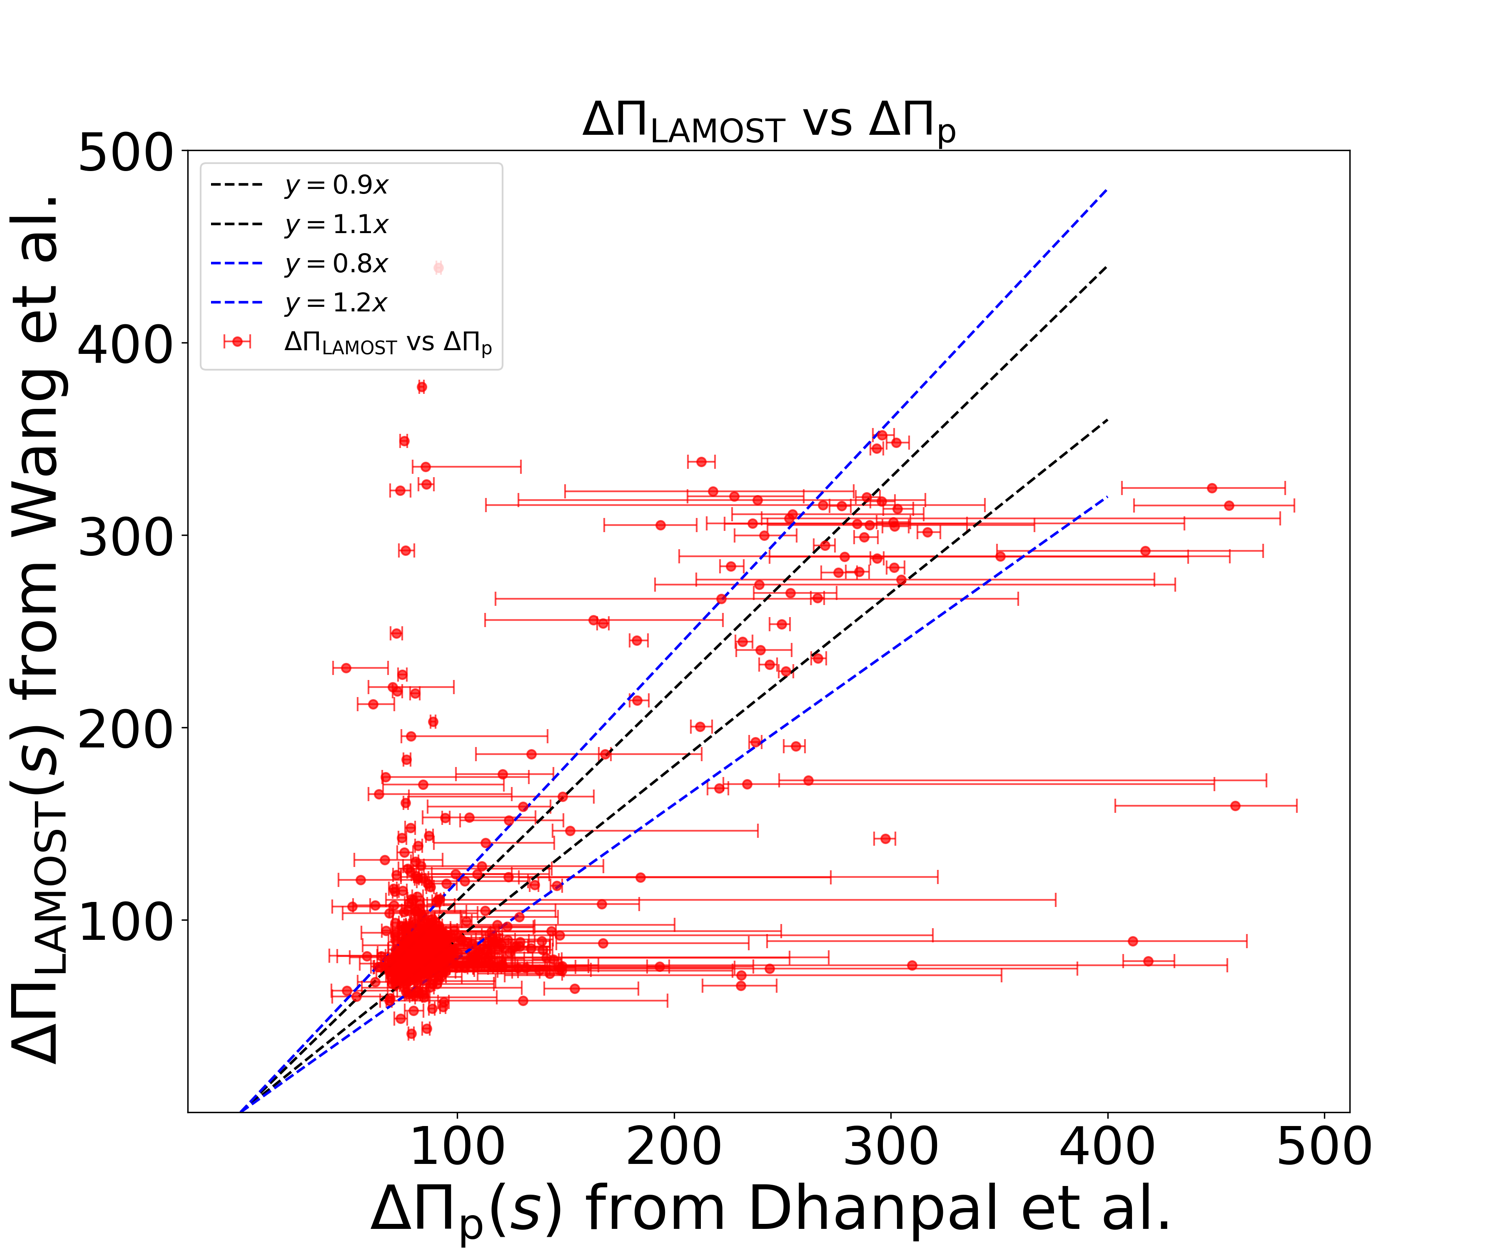
Figure 13: Comparison of ∼3 from Gaia XP spectra against Kepler/LAMOST references.
For unusual targets on the horizontal arm in the ∼4–∼5 plane, the evolutionary assignment aligns with independent spectrophotometric and photometric classification schemes (e.g. Bovy et al. 2014), and their Kepler/TESS light curve power spectra confirm the presence of oscillation power at the predicted low ∼6.
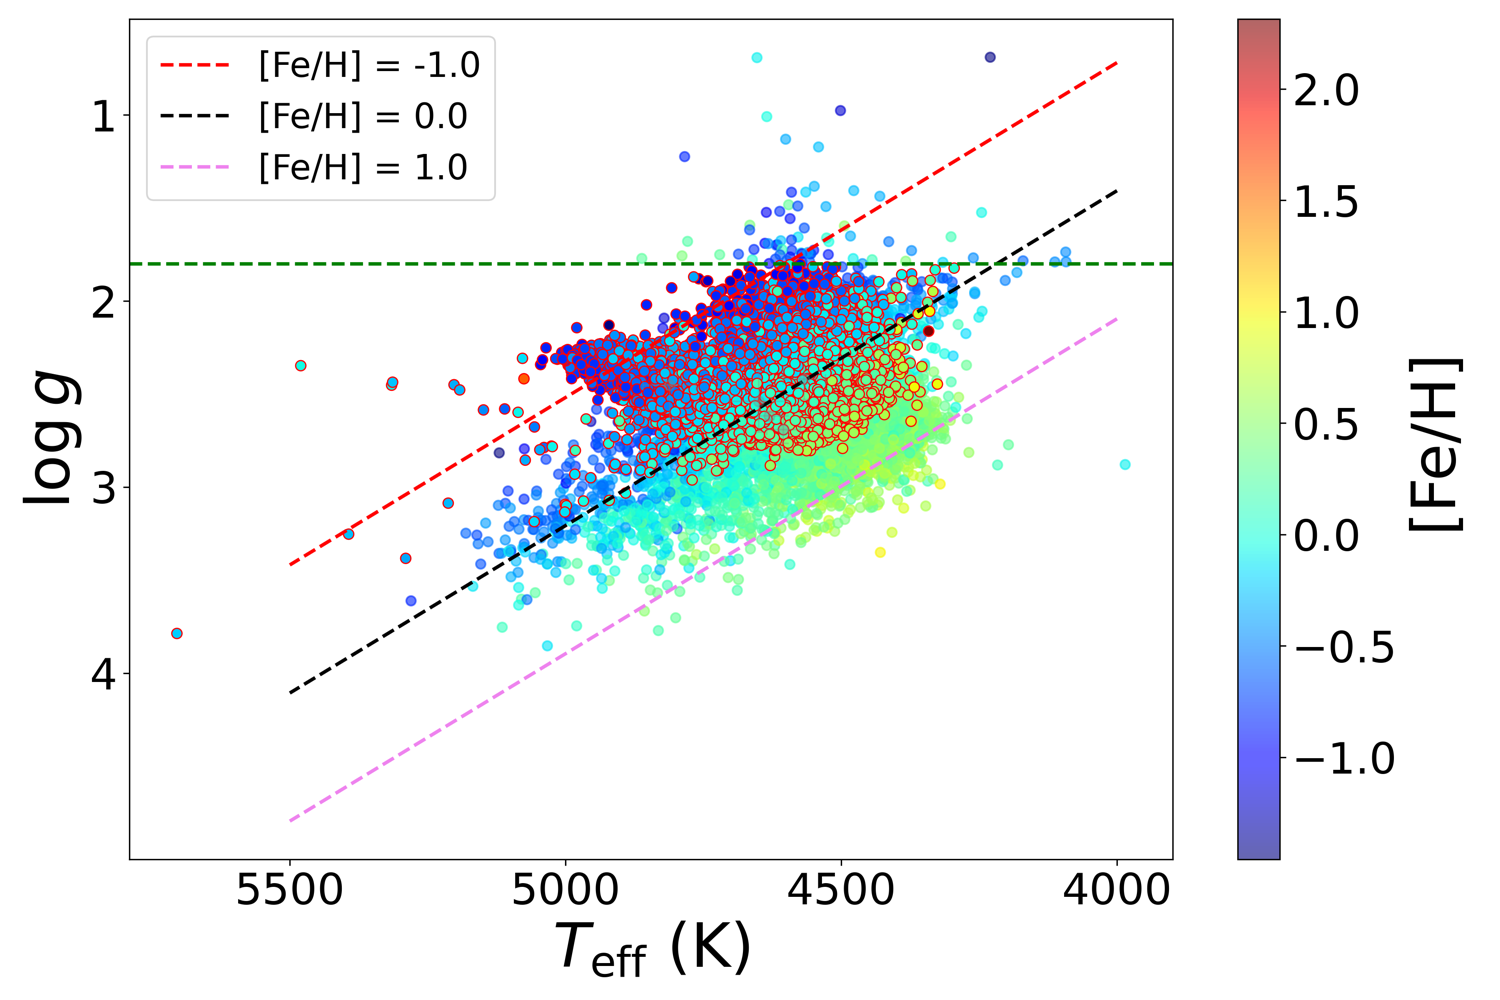
Figure 14: ∼7–∼8 distribution for red giants, with RCs selected by independent criteria confirmed in the low ∼9, high Δν0 region.
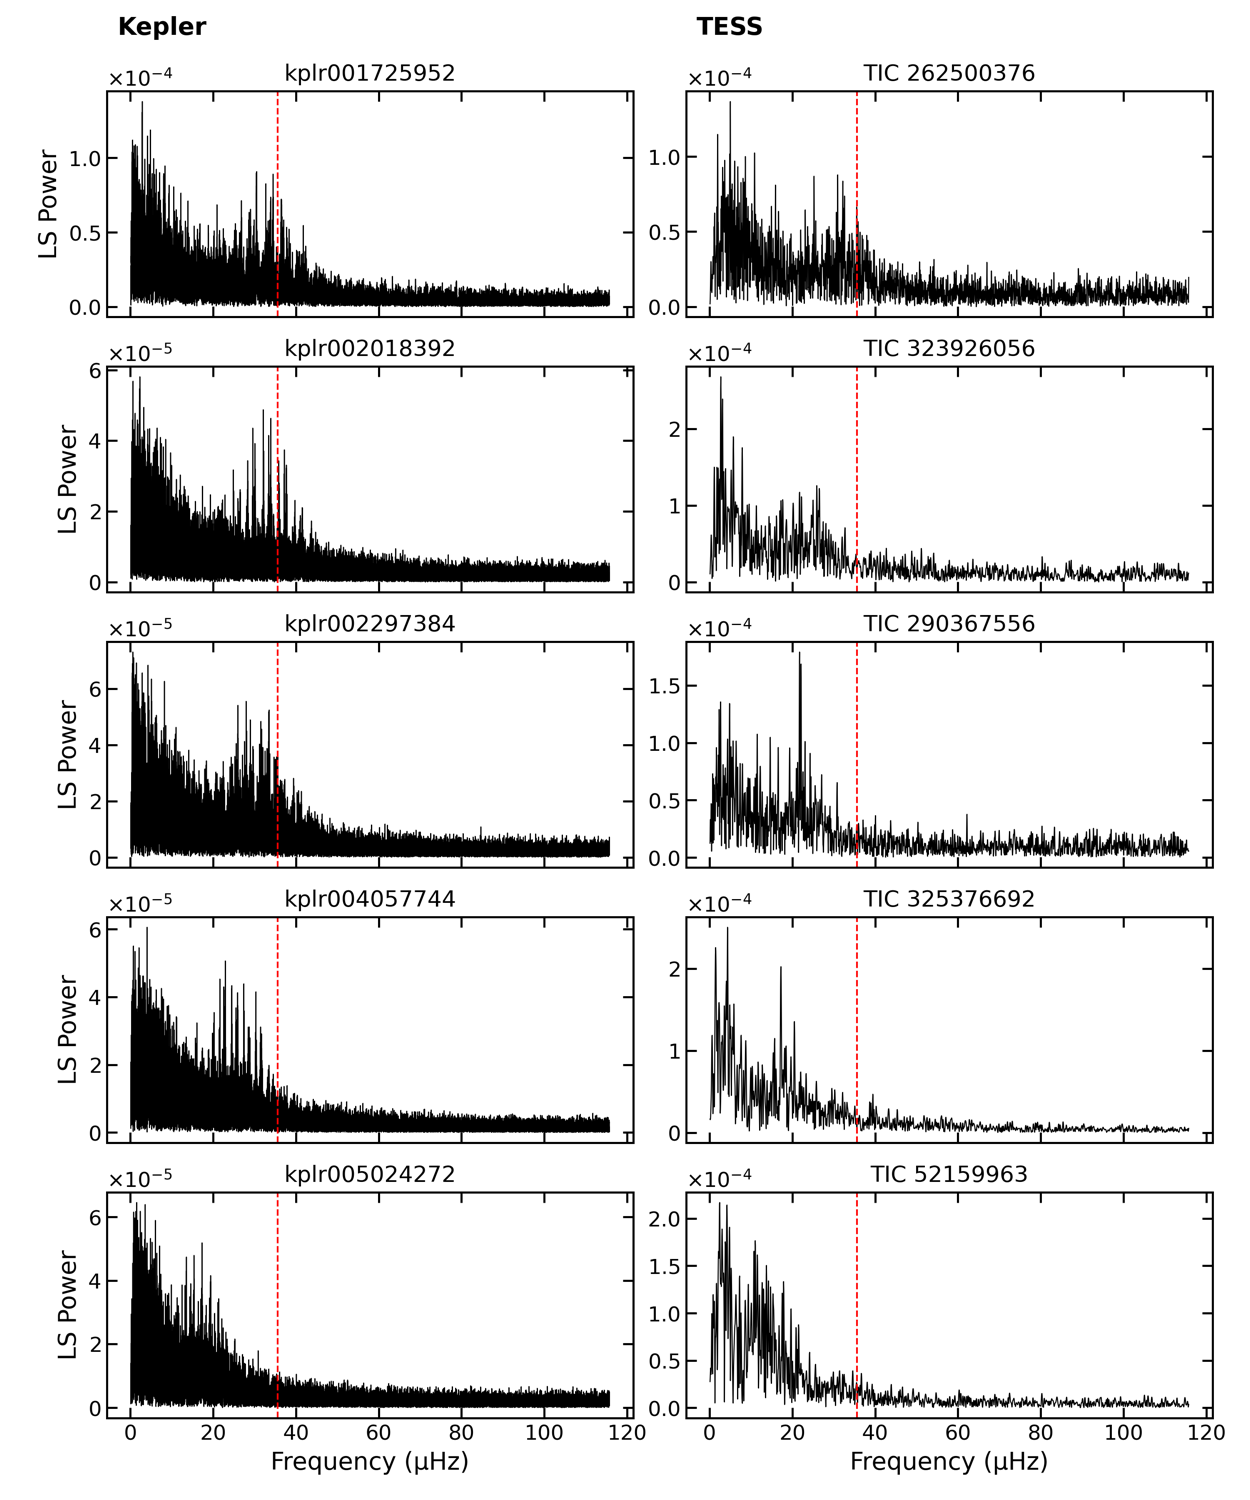
Figure 15: Representative power spectra for low Δν1, high Δν2 red giants, indicating oscillation power at expected frequencies.
Implications and Future Directions
This work establishes that even at extremely low spectral resolution, Gaia XP captures enough information for robust statistical inference of global seismic parameters for red giants, supporting population-scale galactic studies. The hybrid CNN-LSTM approach effectively learns to map broad integrated spectral features (such as molecular bands and flux-curvature modulated by Δν3, Δν4, chemical composition) to internal structure diagnostics, outperforming linear architectures and bridging the gap between photometric, asteroseismic, and spectroscopic domains.
From a practical perspective, the models enable RC selection with high purity, facilitating improved mapping of galactic structure and chemical evolution via asteroseismology. The identification of new evolutionary features at the population level within Gaia DR3—and prospectively DR4—demonstrates the value of data-driven spectral inference at scale. Model saliency analysis offers a bridge to physical interpretability in otherwise black-box frameworks, guiding future high-resolution spectroscopic follow-up and constraining stellar evolutionary models.
The theoretical implications include the confirmation of predicted but previously unvalidated evolutionary branches, as well as the demonstration that low-resolution spectra, when coupled with large samples and appropriate machine learning, can serve as proxies for time-intensive photometric missions for global structural parameters.
Conclusion
Gaia XP spectra, when processed through tailored deep-learning architectures, enable large-scale, reliable inference of key asteroseismic parameters in red giants. Despite spectral limitations, CNN-LSTM models recover Δν5, Δν6, and Δν7 at accuracy levels comparable to moderate-resolution surveys, achieving \textbf{inference for more than two million stars}, and revealing new evolutionary population features. Saliency analysis highlights the importance of red wavelengths inaccessible to classical line diagnostics but leveraged by deep models as reservoirs of physical information. These developments lay the groundwork for transformative population-scale asteroseismic studies and push forward the integration of data-driven approaches in galactic archaeology and stellar physics.
Reference: "Potential of Gaia XP Spectra in Red Giant Star Asteroseismology: A Deep-Learning Approach" (2604.17045)