- The paper demonstrates that jittered stripplots achieve superior range identification while boxplots and histograms exhibit systematic errors in interpreting key statistics.
- The paper uses a large-scale mixed-methods approach, integrating 215 participant benchmarks, click-to-select protocols, and expert interviews to compare visualization techniques.
- The paper recommends task- and audience-aware visualization design and hybrid chart forms to mitigate misinterpretation and better align with analytic tasks.
Introduction
This paper conducts a comprehensive comparison of four canonical visualization techniques for univariate distributions: boxplots, violinplots, histograms, and jittered stripplots. Through a large-scale mixed-methods study (n=215) integrating both quantitative benchmarking and qualitative analyses, as well as domain expert interviews, the paper examines how these visualizations support perceptual and analytic tasks, how common misinterpretations arise, and how user preference aligns—or fails to align—with objective task performance. The findings directly interrogate conventions in statistical communication and raise questions about best practices for matching visualization techniques to audience and task characteristics.
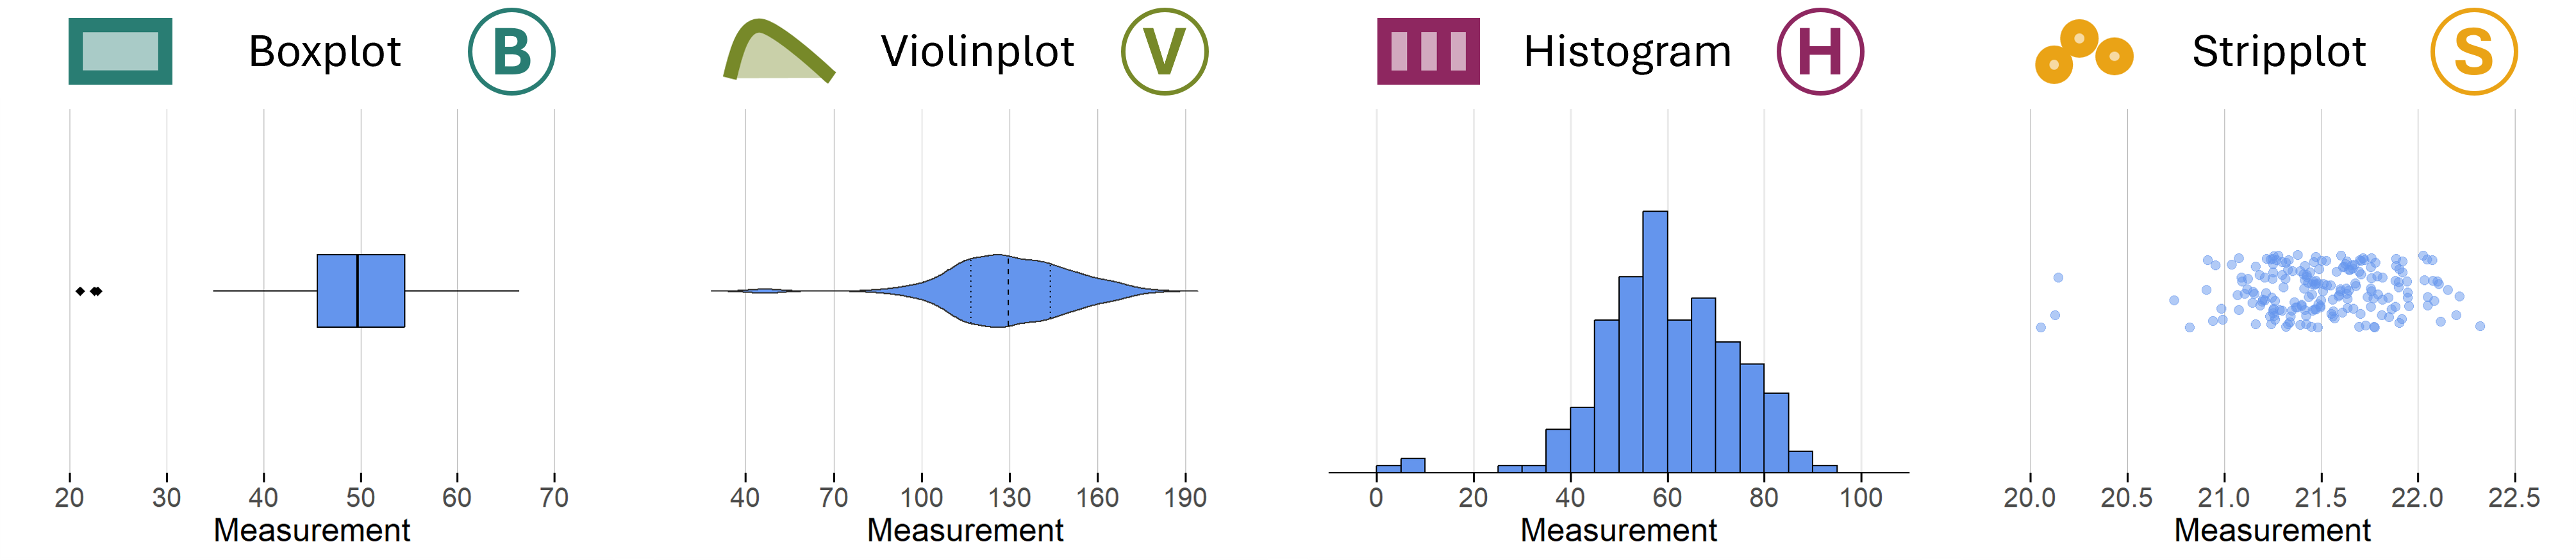
Figure 1: The four charts used in this study (dataset 1): boxplot, violinplot, histogram, and stripplot, representing summary statistics, smooth densities, binned densities, and individual data points, respectively.
Experimental Design and Methodology
The study sample included both lay and expert participants, the latter stratified by education and professional background to control for the well-established impact of domain expertise on visualization interpretation. Each participant completed both free exploration and targeted benchmark tasks (e.g., identification of means, medians, range, and clusters), using a suite of synthetically generated datasets systematically varying in skewness, modality, and outlier presence.

Figure 2: The datasets used in the study vary in skew, outlier values, and modality, enabling robust evaluation across distributional regimes.
A key feature of the study is the click-to-select interaction protocol, which permitted both rigorous performance metrics and visualization of selection patterns, offering nuanced insight into misinterpretations and user reasoning.
Qualitative Patterns in Chart Interpretation
Analysis of participant click data revealed systematic, chart-specific selection strategies and errors. Notably, points of interest in boxplots concentrated sharply on the median and at quartile lines, while violinplots elicited interaction both along central summary statistics and at peaks/valleys of smoothed density. Histogram interactions clustered around bar maxima, with frequent confusion of bar height with data value, while jittered stripplots led to more dispersed selection, often congregating around dense point clouds.
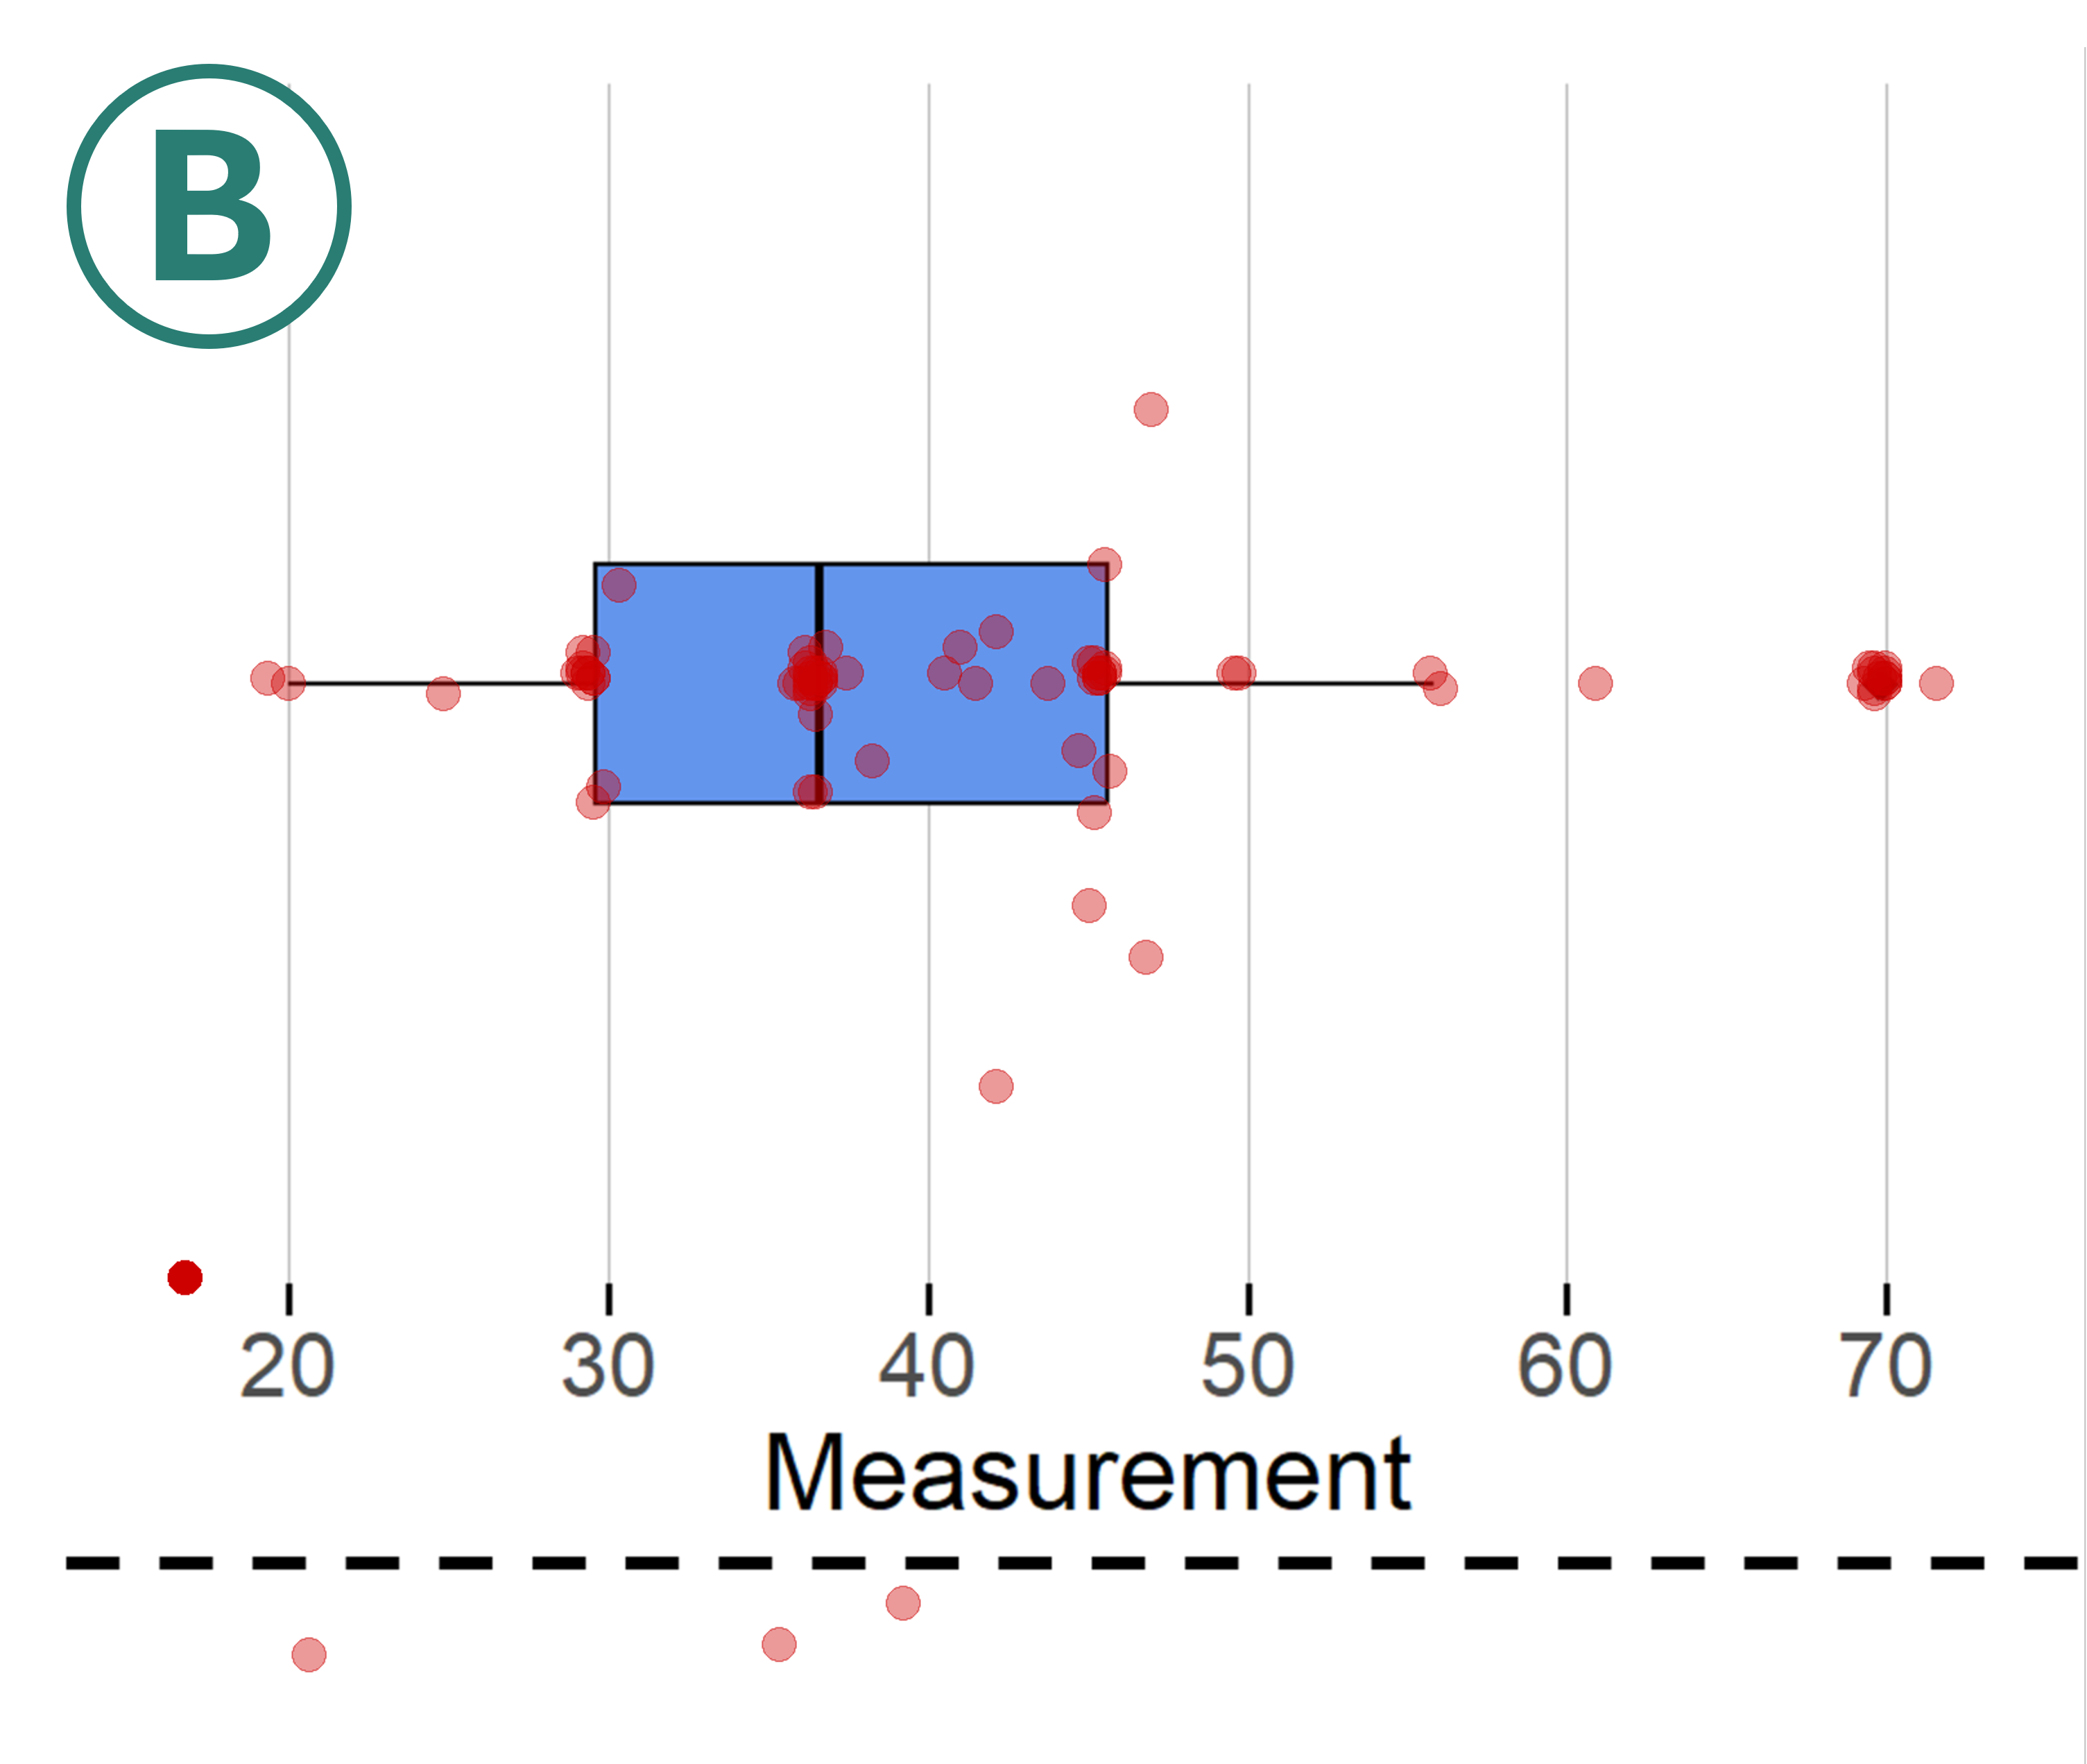
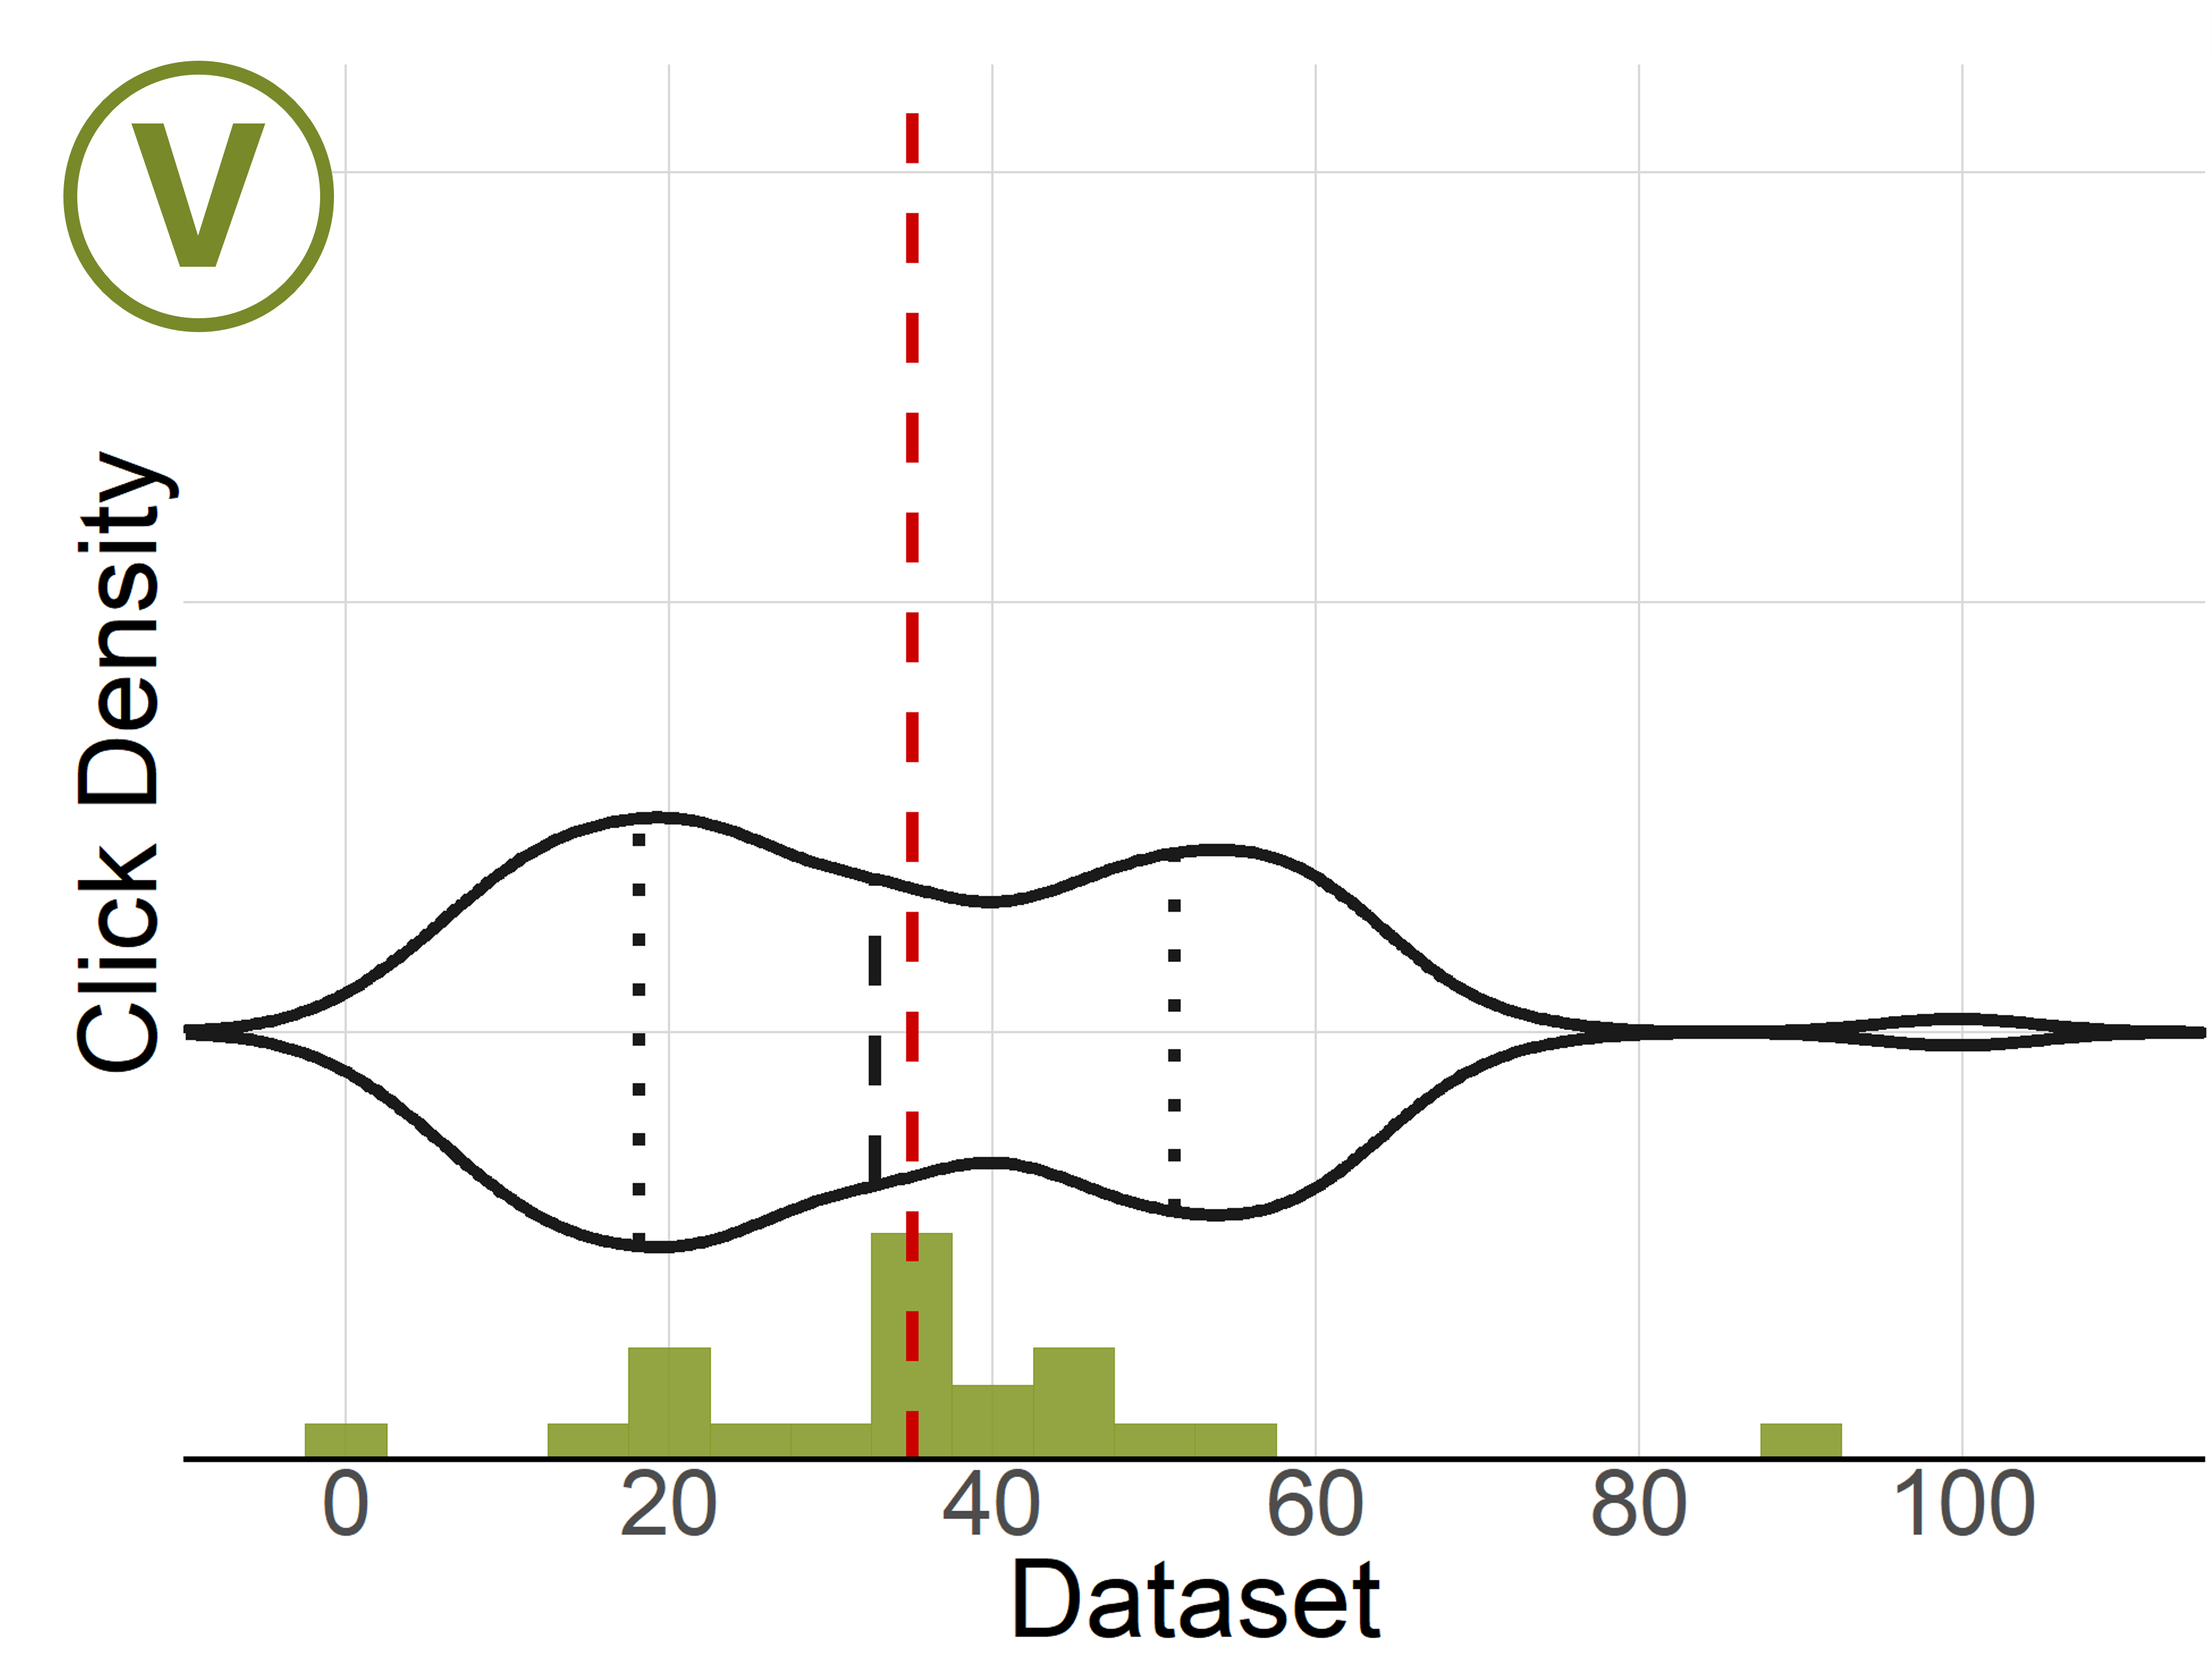
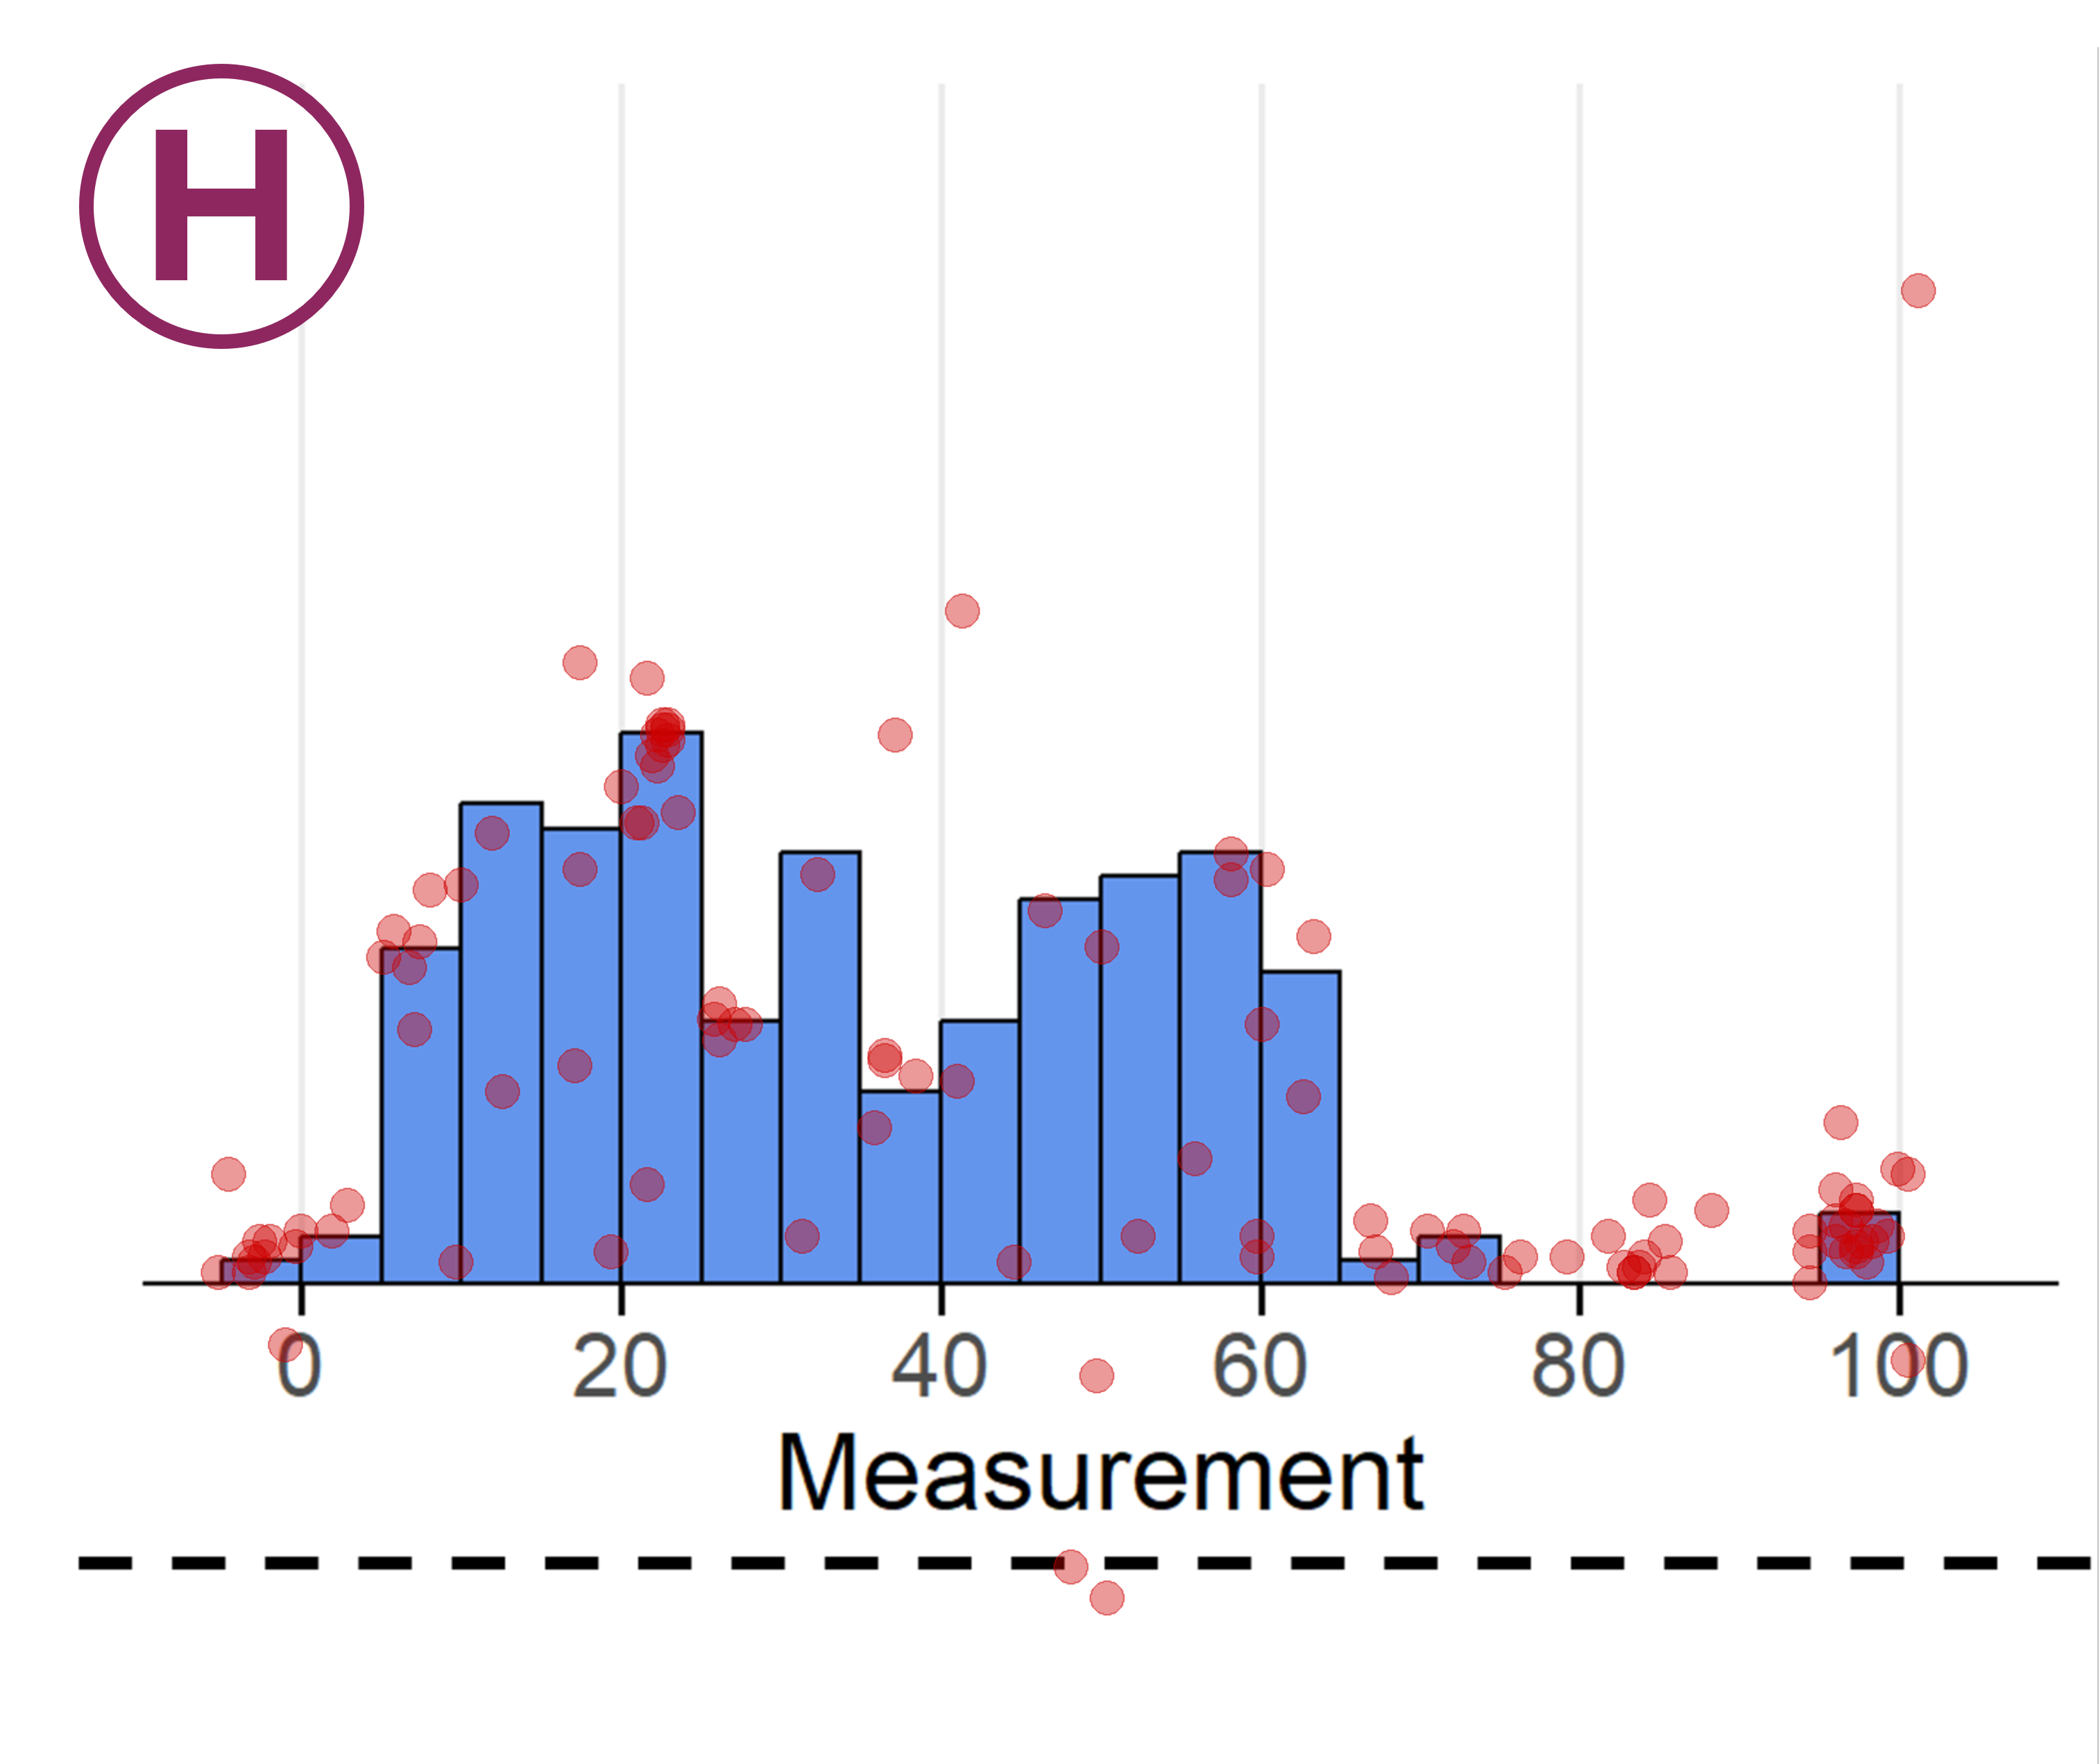
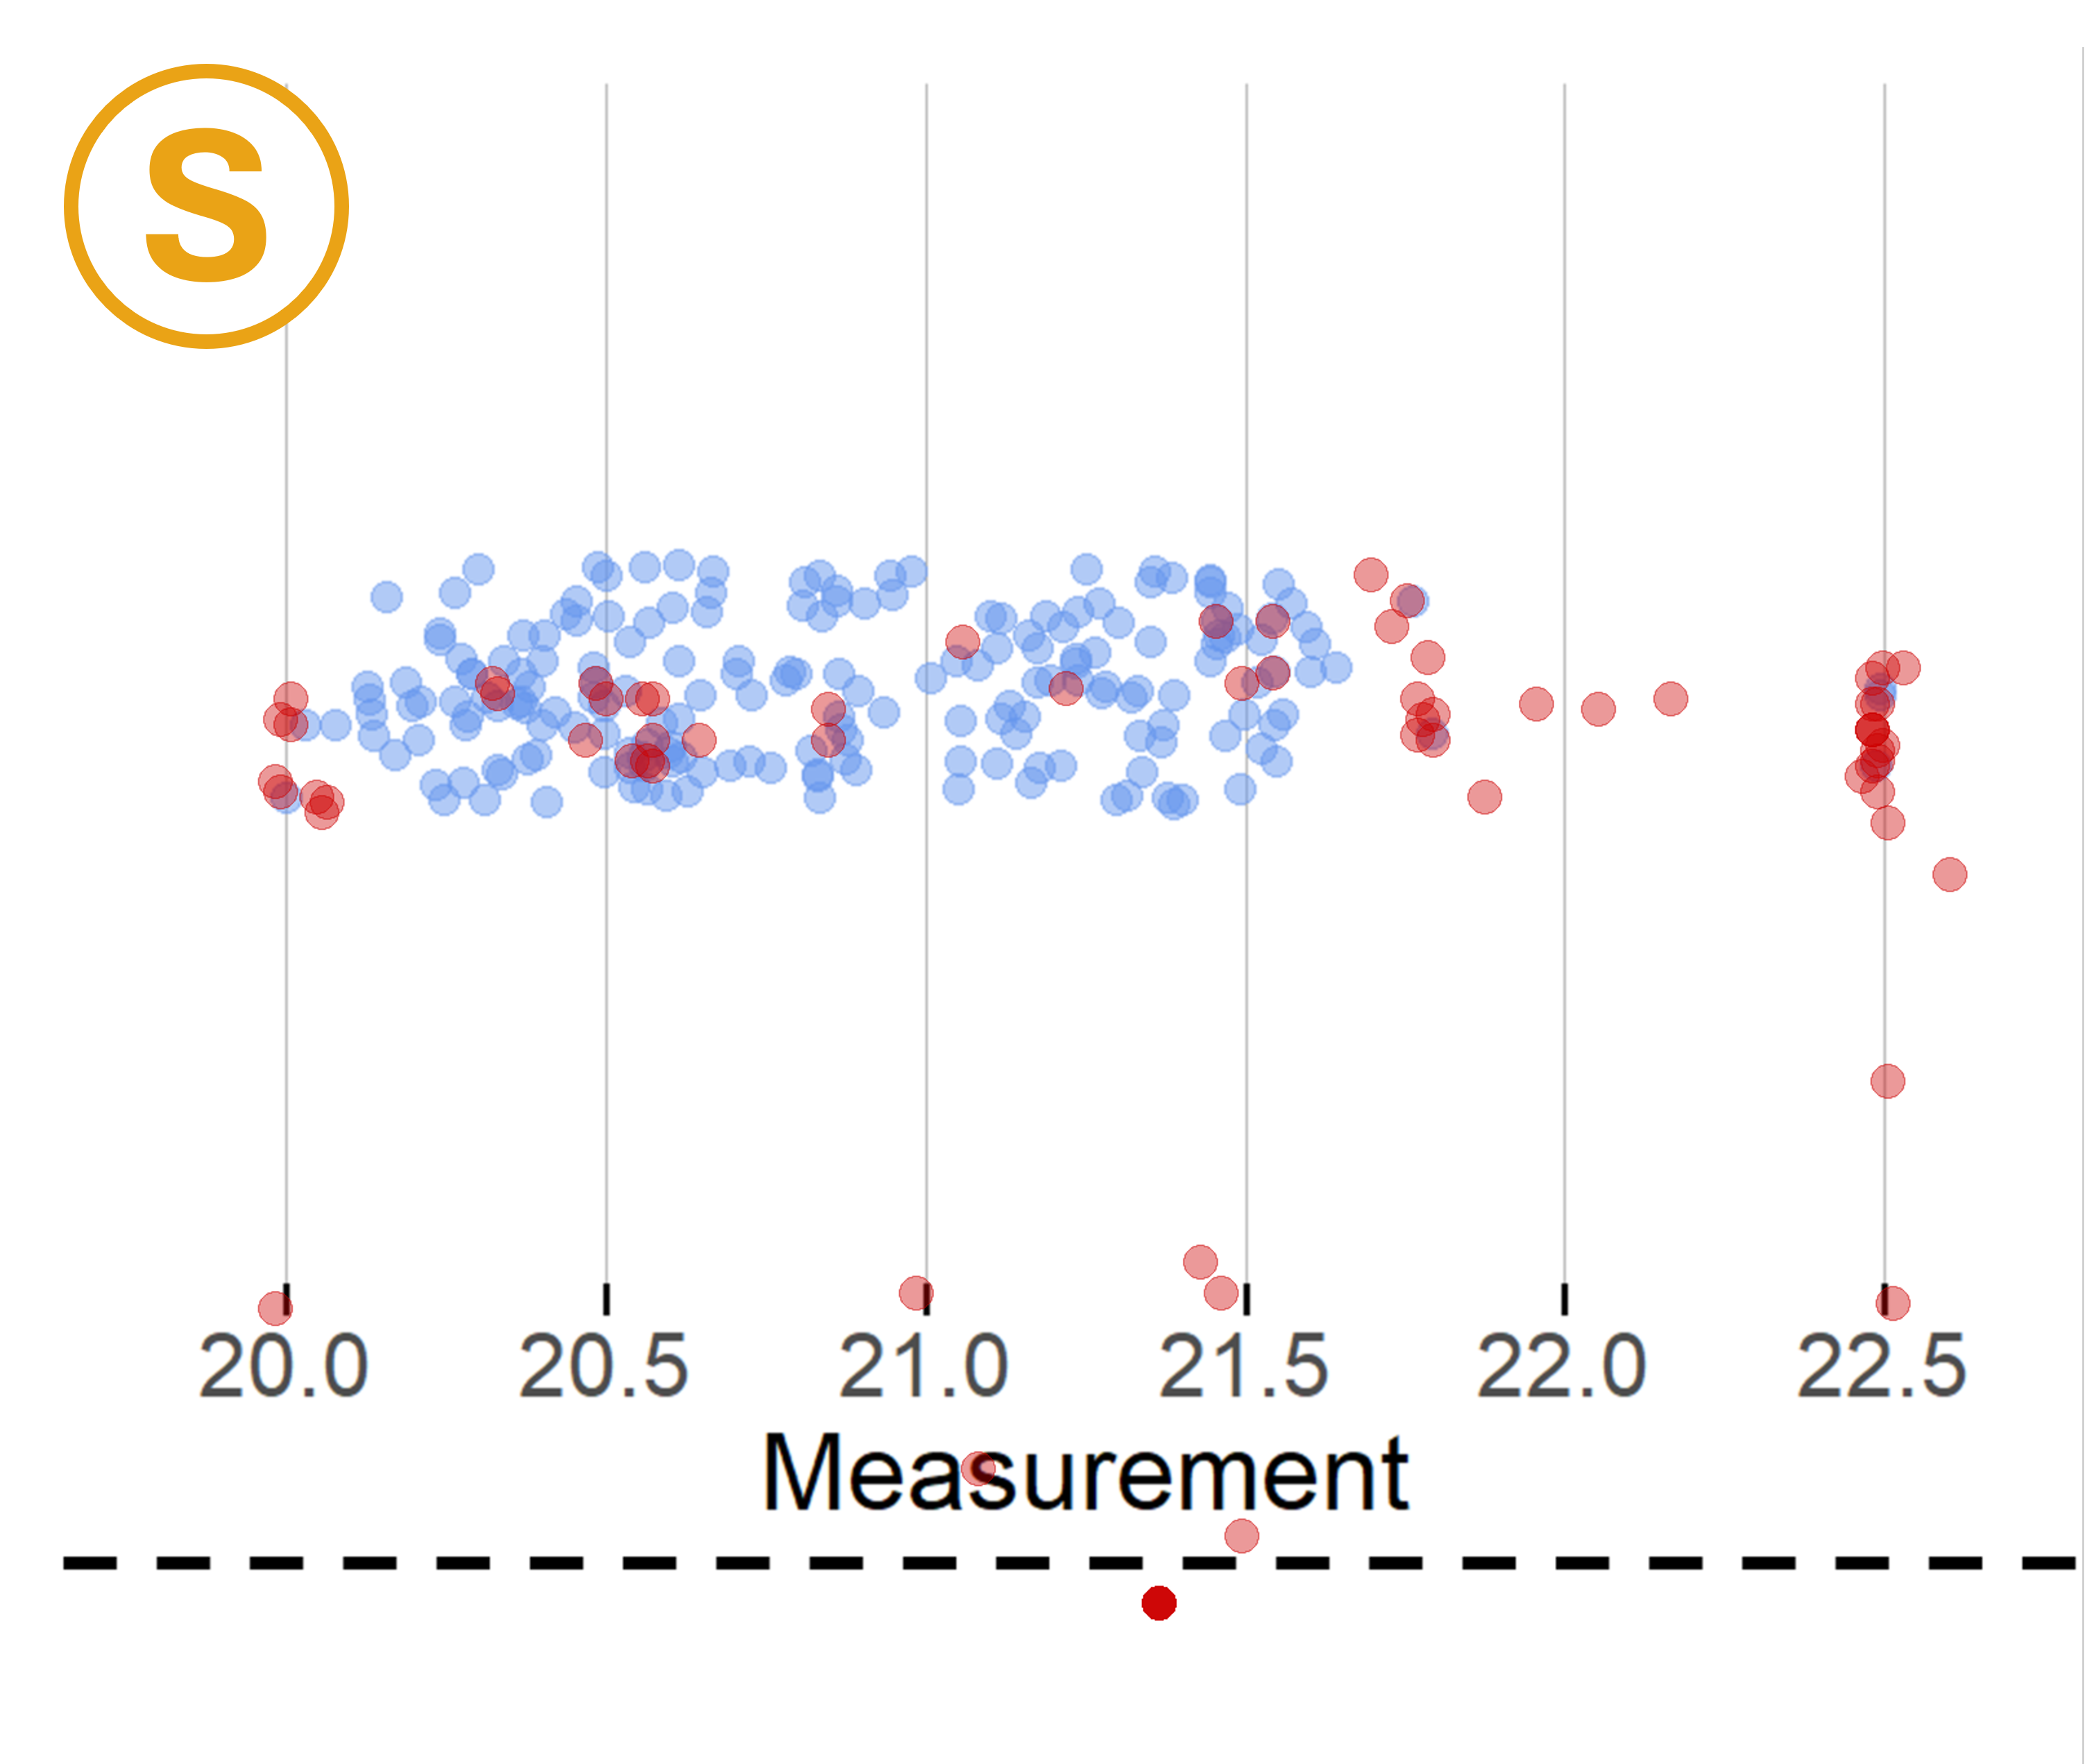
Figure 3: Examples of participants' selections on dataset 6 for the stripplot, with participant click patterns highlighting the selection of dense regions and, less frequently, outliers.
The written free-text responses surfaced several recurring themes: boxplots and violinplots were valued for explicit summary statistic display but were also described as abstract or insufficiently detailed. In contrast, stripplots were commended for transparency in representing individual observations but criticized for visual clutter, especially with large n. Histograms, despite frequent misreading of the vertical axis, were consistently described as intuitive and familiar.
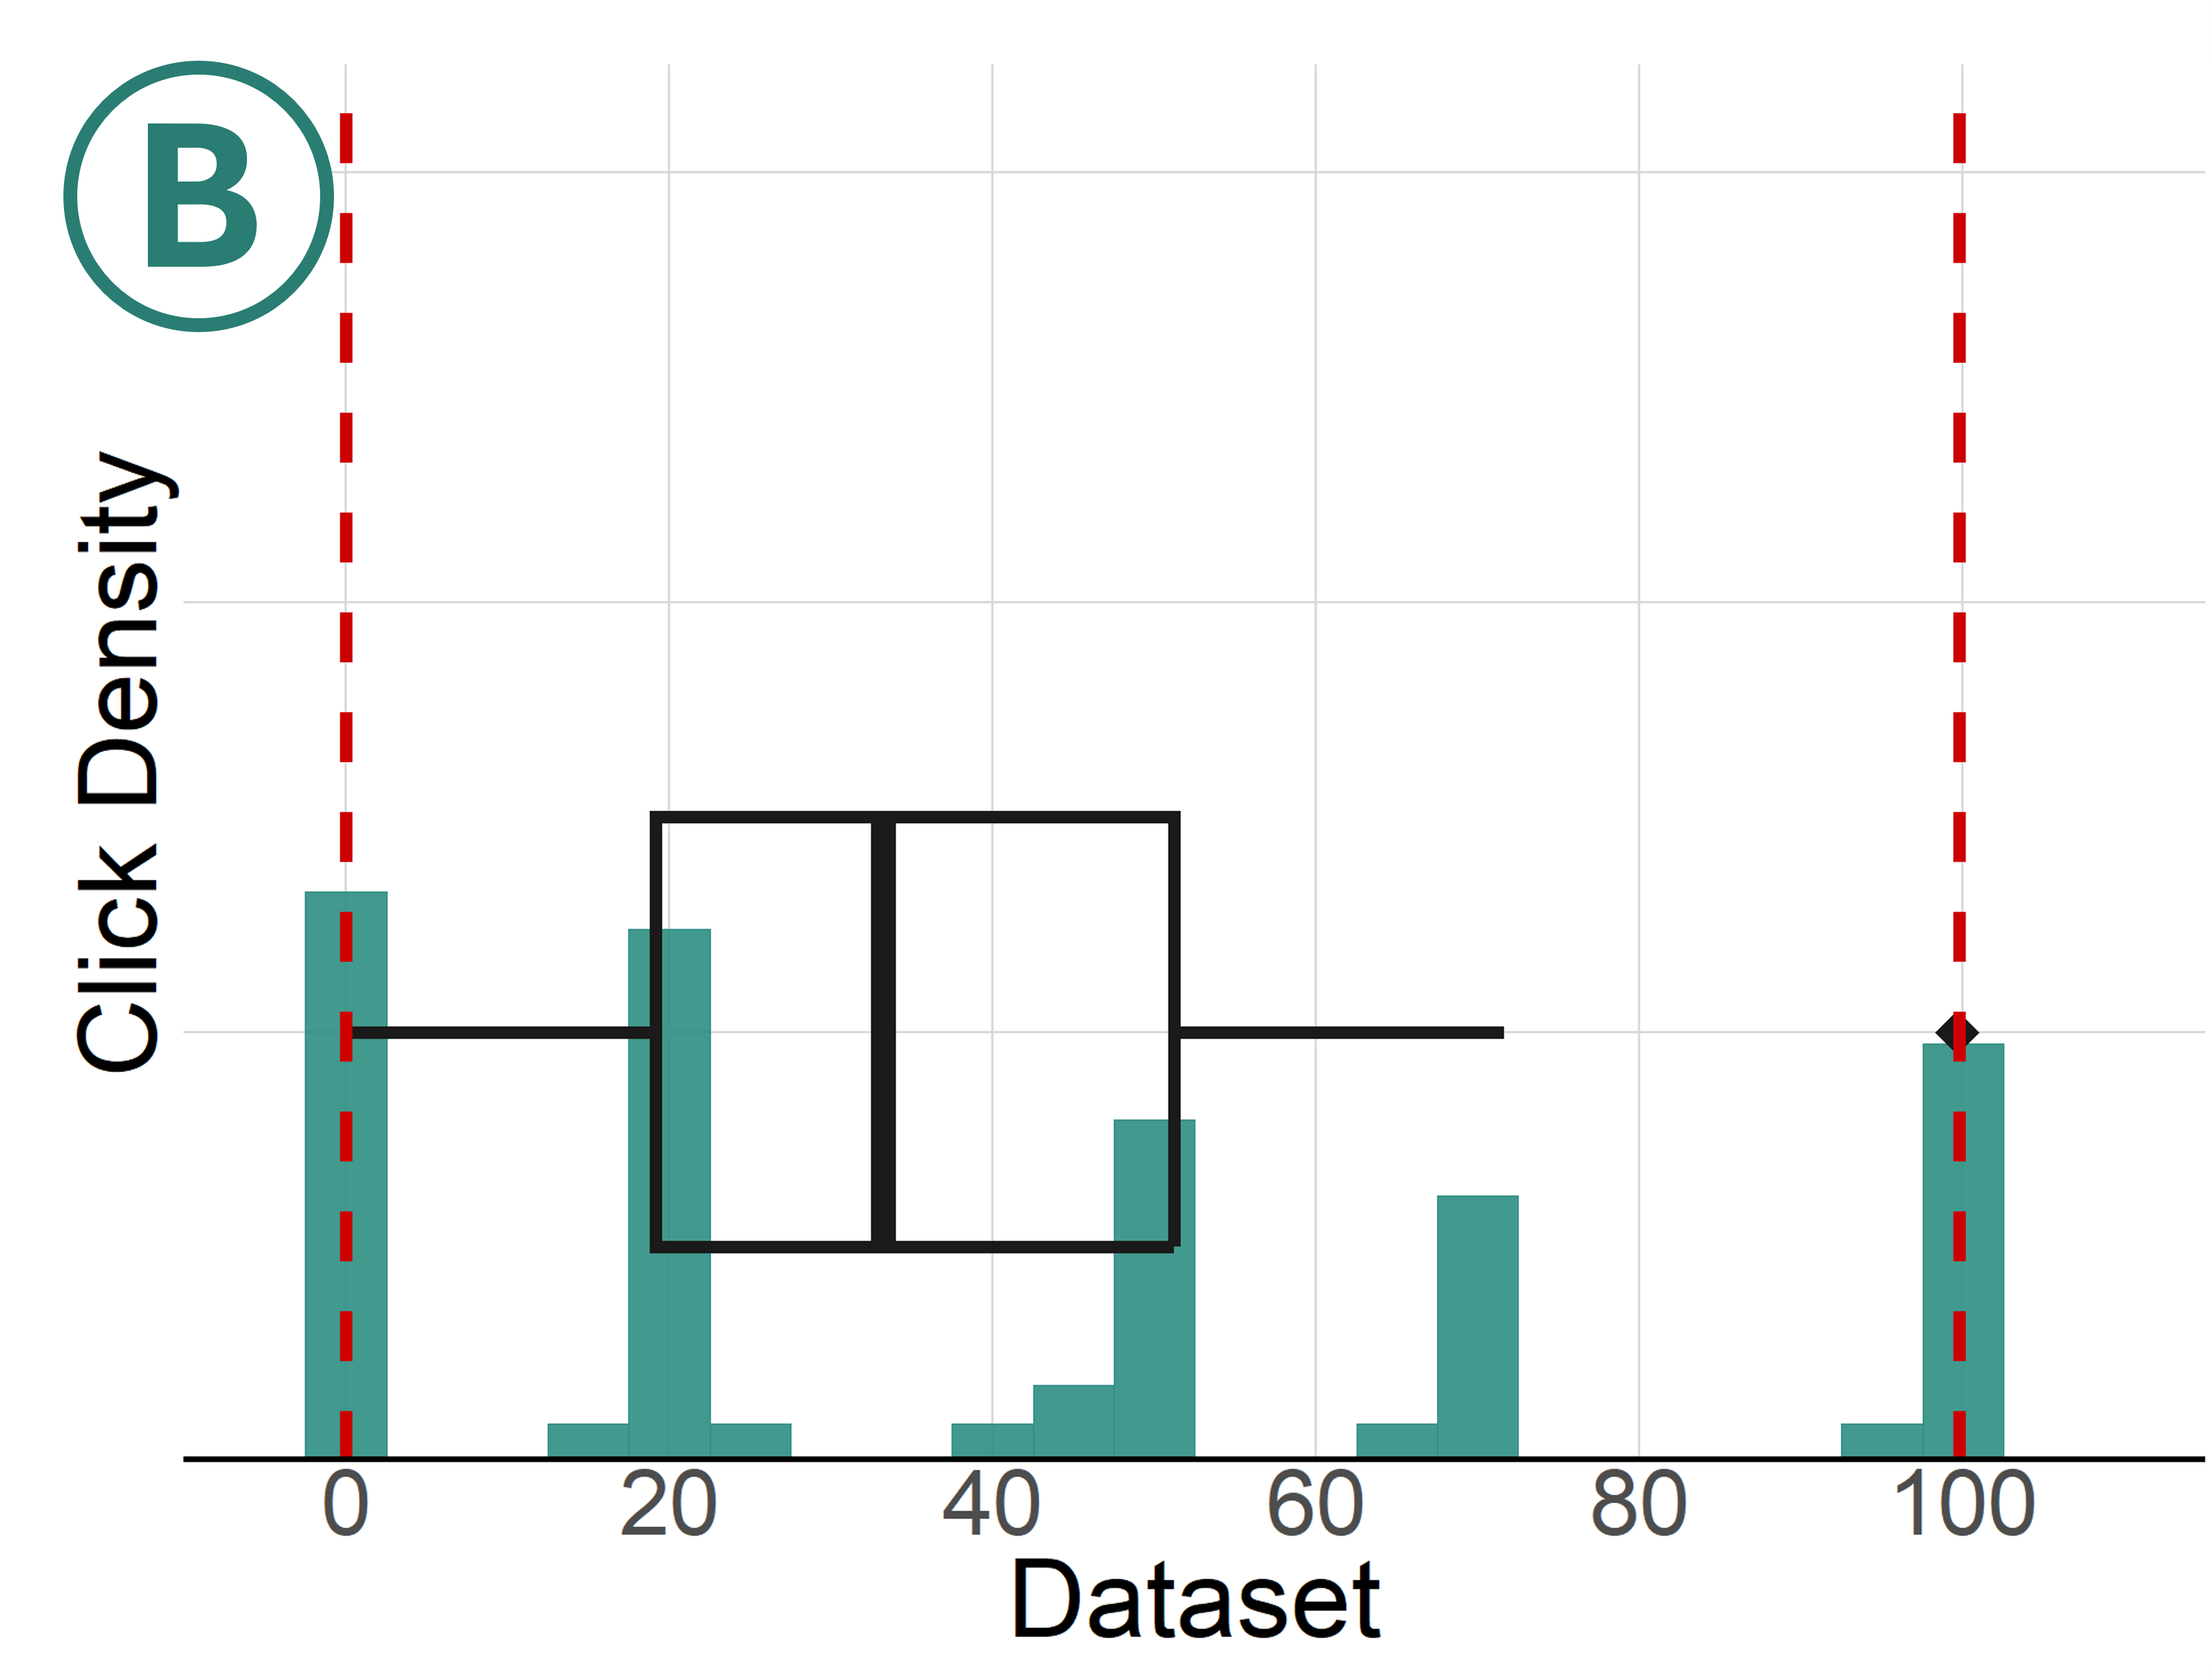
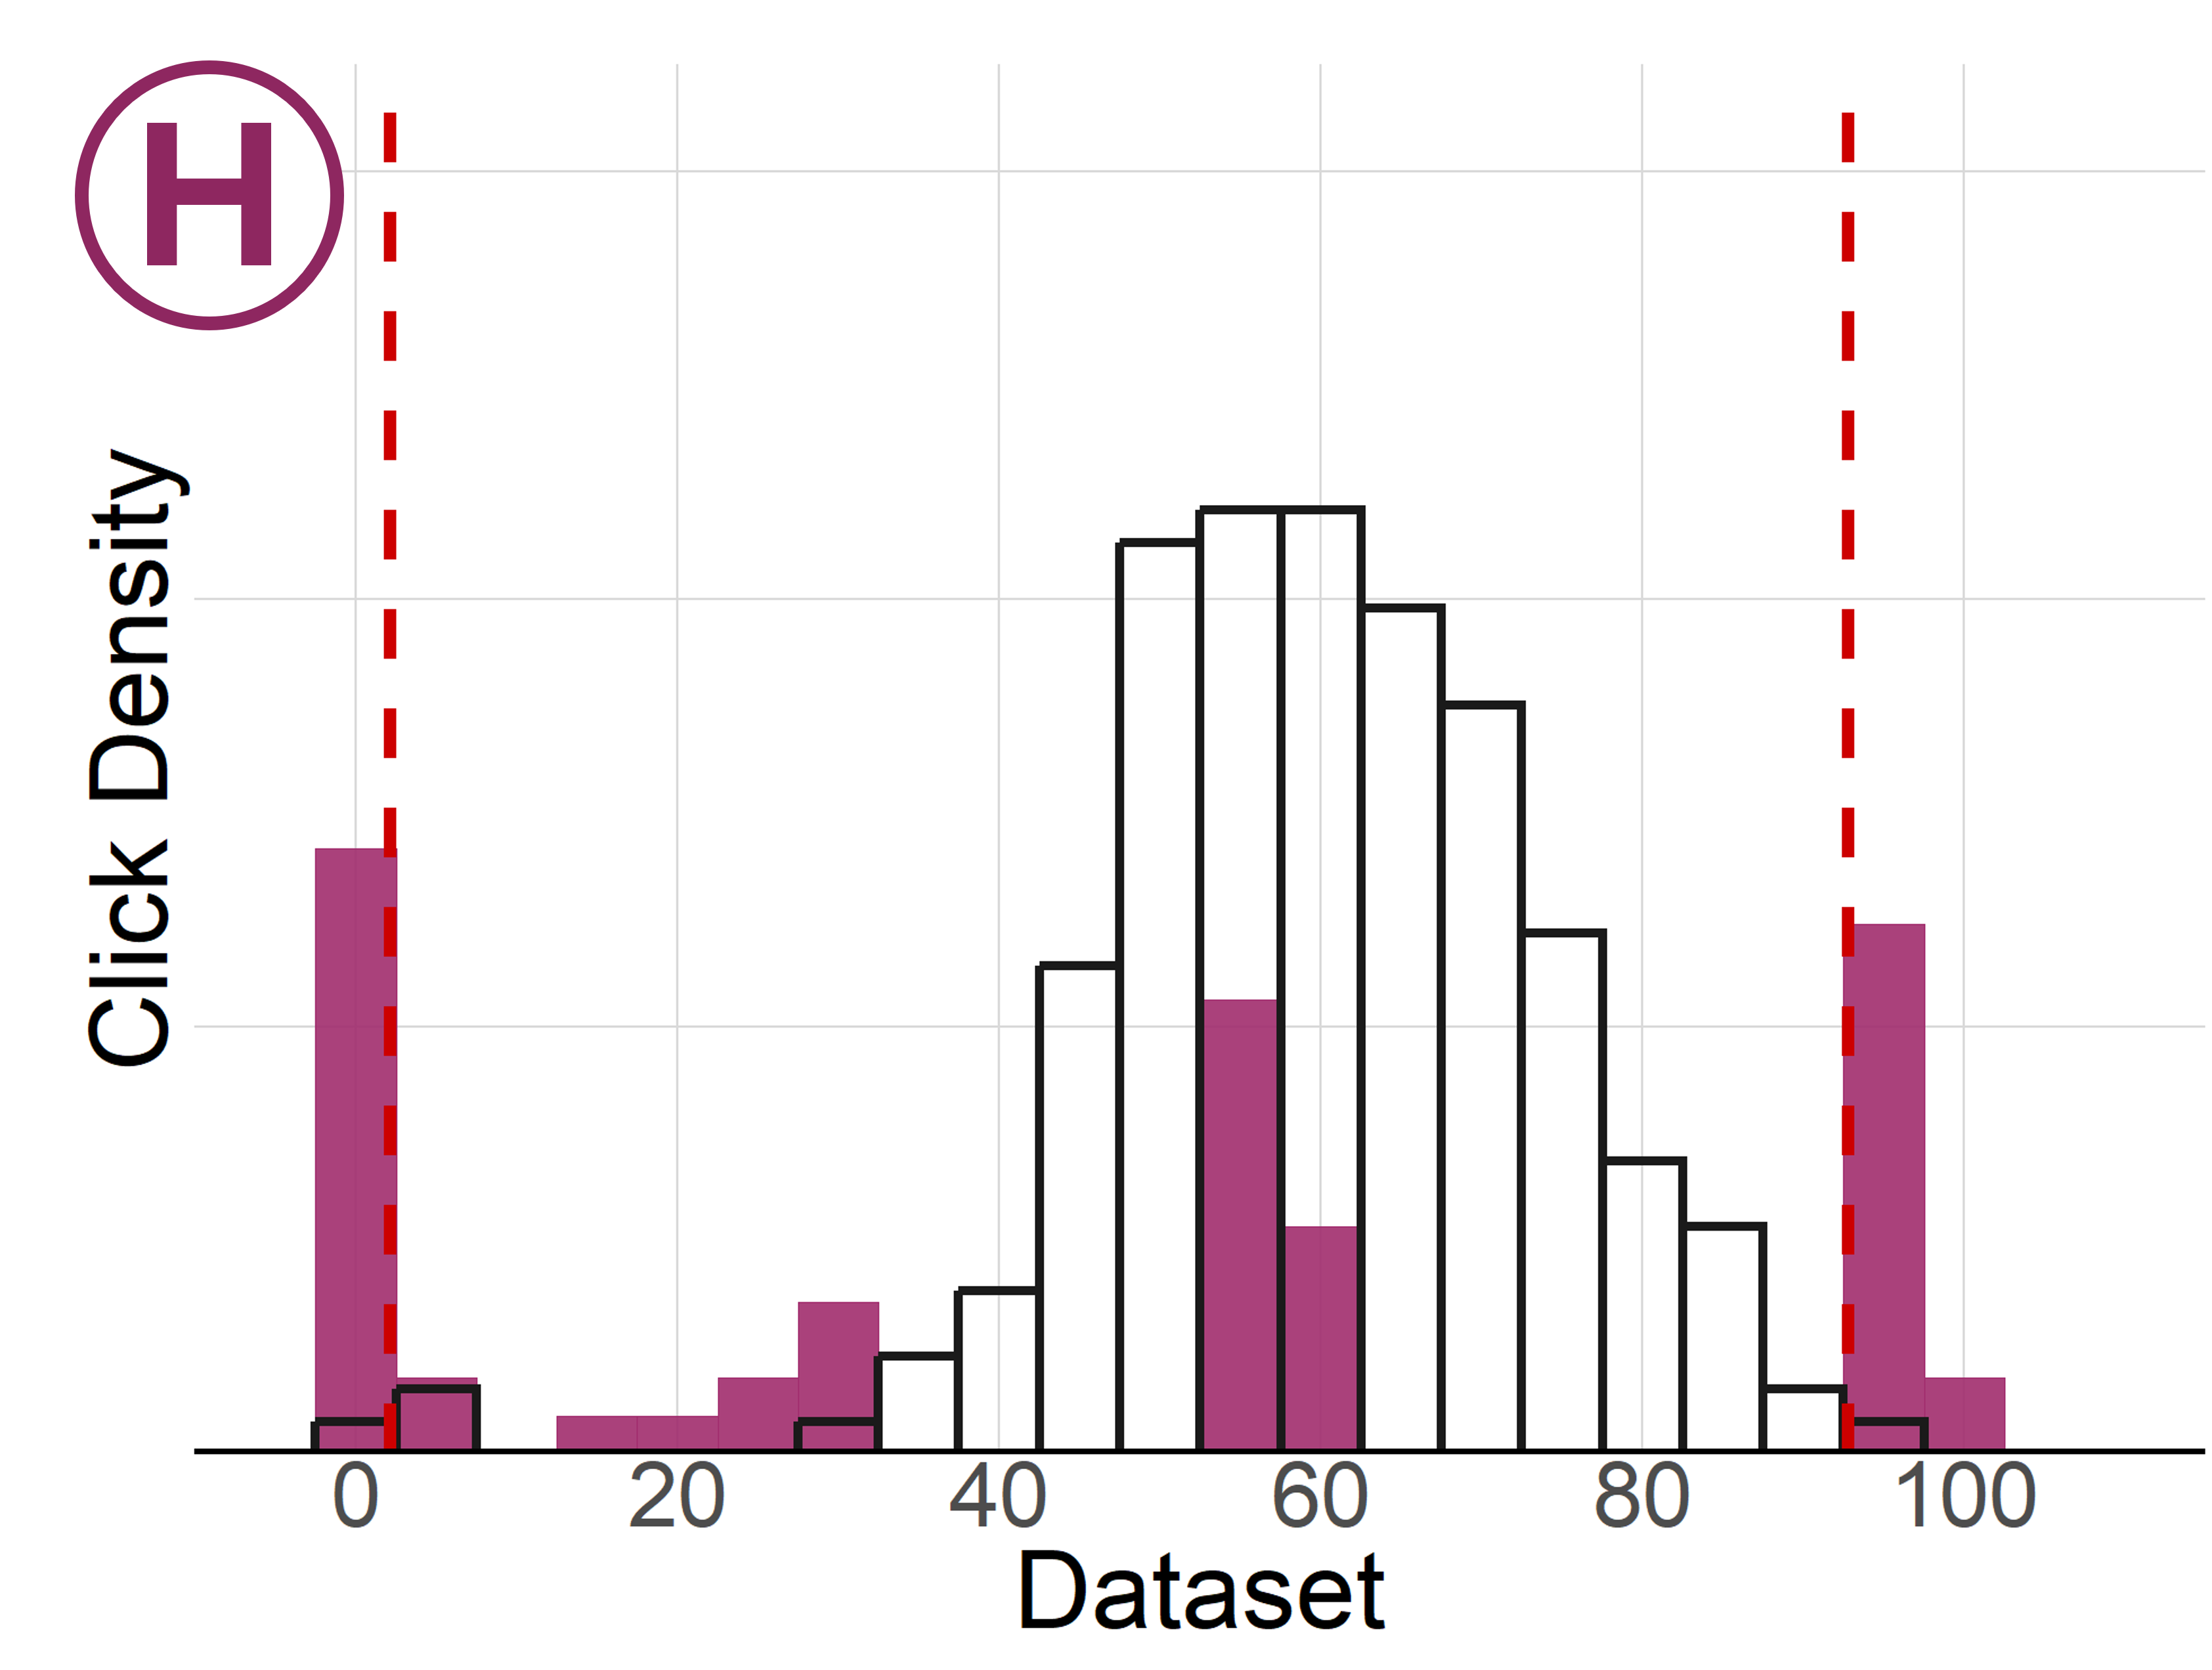
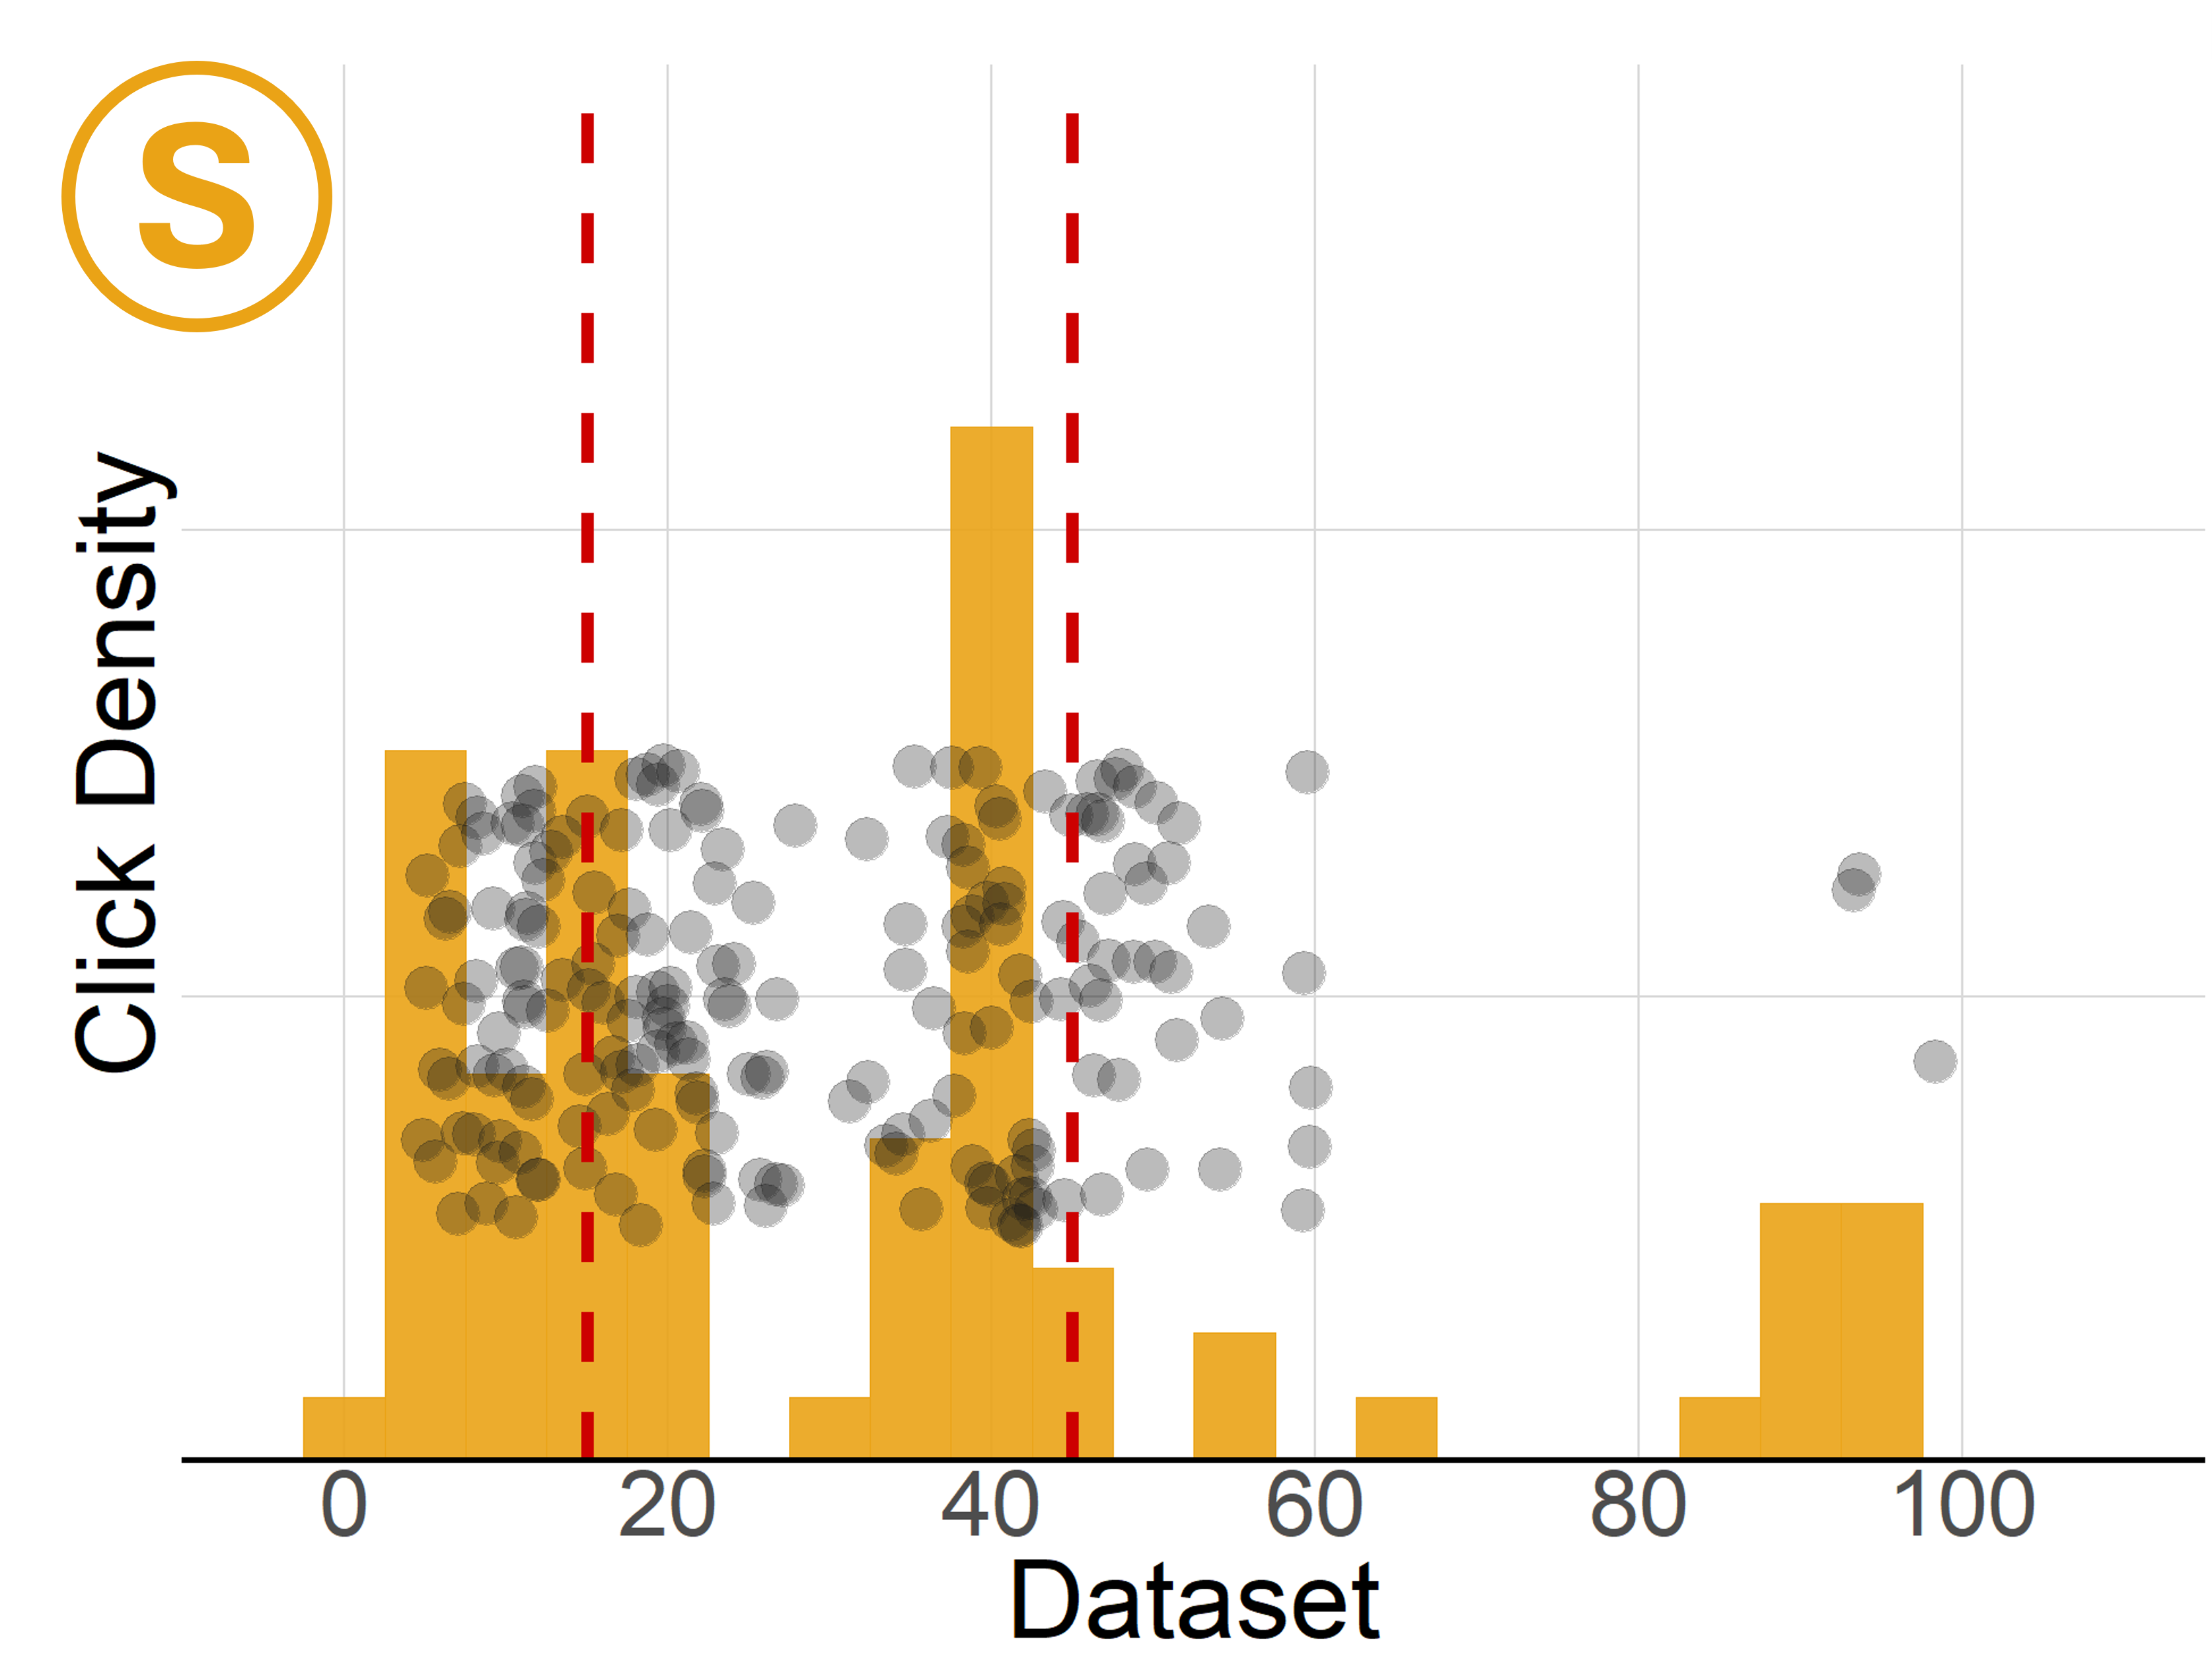
Figure 4: Participants' selection behaviors and error typologies, including misattribution of the range and misidentification of clusters or outliers.
Range Identification
Jittered stripplots demonstrated superior accuracy in range identification tasks, outperforming all other chart types. Boxplots and histograms, in contrast, frequently elicited systematic errors—participants consistently ignored outliers or misattributed range to box or bar boundaries rather than dataset extrema, as confirmed by a wider interquartile spread in error distribution.
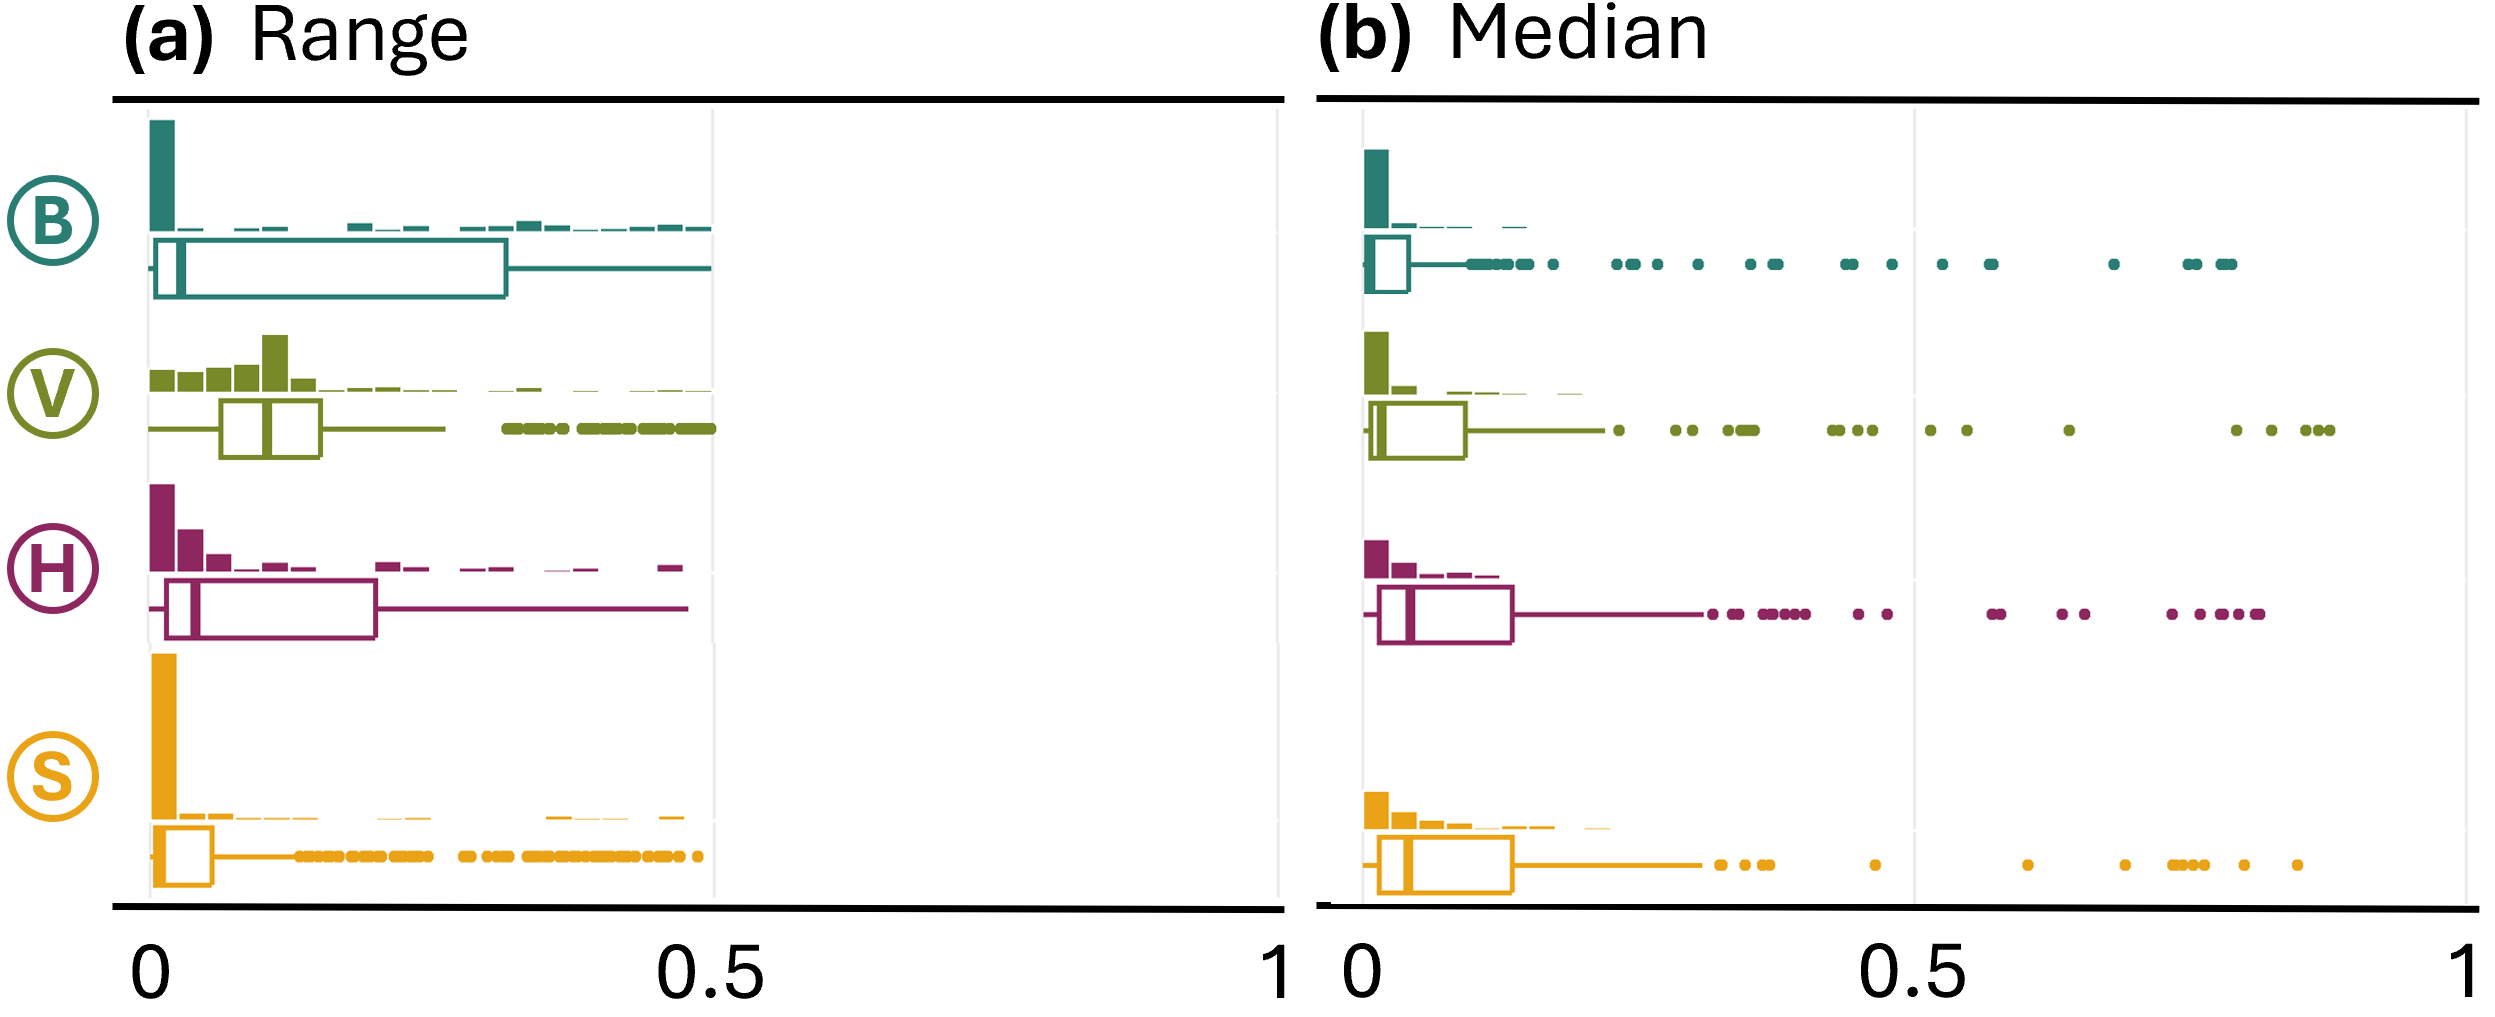
Figure 5: Distributions of relative errors reveal high performance of stripplots and poor performance of boxplots for range identification; explicit summary statistic encoding in boxplots and violinplots leads to high median identification accuracy.
Boxplots and violinplots, both offering explicit median markings, resulted in significantly higher accuracy for median identification compared to histograms and stripplots. Conversely, violinplots outperformed other forms for tasks emphasizing distributional shape (e.g., cluster identification, symmetry assessment), confirming that smooth density encoding leverages perceptual prototypes for such properties.
A prominently discordant finding is the lack of alignment between subjective preference and measured performance. Histograms were the most familiar and most preferred, yet not consistently the most accurate, particularly for summary statistics extraction. Boxplots, conversely, were preferred for median-finding tasks but considered abstract and confusing for others, and violinplots, though underutilized in practice, were interpreted as intuitive upon exposure.
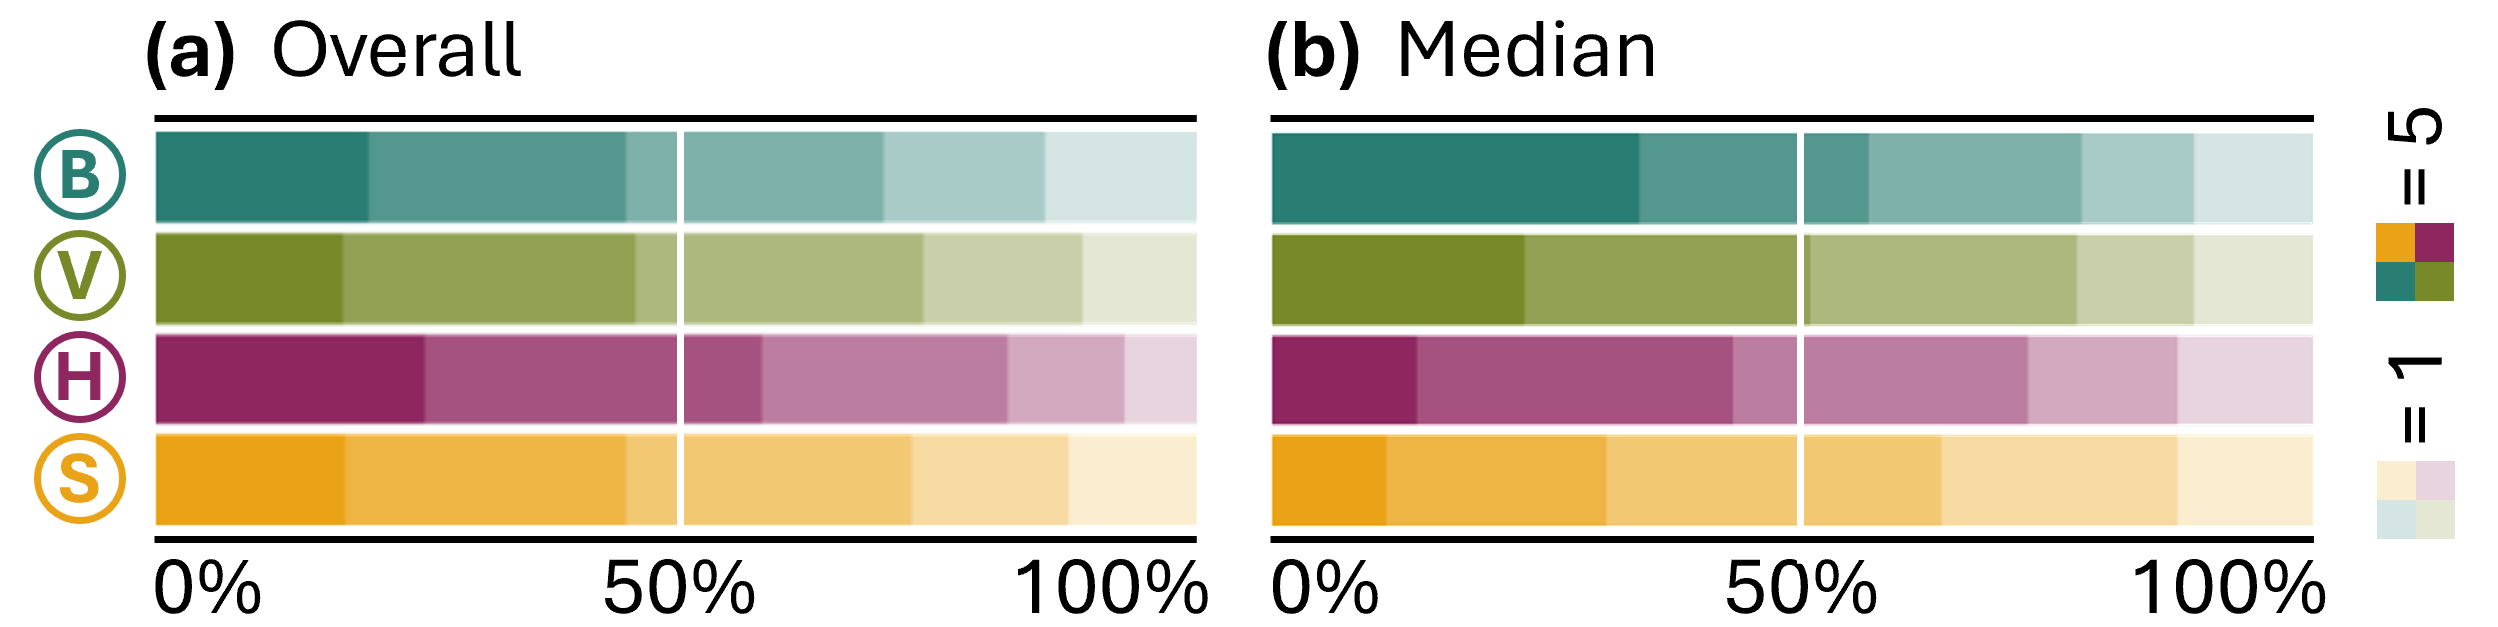
Figure 6: Confidence ratings indicate that, while histograms yield the highest overall confidence, explicit encoding (as in boxplots/violinplots) drives higher confidence specifically for median-centric tasks.
Domain Expert Practices
Interviews with researchers from statistics, data visualization, medicine, and environmental science revealed selection of distribution charts is biased towards field conventions and audience expectations, often at the expense of analytic suitability. Boxplots and bar charts dominate formal reporting, while histograms serve exploratory analysis, and violinplots are seldom used despite recognized utility. Experts universally revise positive attitudes towards violinplots upon reviewing their affordances during interview, and expressed intent to diversify chart usage after reflecting on the study’s comparative findings.
Implications and Recommendations
The results advocate for task- and audience-aware visualization design, rather than reliance on familiarity or field-specific tradition. Systematic trade-offs were observed:
- Boxplots: High accuracy for median/explicit summary stats; susceptible to fundamental misinterpretation of the box and whisker semantics.
- Violinplots: Effective for both shape inference and summary statistics, with low misinterpretation, especially when explicit marks are present.
- Histograms: Preferred and familiar but misinterpretation of the vertical axis is common; suboptimal for summary statistics extraction.
- Jittered Stripplots: High transparency, best for range/event identification, but clarity degrades with sample size.
These results empirically motivate defensive or hybrid chart design (e.g., v-plots, raincloud plots) to combine complementary strengths and cover individual weaknesses. The click-based evaluation framework introduced offers a paradigm for future studies, moving beyond “correct/incorrect” classification by directly capturing perceptual and interpretative strategies.
Limitations and Future Directions
Generalization beyond ggplot defaults should be approached with caution due to known effects of minor design changes on perception. Further, while synthetic datasets afford experimental control, supplementary studies with real-world data and domain-specific tasks are advised. Expanding the click-to-select paradigm to hybrid chart types and to richer analytic scenarios (e.g., uncertainty quantification, high-dimensional comparison) represents a promising avenue for further research.
Conclusion
This study provides robust, multi-faceted evidence that chart preference and familiarity are not reliable proxies for visualization performance and that the effectiveness of distribution charts is fundamentally task- and audience-dependent. Promotion of audience- and task-sensitive visualization selection, explicit summary statistics encoding, and the adoption of hybrid visual forms are recommended. Field-dependent conventions and didactic efforts should be re-examined to close the persistent gap between best practice and common usage.
(2604.08378)