- The paper presents a novel deep learning framework that integrates FDG-PET/CT imaging and temporal data, achieving a 4.3% AUC improvement over baseline models.
- The methodology employs a ResNet-50 based CNN combined with a temporal FNN and randomized sampling of multiple time points for balanced survival phase analysis.
- The framework effectively stratifies NSCLC patients by generating individualized survival curves that align with clinical biomarkers and enhance risk assessment.
Time-Driven Deep Learning Survival Analysis from FDG-PET/CT in NSCLC
Introduction
Accurate prediction of overall survival (OS) in non-small cell lung cancer (NSCLC) is a clinically urgent problem with direct implications for risk stratification and personalized management. Contemporary models based on clinical variables and traditional statistical survival models, such as Cox proportional hazards (CPH), provide limited prognostic value and insufficiently utilize the wealth of information in multimodal imaging. The presented work proposes a deep learning framework that jointly leverages tissue-wise FDG-PET/CT projections and a continuous temporal scalar as inputs to a convolutional neural network (CNN) and feedforward neural network (FNN), respectively. The model outputs a time-parameterized OS probability, supporting continuous-time survival analysis unconstrained by rigid time discretizations or proportional hazards assumptions.
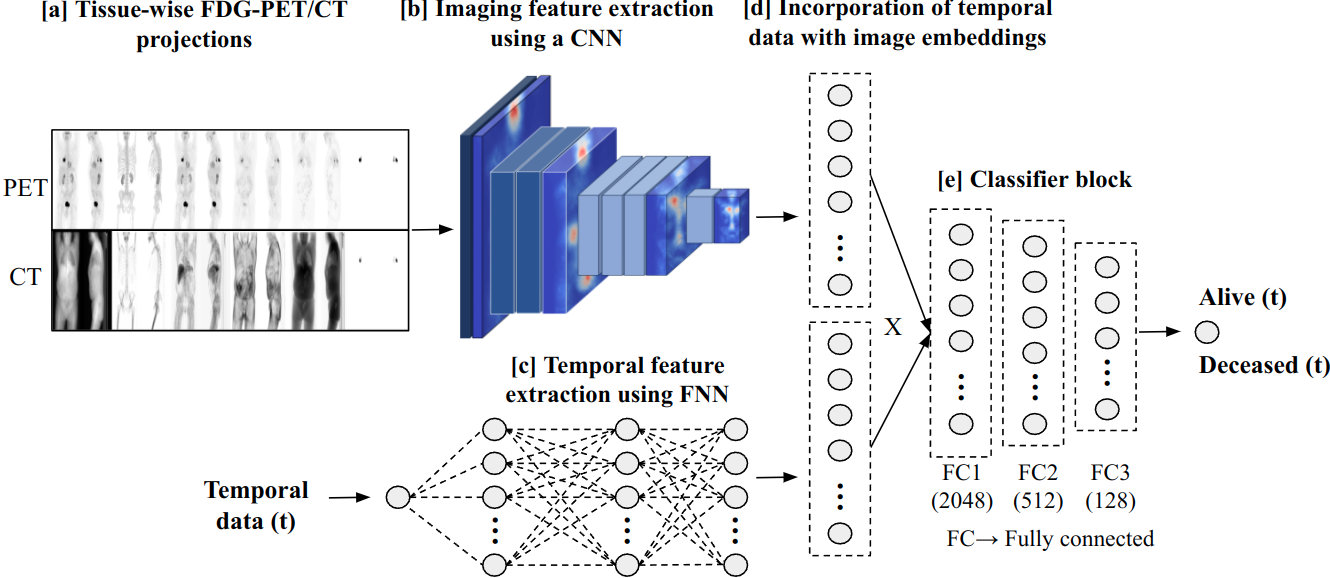
Figure 1: Overview of the proposed framework for time-driven OS prediction combining PET/CT projections, CNN/FNN embeddings, and temporal conditioning.
Data and Preprocessing
The U-CAN NSCLC cohort (n = 848) served as the foundation for development and validation, partitioned into a cross-validation set (n=556) with high-quality manual tumor segmentations and a test set (n=292) subjected to refined automated segmentation. Demographics and outcome distributions, including T/N/M staging and therapeutic regimen, underpin the model’s applicability to real-world, heterogeneous NSCLC populations. PET and CT volumes were decomposed into physiologically meaningful tissue types (bone, lean soft tissue, adipose, and air) using Hounsfield unit-based masks, followed by the computation of MIP and AIP projections to create a compact 12-channel 2D representation balancing information retention and computational efficiency. Tumor masks, derived via a UNet variant and expert curation, were included as explicit segmentation channels, enhancing downstream interpretability and prognostic power.
Model Architecture
The architecture centers on a ResNet-50 backbone, which ingests the 12-channel projections and yields high-dimensional spatial-medical embeddings. Simultaneously, a normalized temporal scalar (days since scan) is processed by a fully connected FNN, and the resultant vector is integrated via element-wise multiplication with the imaging embedding. This operation endows the network with the capacity to dynamically modulate its risk assessment dependent on arbitrary time points. The final classifier produces a time-parameterized probability of survival (alive vs deceased), generating a survival probability curve per patient.
Training and Sampling Strategy
A distinctive feature is the sampling of multiple, independent time points per patient per epoch from both the alive and deceased phases of follow-up, ensuring balanced representation and enabling the model to capture temporal transitions robustly.
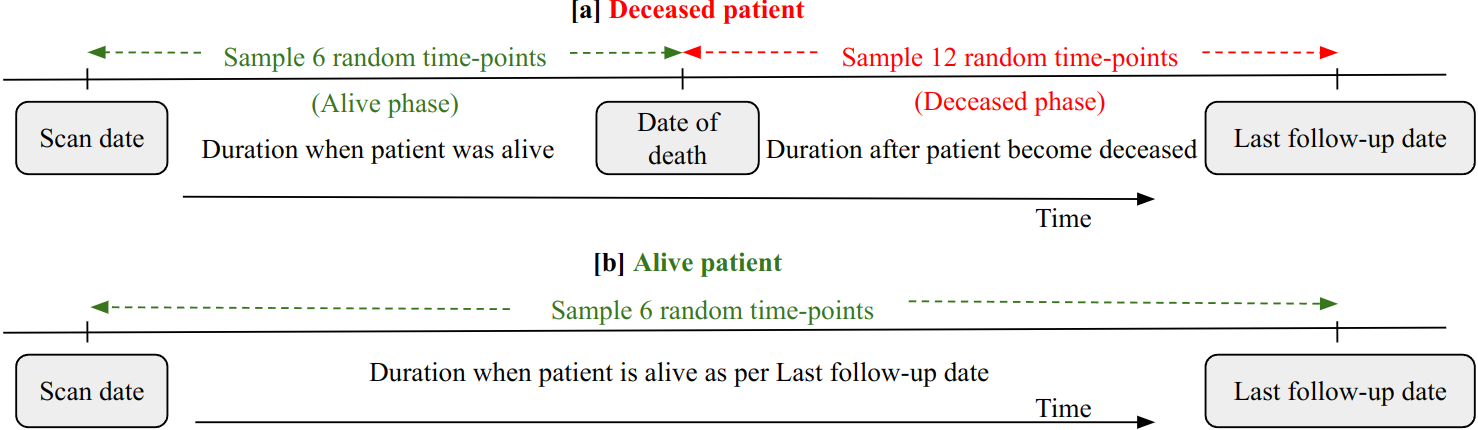
Figure 2: Randomized temporal sampling strategy for alive and deceased patients during model training.
Manual experimentation established a per-epoch sampling regime of 6 time points from the alive phase and 12 from the deceased phase, mitigating class imbalance inherent in OS datasets. Training employed a combination of focal loss and a bespoke survival consistency loss (SCL), which enforces the monotonic non-increasing property of the survival curve.
Comparative Analysis and Ablations
The proposed time-parameterized framework was benchmarked against established DL-based survival models (DeepSurv, DeepHit) and a strong ResNet-50 imaging-only baseline restricted to fixed-interval binary classification. The time-driven approach achieved a consistent AUC improvement of 4.3% over the baseline (mean test AUC 0.746 for time-driven imaging model vs 0.703 for baseline) and maintained superior discrimination at extended time horizons up to 5 years.
Ensemble results, combining imaging and clinical+IDP features through simple averaging of independent models, yielded the highest test AUC (0.788), underscoring the complementary value of morphometric, metabolic, and clinical markers.
Risk Stratification and Survival Outlook
The model supports the generation of individual survival probability curves, from which the area under the survival probability curve (AUSPC) is computed per patient and utilized for unsupervised risk stratification via k-means clustering.
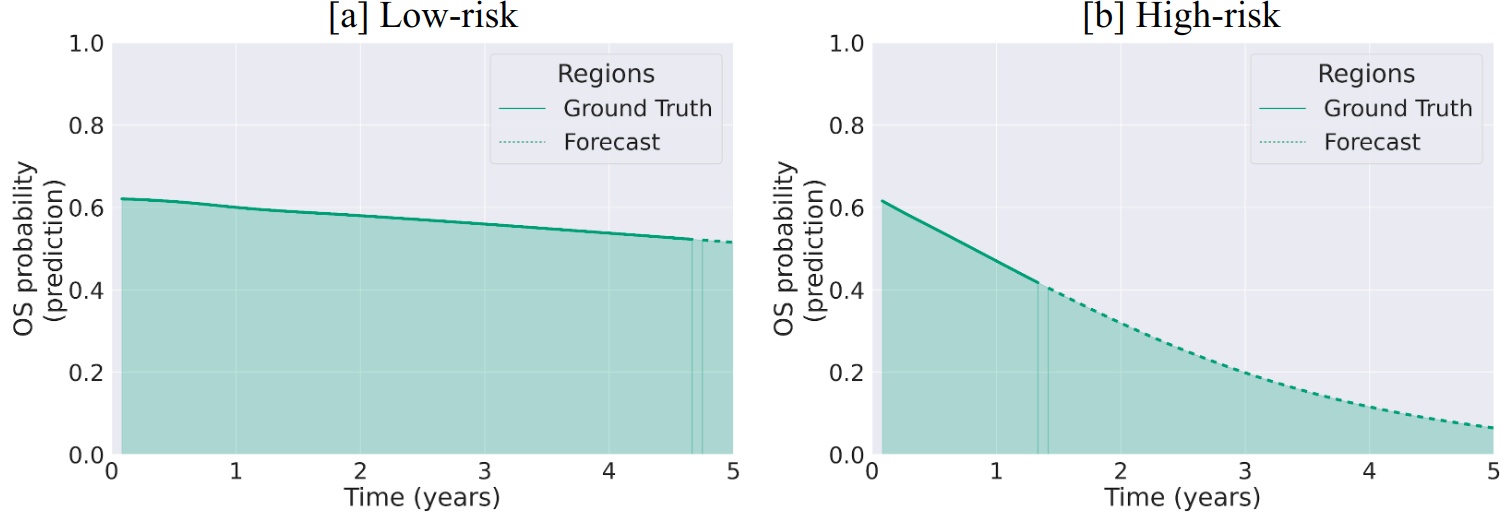
Figure 3: Typical OS probability curves for low-risk (high AUSPC) and high-risk (low AUSPC) patients as determined by the model.
Kaplan-Meier analyses reveal significant discrimination between predicted high- and low-risk groups—on both test set and within T-staged subgroups (with p<0.05 for T2–T4)—validating the framework’s clinical utility for cohort-level risk differentiation.
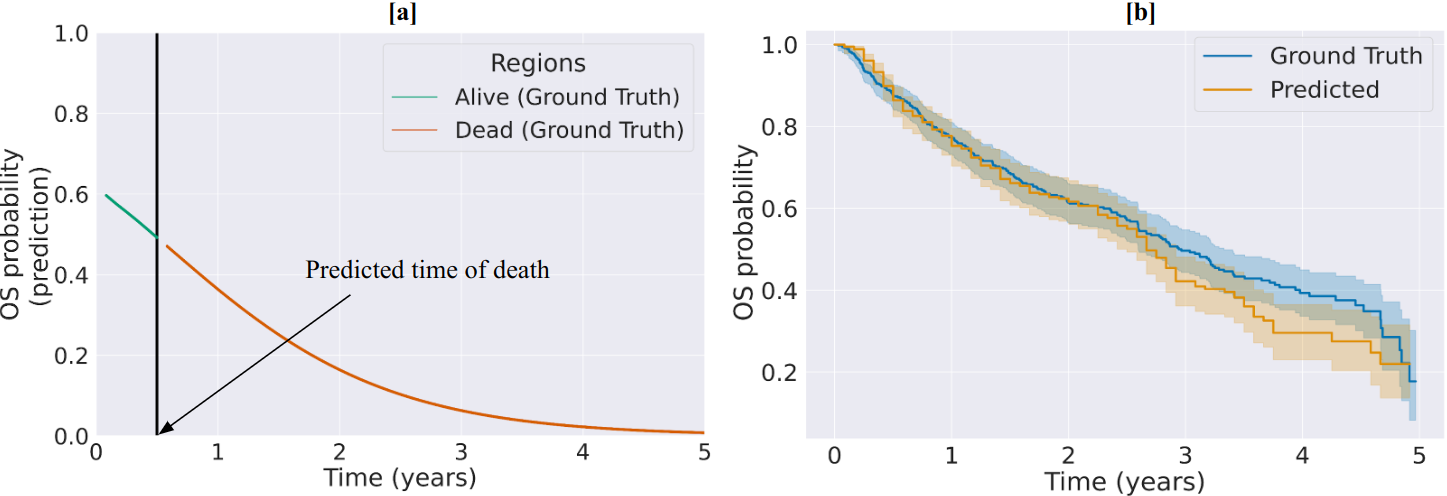
Figure 4: (a) Individual time-resolved OS prediction; (b) Aggregate test set KM curve comparing ground truth and predicted OS probabilities.
Figure 5: Kaplan-Meier curve stratifying test-set patients into high-risk and low-risk groups using model-derived survival probabilities.
Figure 6: Risk stratification in cross-validation cohorts across T-stages, showing significant separation for T2–T4.
Interpretability: Saliency Mapping
Saliency analysis reveals that the model’s predictive decisions are primarily focused on tumor regions, as visualized by Grad-CAM overlays.
Figure 7: Saliency analysis demonstrating that tumor-containing regions contribute most to OS predictions.
This reaffirms alignment with clinically accepted prognostic factors while providing transparency and trust in the decision process.
Additional Insights: Longitudinal Forecasting and Biological Correlates
Time-resolved OS probability plots demonstrate accurate identification of the time-of-death in deceased patients and robust progression-free survival forecasts in censored cases.
Figure 8: Model predictions of OS probability trajectories for multiple test-set patients, partitioned into deceased (a–d) and alive (e–h).
Biological consistency is further substantiated by associations between model-predicted risk and classical biomarkers such as TMTV, as well as demographic factors (e.g., sex).
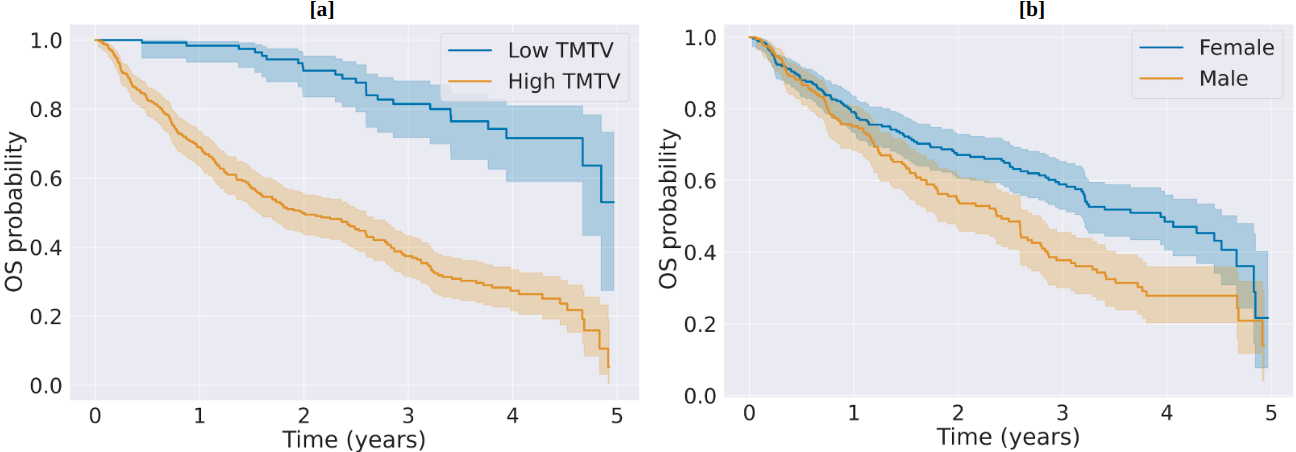
Figure 9: KM curves by (a) TMTV (low vs. high) and (b) sex (female vs. male), aligning survival probabilities with known clinical risk factors.
Limitations and Future Directions
Key limitations include single-institution data (limiting external validity), modest missing clinical data, and elevated computational requirements associated with time-resolved training. Expansion to multi-institutional data, integration of nodal/metastatic staging and additional biomarkers, adoption of hybrid or more efficient transformer-based encoders, and further work on interpretability (temporal-spatial attention attribution) are warranted. Future investigations should also seek to decouple the effects of temporal encoding on saliency and to evaluate effectiveness in other cancer types and imaging modalities.
Conclusion
This work establishes a time-parameterized, multimodal deep learning pipeline for survival analysis in NSCLC, outperforming traditional architectures and static-interval baselines in both discrimination and clinical risk stratification. Integration of imaging (including explicit tumor channels) and clinical data, temporal conditioning, and robust training strategies enable flexible, individualized survival probability forecasting with validated interpretability. The demonstrated stratification by model-derived risk highlights potential for clinical adoption, with clear extensions to wider oncology and imaging-centric survival prognostication.