- The paper demonstrates that cross-correlation of DESI tracers yields robust constraints on fₙₗ, achieving a ~9% improvement particularly with LRG-QSO data.
- It employs advanced techniques, including machine learning (SYSNet), to mitigate imaging systematics and enhance measurement precision of local primordial non-Gaussianity.
- The study validates its methodology with EZmock realizations, suggesting that cross-correlation strategies effectively overcome cosmic variance limits in large-scale structure analyses.
Constraining Local Primordial Non-Gaussianity via Cross-Correlations of DESI Tracers
Introduction and Scientific Motivation
Local primordial non-Gaussianity (PNG), characterized by the parameter fNL, provides a direct probe of inflationary physics. A measurement of fNL at O(1) precision is capable of distinguishing between single-field and multi-field inflation scenarios. The most stringent fNL limits to date have been obtained from measurements of the CMB bispectrum (e.g., Planck, fNL=−0.9±5.1), but this approach is cosmic variance limited. Large-scale structure (LSS) surveys, with their higher dimensionality and larger accessible volumes, provide a route to break through this limit by leveraging the scale-dependent bias signature that local PNG imparts to tracers of the density field.
DESI DR1, with spectroscopic samples of Luminous Red Galaxies (LRGs), Emission Line Galaxies (ELGs), and Quasars (QSOs), is an optimal dataset for such an analysis. However, imaging systematics in the largest-scale clustering—particularly for ELGs—present a substantial challenge for robust PNG constraints. This paper (2604.05213) addresses these systematic issues through an explicit focus on cross-correlation statistics between different tracer populations.
Methodology: Tracer Selection, Weighting, and Modeling
Tracer and Cross-Tracer Sample Definition
The analysis utilizes auto- and cross-correlation measurements for LRGs, QSOs, and ELGs within DESI DR1, carefully defining the overlapping redshift ranges for each tracer pair. The main innovation is including ELGs only in cross-correlations (ELGxLRG, ELGxQSO), where systematics unique to ELGs are uncorrelated with those in other tracers, allowing their impact to be suppressed.
Systematics Mitigation
Systematics correction is implemented through a combination of linear regression (LRGs, QSOs) and machine learning-based approaches (SYSNet for ELGs), targeting spurious angular fluctuations induced by imaging and spectroscopic artifacts. To ensure robustness, cross-tracer correlations are used, leveraging the fact that non-common systematics do not affect multiple tracers in the same way.
Power Spectrum Estimation and PNG Modeling
The Fourier-space power spectra are estimated with optimal quadratic estimator and FKP weighting. PNG is modeled as a scale-dependent modification of the linear bias, Δb(k,z)∝fNL/k2, with detailed consideration of assembly bias and the p parameter for each tracer. Marginalization over shot noise, redshift evolution, and velocity dispersion is performed. Covariances are computed from EZmocks tailored to DESI DR1 survey geometry, with corrections for finite mock numbers.
Mock Validation and Systematic Error Analysis
The entire pipeline is validated on EZmock realizations with fNL=0, quantifying statistical accuracy, any residual bias, and the expected gain in fNL precision from adding each cross-tracer measurement.
Results: Precision Gain from Cross-Correlations
The inclusion of cross-correlation data—especially the LRGxQSO sample—yields a clear improvement in fNL constraints. Specifically, the DR1 LRG+QSO combination gives fNL0, while adding LRGxQSO improves the constraint to fNL1, representing a fNL2 reduction in the error bar, inline with the fNL3 improvement predicted by mocks.
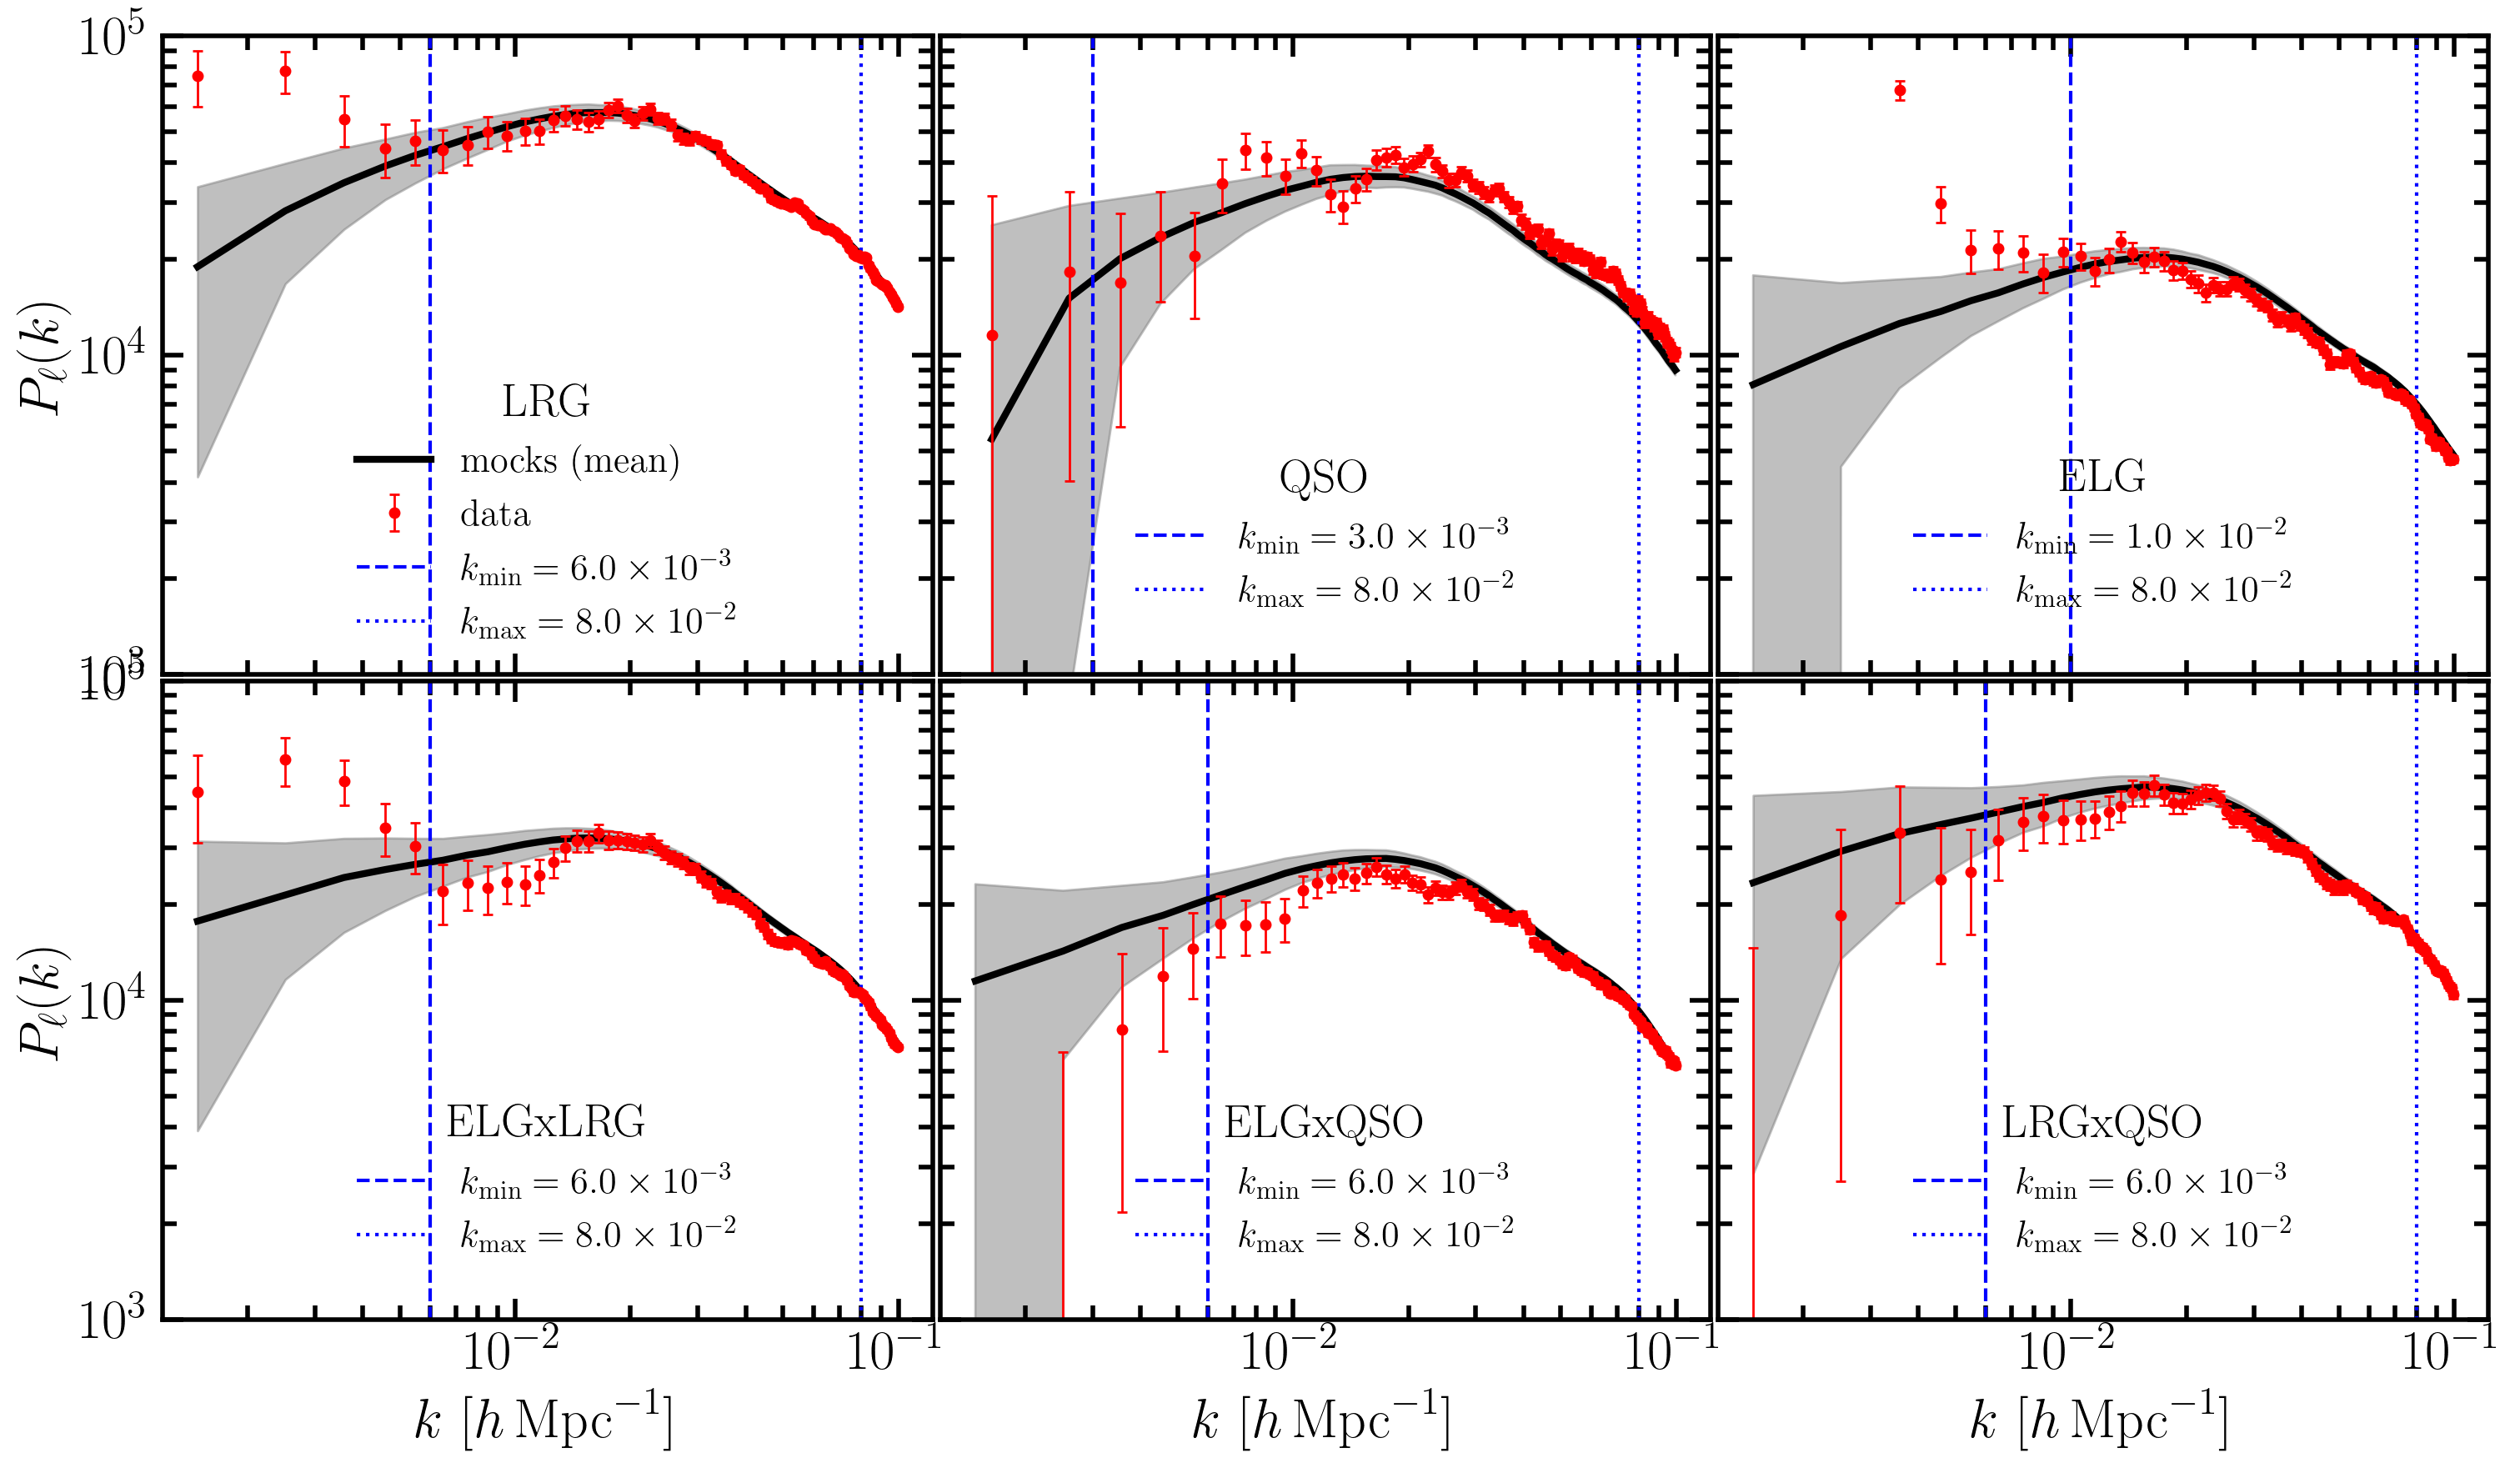
Figure 1: Two-point galaxy clustering of DR1 DESI tracers (auto and cross-power spectra), with data and mock comparison across tracers and the fNL4 range used in modeling.
The anticipated gain from including all ELG-related cross-correlations does not materialize in DR1—mock analysis suggests a further fNL5 improvement, but the data exhibits no additional precision gain—consistent with statistical fluctuations from the mock ensemble.
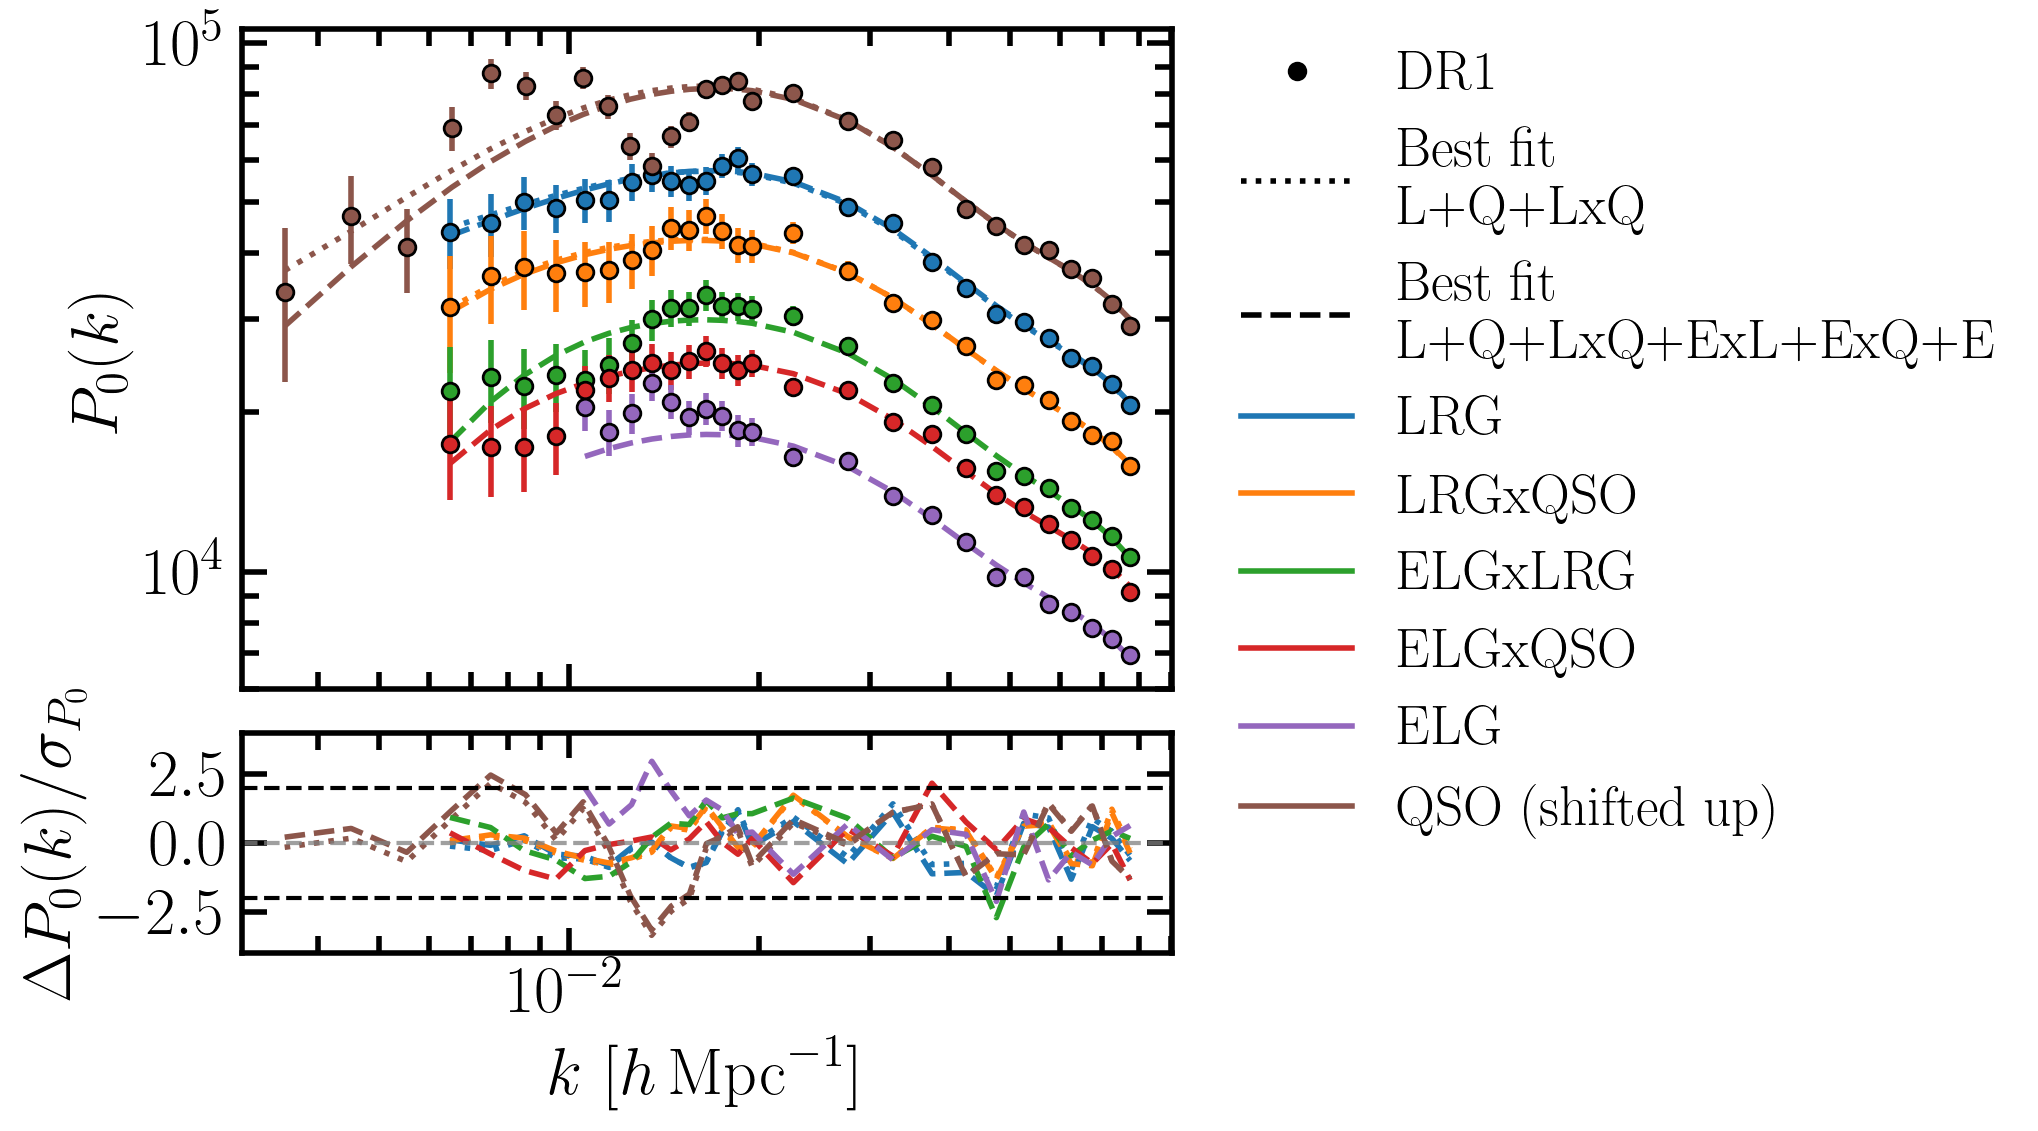
Figure 2: Comparison of best-fit monopoles and fractional model-data residuals for the richest cross-correlation sample set.
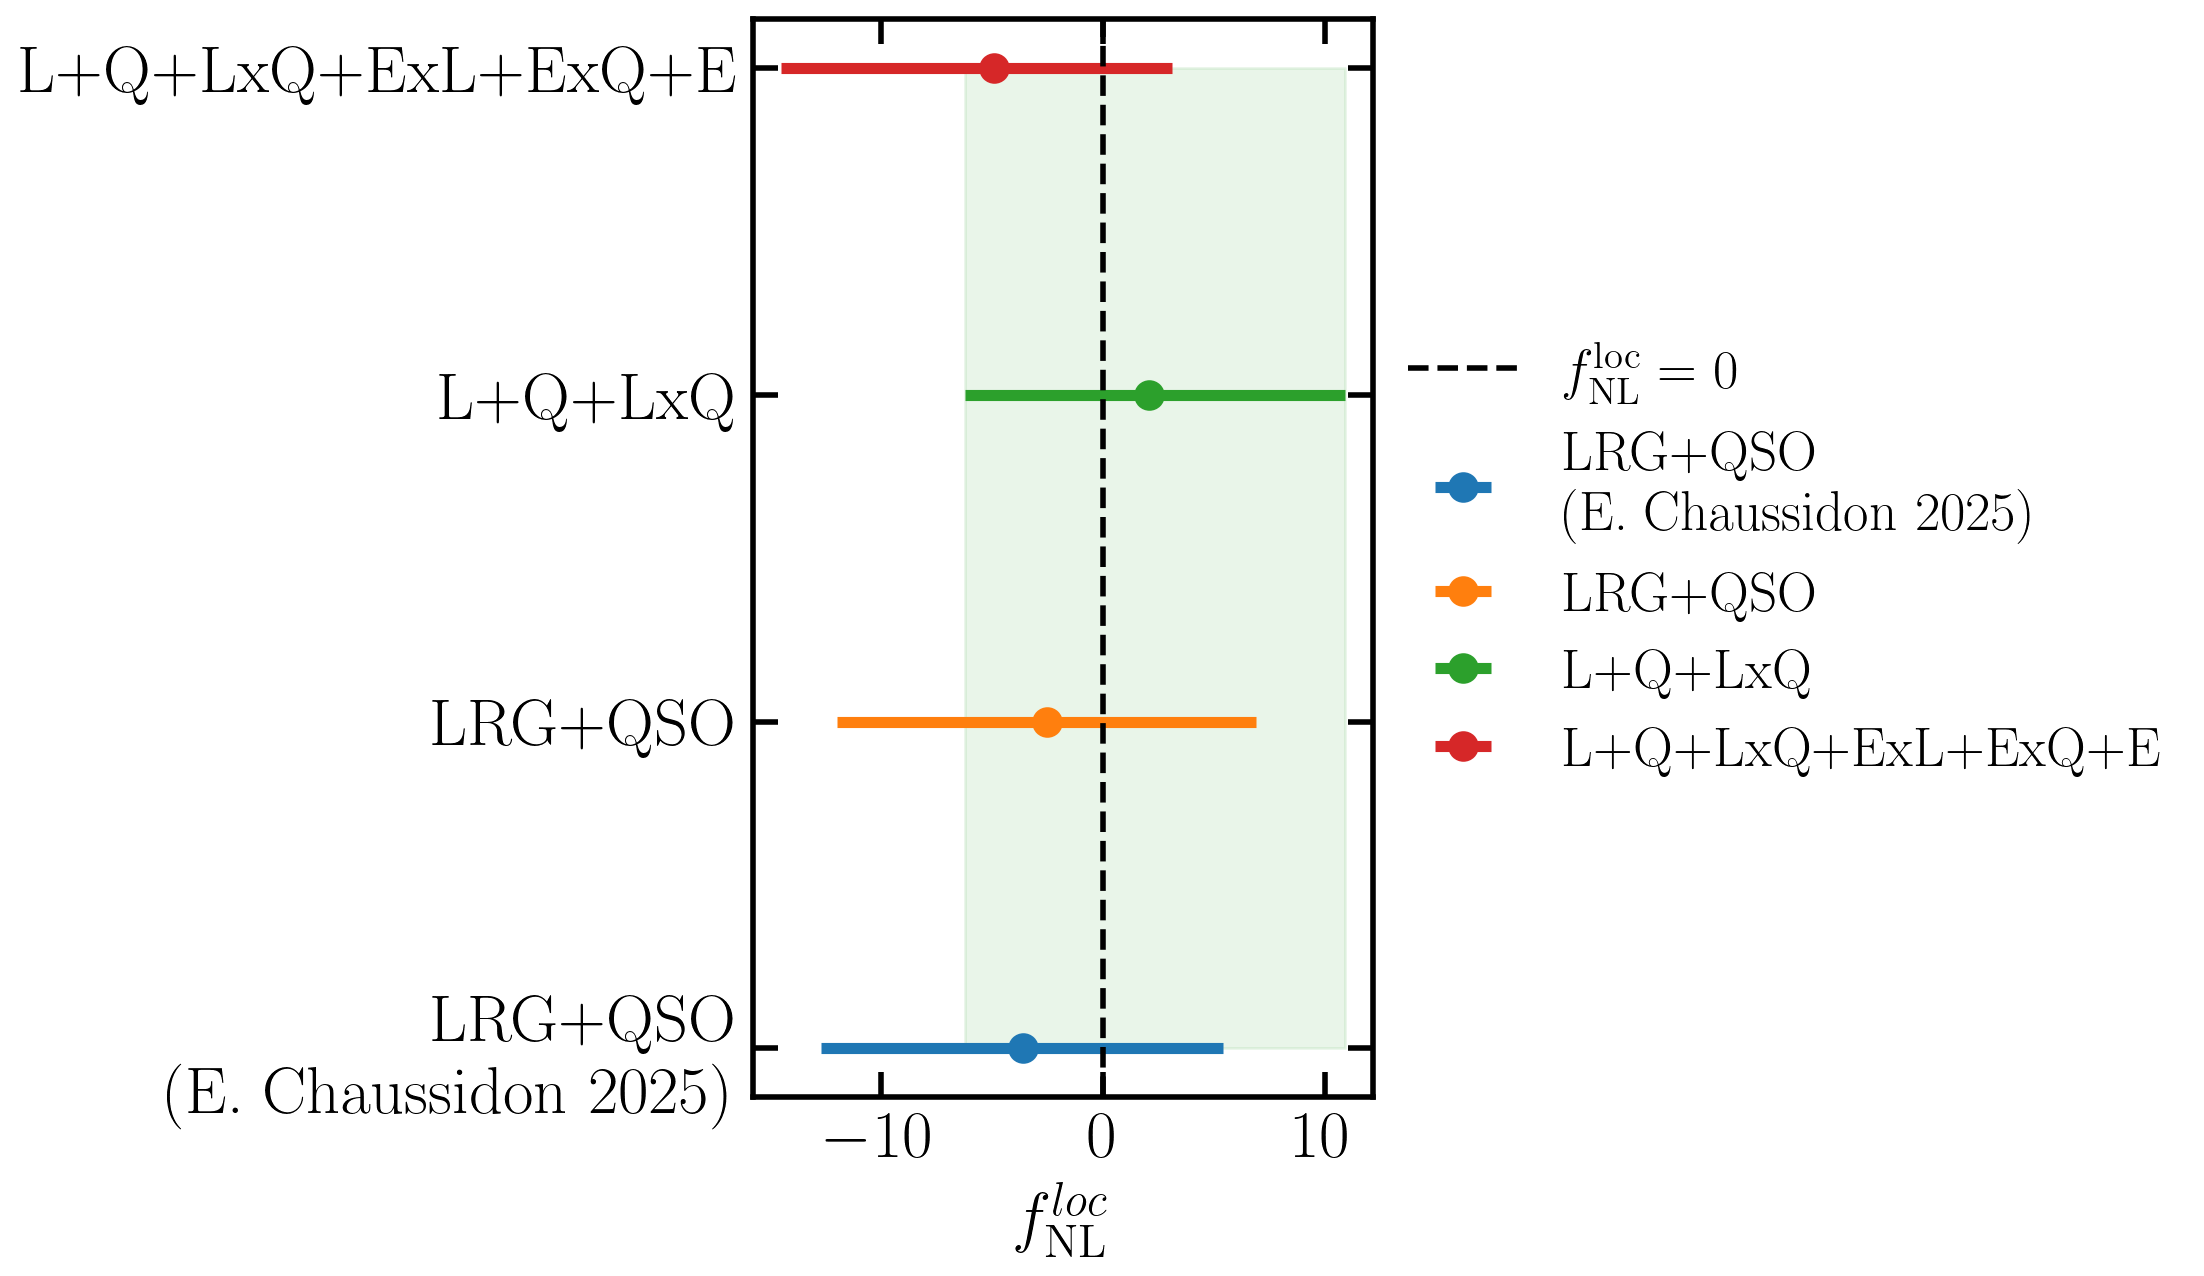
Figure 3: Marginalized fNL6 constraints for auto-correlation (LRG+QSO), addition of LRGxQSO, and further addition of ELG correlations, highlighting the main precision gains.
Analysis of the posterior width and central values in 100 mock fits demonstrates that the observed modest gain is fully consistent with the expected distribution.
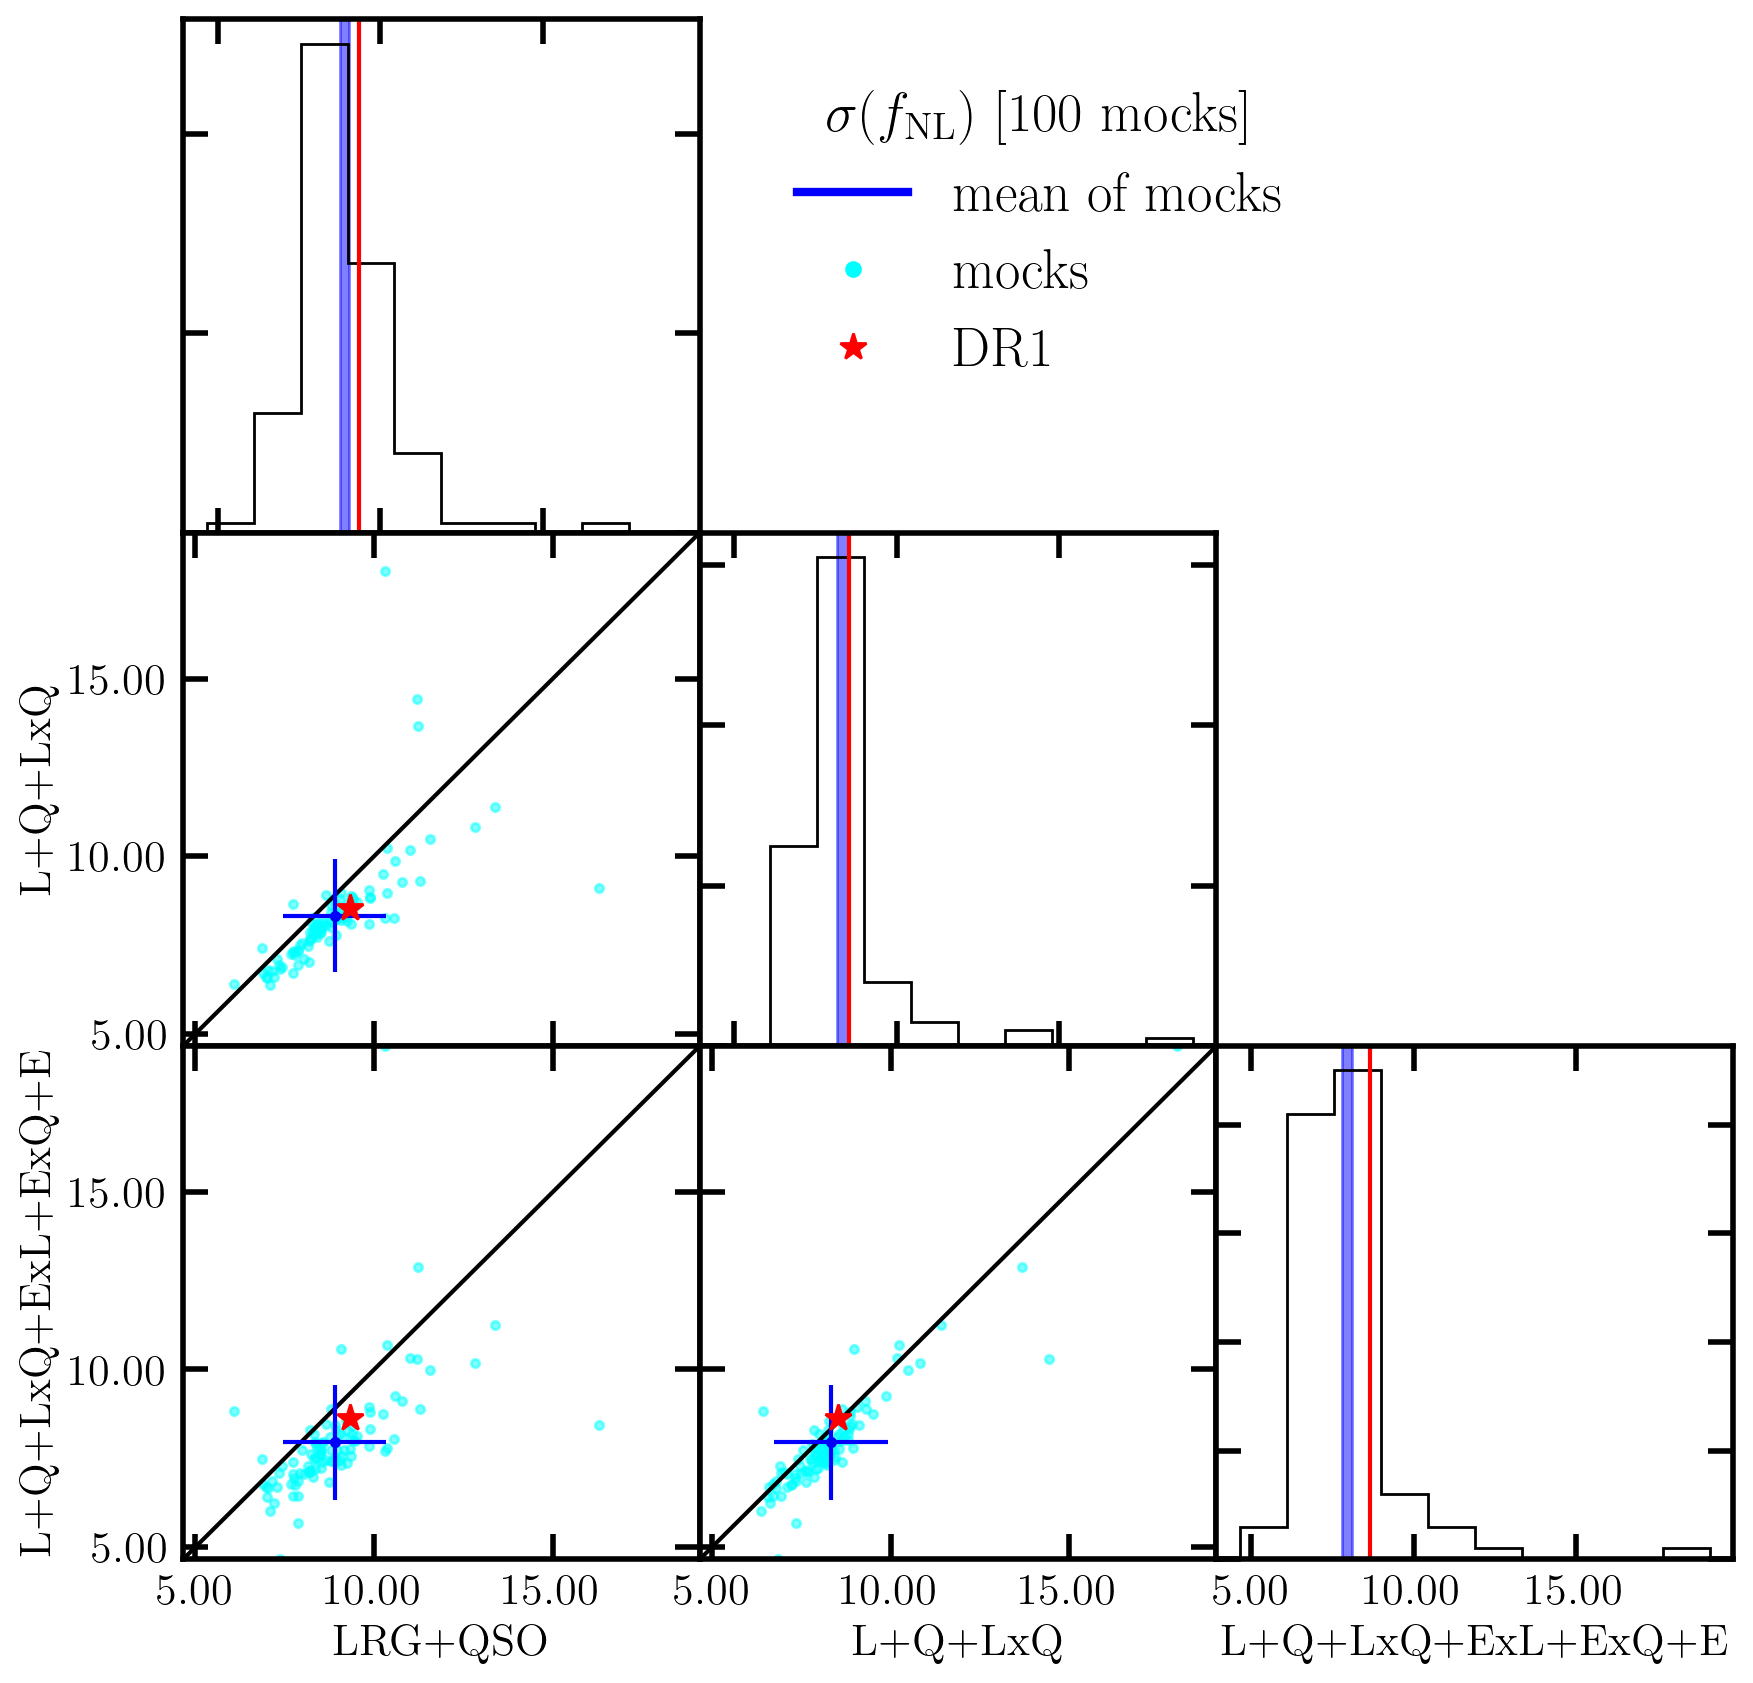
Figure 4: Dispersion in fNL7 error bar across mock realizations and DR1 data, showing the data within expected statistical scatter.
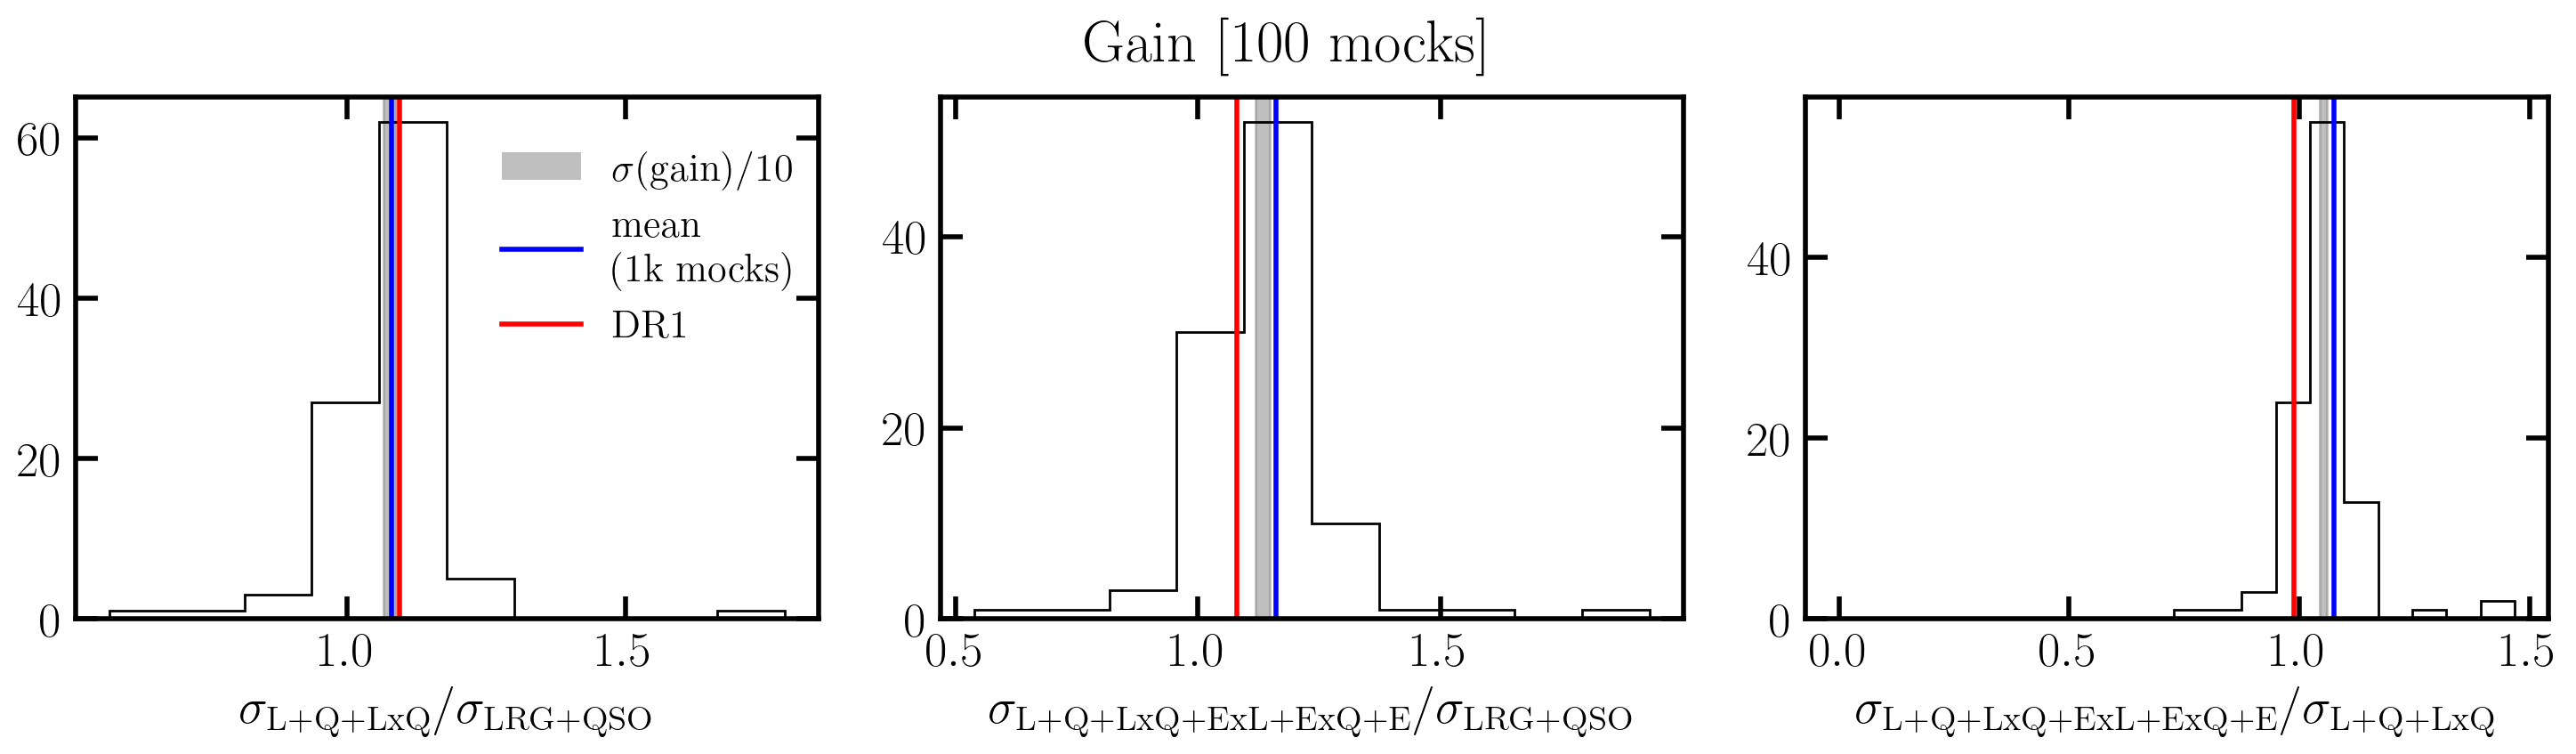
Figure 5: Relative gain distribution in fNL8 error from cross-correlation inclusion across mocks versus DR1, demonstrating compatibility.
No evidence for residual systematics exceeding the modeled uncertainty is observed in the data, and shifts in fNL9 central value for different data combinations are consistent with those found in mocks.
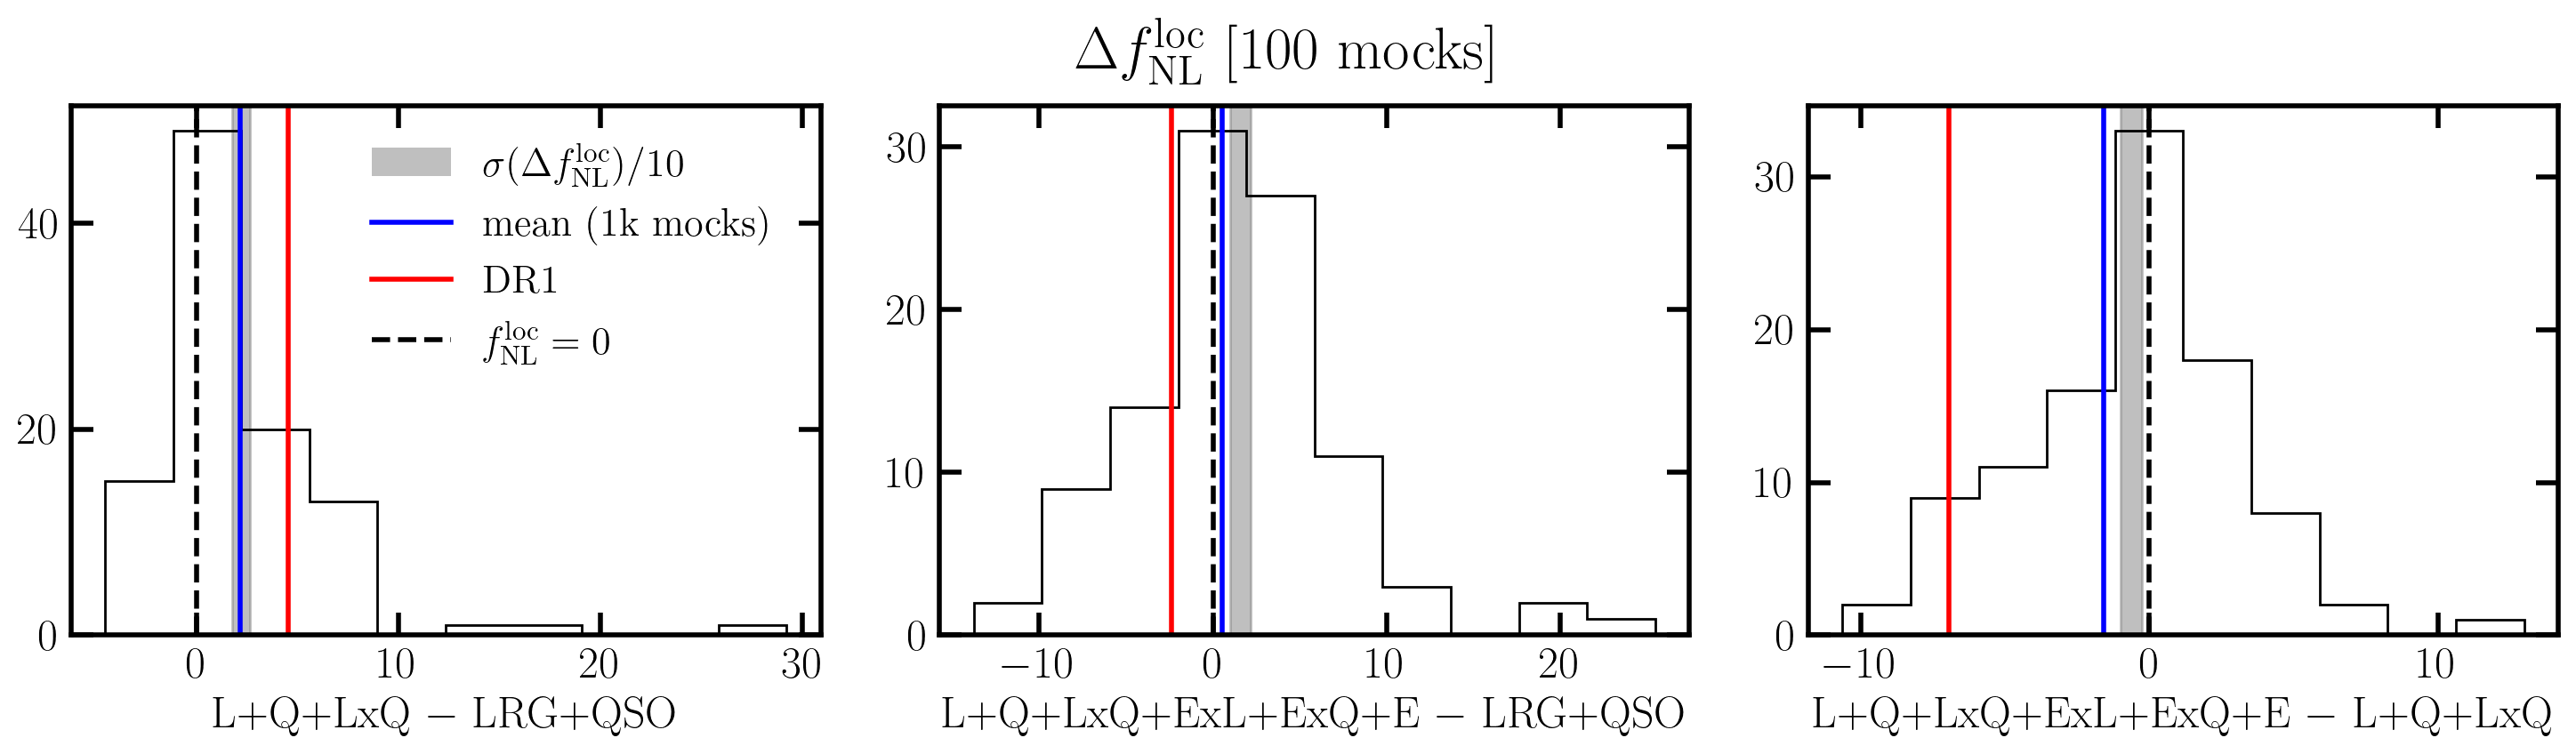
Figure 6: Central value differences in O(1)0 between auto-only and cross-correlation-inclusive samples across mocks and data, supporting lack of significant biases arising from systematics.
Theoretical and Practical Implications
Robustness of LSS PNG constraints: The analysis confirms that cross-correlations between spectroscopic samples are a powerful, systematics-robust probe of O(1)1 owing to their immunity to non-common imaging and spectroscopic systematics.
Precision parity with higher-order statistics: The precision gain obtained from adding cross-correlations matches, and in some scenarios, exceeds the benefit from including the bispectrum or other non-Gaussian higher-order statistics, as reported in parallel studies.
Recommendations for upcoming surveys: The results justify incorporating cross-correlation statistics as a default component for future full-shape and PNG analyses in LSS surveys, including in subsequent DESI data releases.
Constraints on galaxy bias response: The measurement is sensitive to the galaxy–PNG response parameter O(1)2, and future progress will require improved, simulation-calibrated models for O(1)3 and assembly bias, as signaled by the literature ([Barreira 2020a, b], [Fondi 2024]).
AI and systematics mitigation: The operational use of neural networks (SYSNet) to correct for ELG imaging systematics exemplifies a trend toward data-driven, machine learning-based corrections in high-precision cosmology. As galaxy surveys increase in volume and complexity, scalable ML solutions will be vital for bias control.
Conclusion
This work demonstrates that cross-correlation of DESI DR1 spectroscopic samples, especially LRGs and QSOs, secures a statistically robust and systematics-tolerant improvement in local PNG constraints. The resulting O(1)4 illustrates both the power of cross-tracer analysis and the efficacy of careful systematics mitigation. Analysis of ELGs and additional tracers will benefit from the continued expansion and refinement of imaging and masking methods; however, ELG cross-correlations do not yet contribute significant additional precision, consistent with mock predictions for the current data volume.
Future directions include leveraging improved assembly bias calibrations, full incorporation of QSO covariance, and expansion to DR2 and Y5 footprints of DESI, all guided by the systematics-resistant methodology established in this analysis.
The cross-correlation strategy outlined here is recommended as a standard approach for next-generation cosmological constraints on primordial non-Gaussianity.