- The paper demonstrates robust detection of strong Hβ+[OIII] emission in three z≥9 galaxies using deep JWST/MIRI imaging and advanced SED fitting.
- It employs precise photometric redshift estimations and measures exceptionally high rest-frame equivalent widths (600–1300 Å), matching trends seen at lower redshifts.
- The study estimates the nebular luminosity function and ionizing photon production efficiency, offering critical insights into early galaxy evolution and the reionization era.
Strong Hβ+[O III] Line Emitters at z≥9: Insights from the MIDIS Survey
Introduction and Survey Overview
The MIRI Deep Imaging Survey (MIDIS) leverages JWST/MIRI 5.6 μm imaging of the Hubble Ultra Deep Field to identify extremely high-redshift (z≥9) galaxies characterized by pronounced Hβ+[O III] nebular emission. The primary objective is to quantify the properties of rest-frame optical emission line galaxies deep into the epoch of reionization, where direct Lyα spectroscopic confirmation is severely inhibited by IGM neutral hydrogen. By combining deep MIRI imaging with extensive multiwavelength photometry spanning HST and JWST/NIRCam, the survey is optimized to detect rest-frame optical line excesses that trace vigorous star formation in the early universe.
Methodology: Sample Construction and Photometric Characterization
Robust photometric redshift determination and SED modeling were performed using {\tt The Farmer} and {\tt EAzY-py} for redshift estimation, followed by {\tt Bagpipes} for physical parameter inference. The sample selection required a significant F560W flux excess—relative to the continuum estimated via adjacent NIRCam bands—consistent with blended Hβ and [O III] entering the bandpass at $9.4 < z < 11.3$. Strict cuts on SED-fit goodness and a visual inspection ensured reliability, yielding three galaxies passing all criteria.
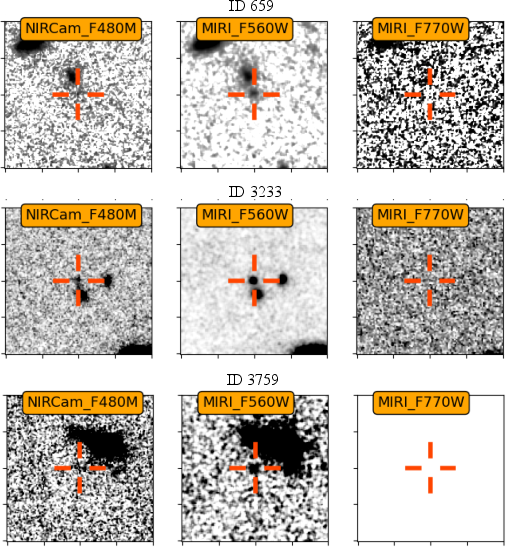
Figure 1: 5×5 arcsec postage stamp images of the robust Hβ+[O III] excess candidates in NIRCam/F480M, MIRI/F560W, and MIRI/F770W, highlighting the pronounced flux excess in F560W.
Their observed photometry, SED fits, and derived photometric redshifts demonstrate unambiguous selection as genuine high-z emission-line galaxies.
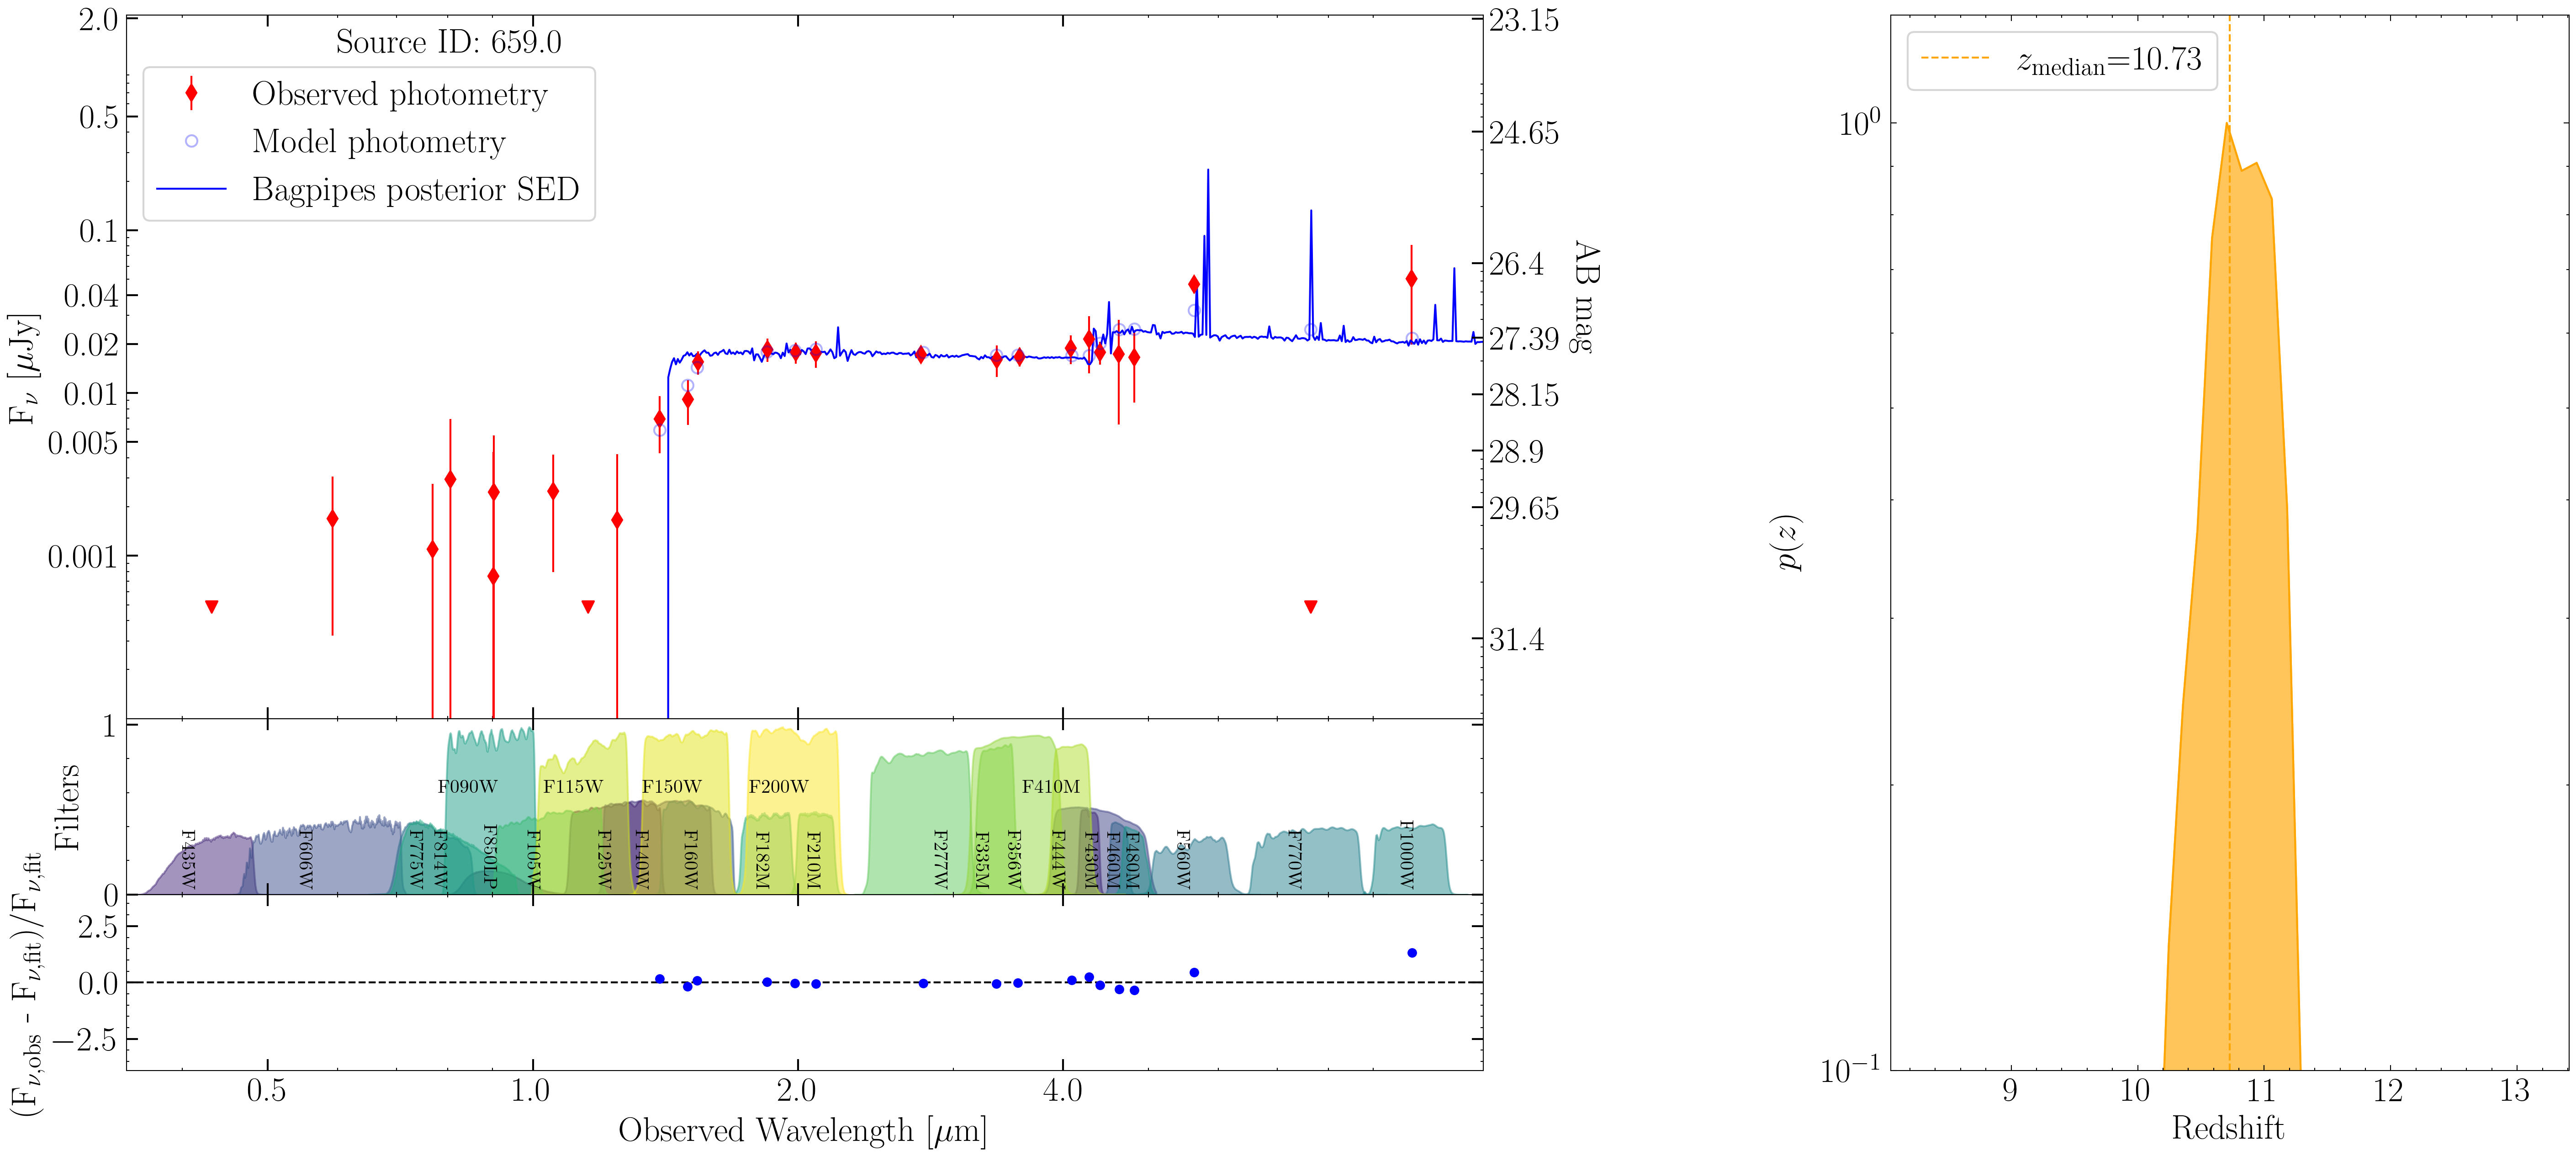
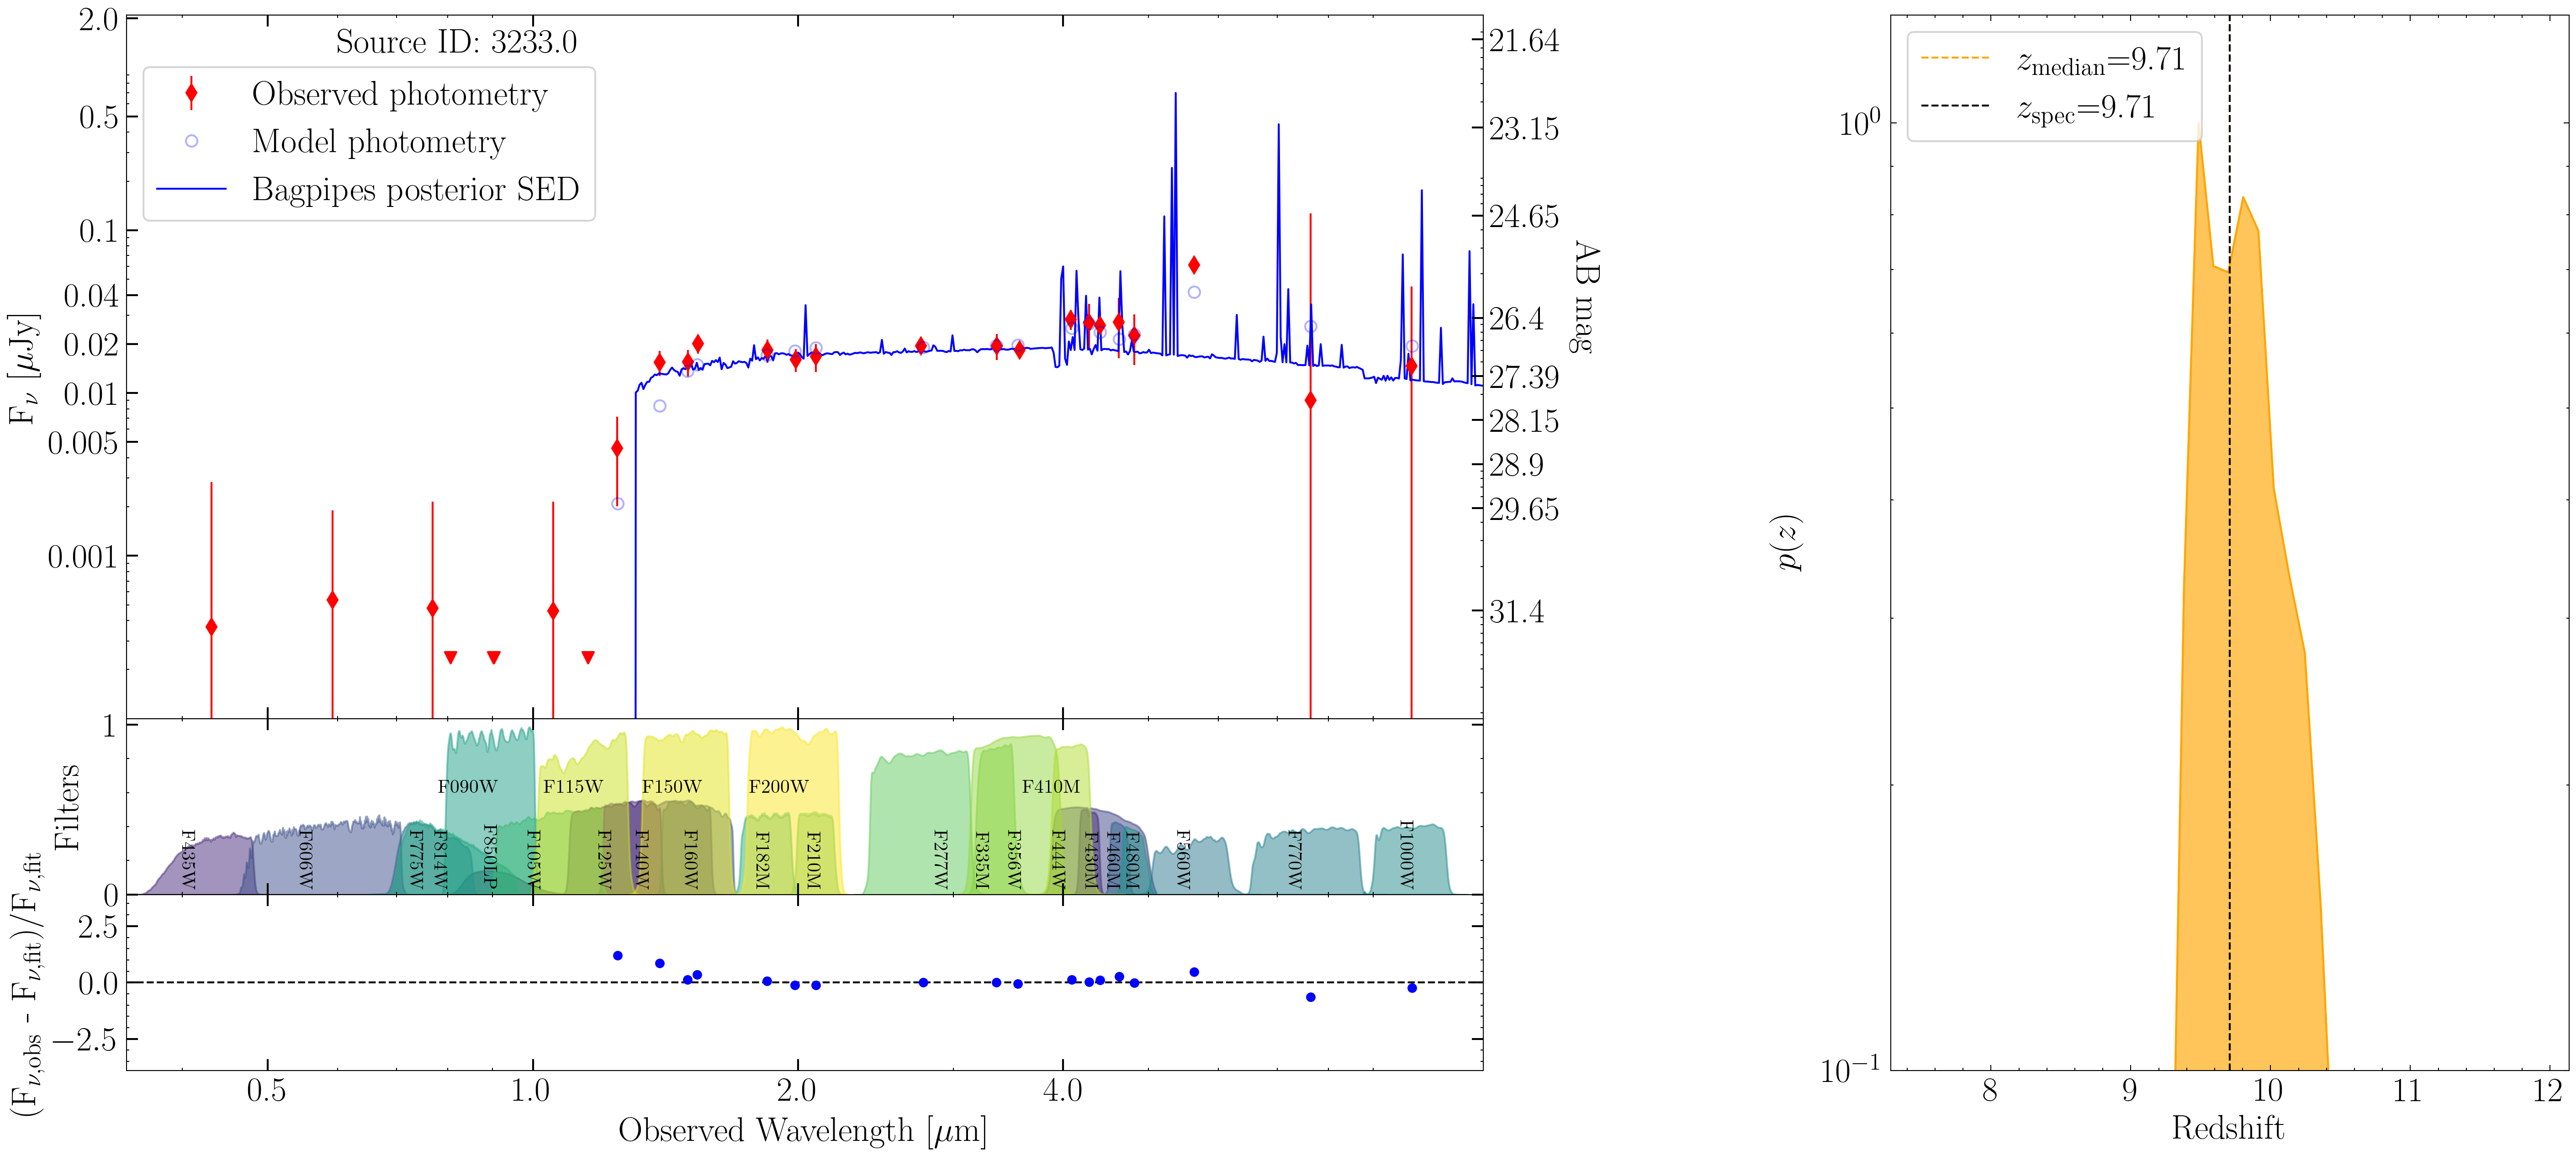
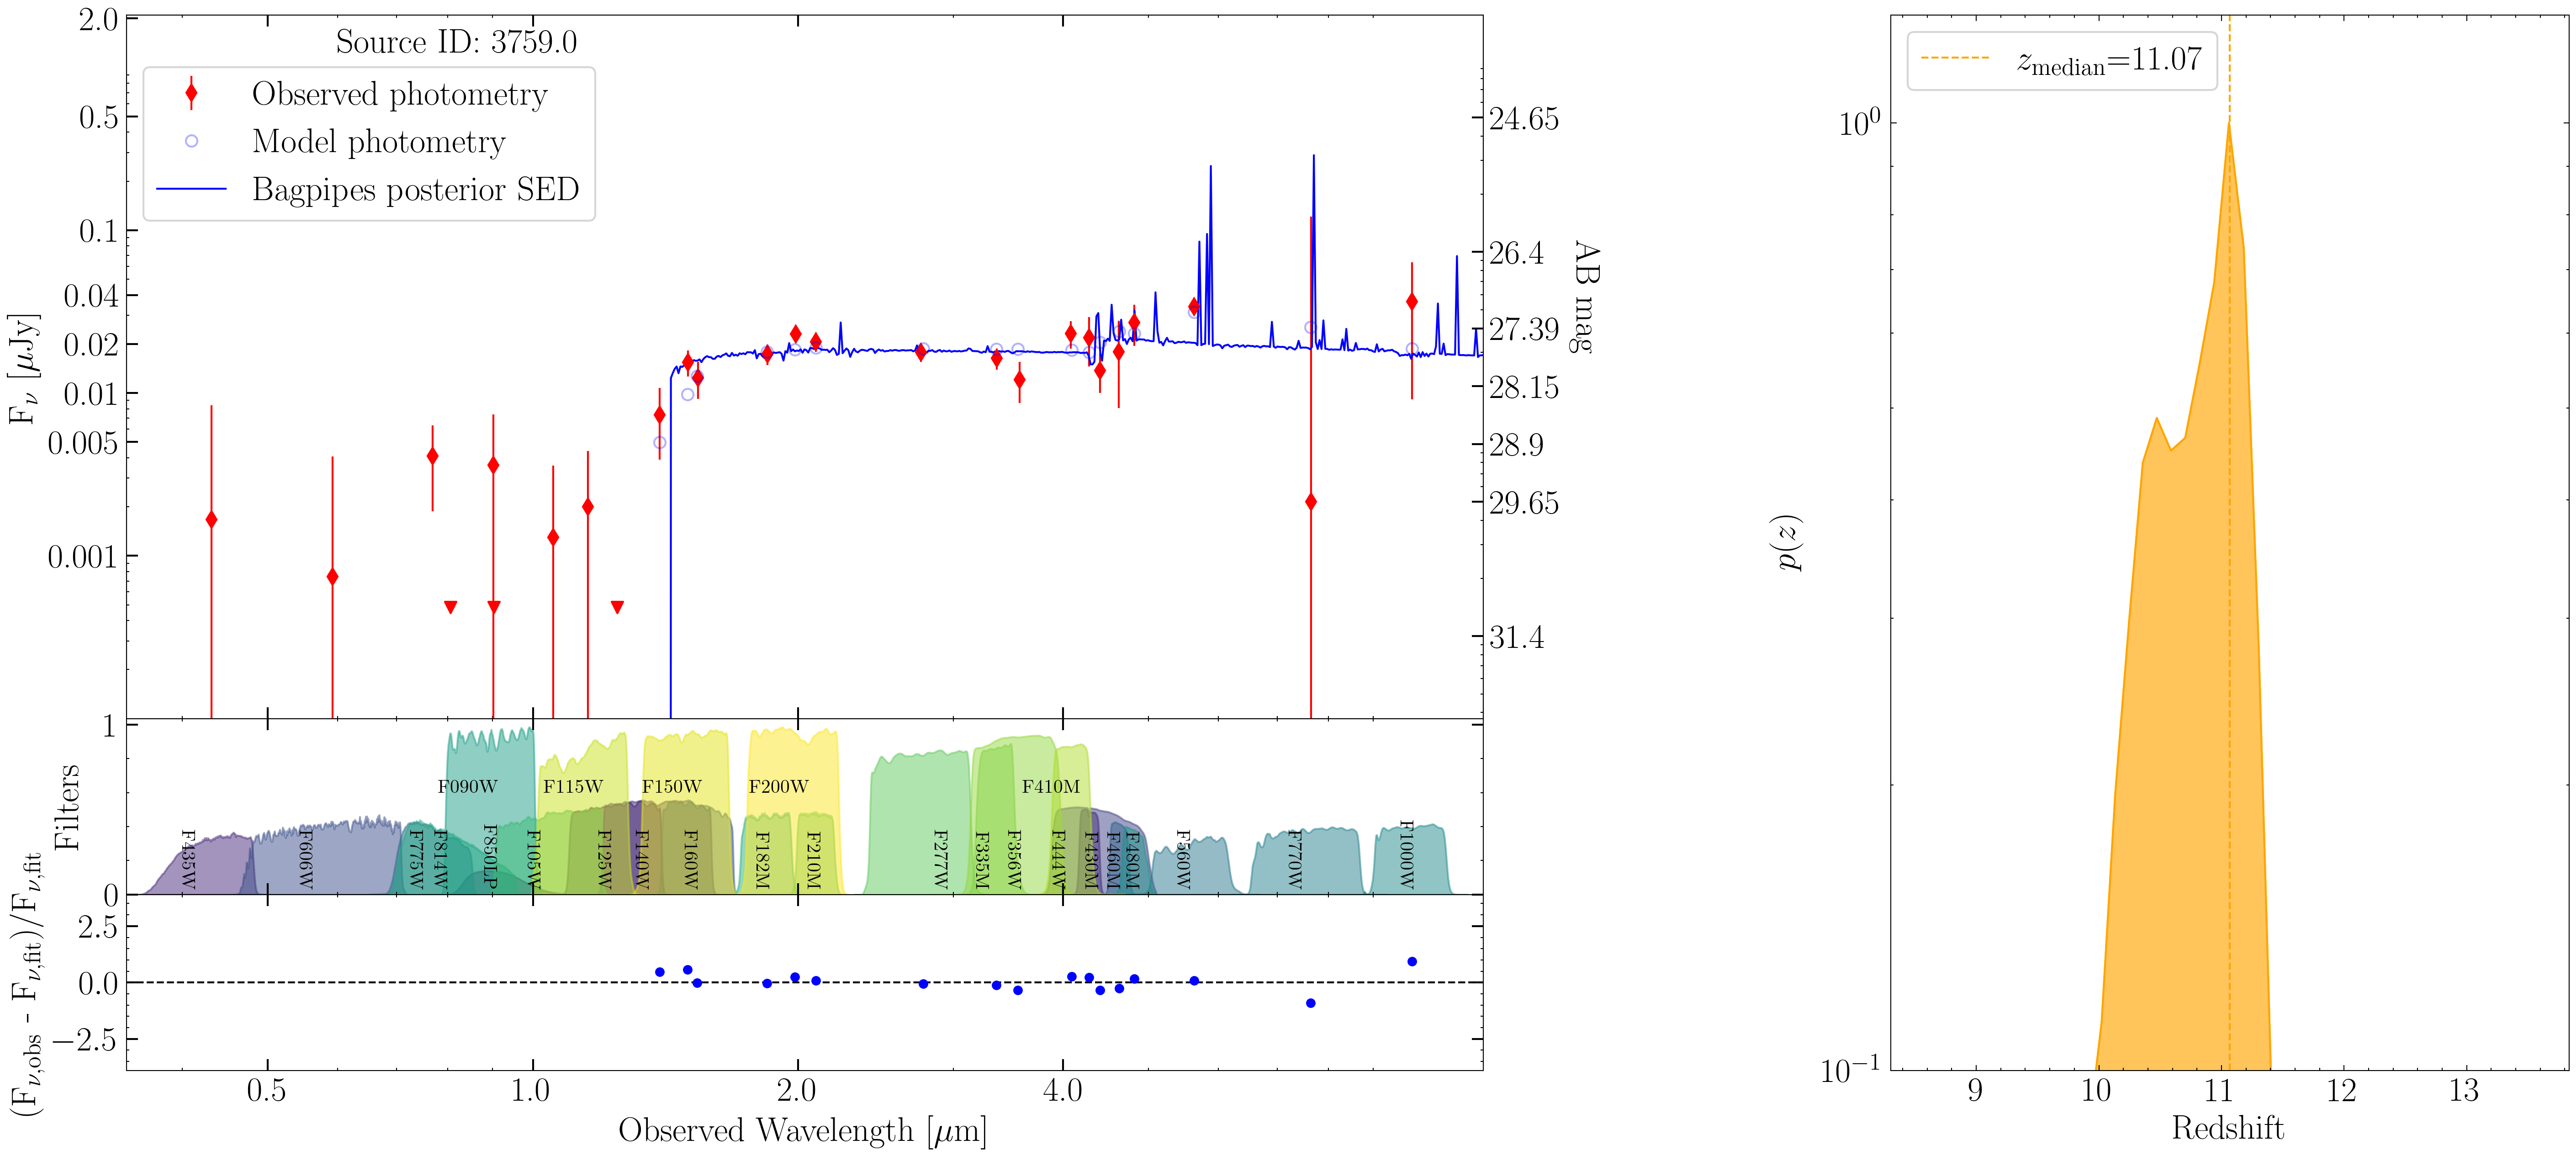
Figure 2: SED fitting results and photometric broad-band points for the three robust MIDIS Hβ+[O III] emitters with probability distributions for photometric redshift.
The physical parameter space spanned by these galaxies—MUV∼−19.2 to −19.4, logM⋆/M⊙∼8.0–8.4, and β∼−2.1 to −1.8—is consistent with low-mass, blue systems expected to dominate early cosmic SFR density.
Equivalent Width Distributions, Scaling, and Redshift Evolution
The derived Hβ+[O III] rest-frame EWs of the MIDIS galaxies ($600$–z≥90 Å, median z≥91 Å) are among the largest known at these epochs, rivaling or exceeding typical values at z≥92–9. Comparison with a compiled sample of 16 spectroscopically confirmed z≥93 Hβ+[O III] emitters shows remarkable consistency in the EW distribution.
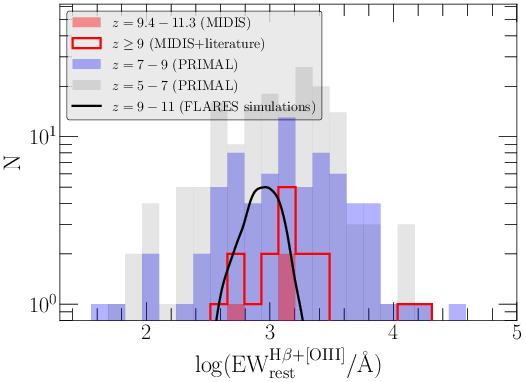
Figure 3: The EW distribution for the MIDIS sample and combined MIDIS+literature z≥94 sample versus the z≥95–9 PRIMAL survey comparison.
When divided into luminosity bins, the EW distribution is log-normal with UV-brighter systems exhibiting higher median EWs—a trend qualitatively consistent with findings at z≥96–9, with z≥97 Å magz≥98 inferred.
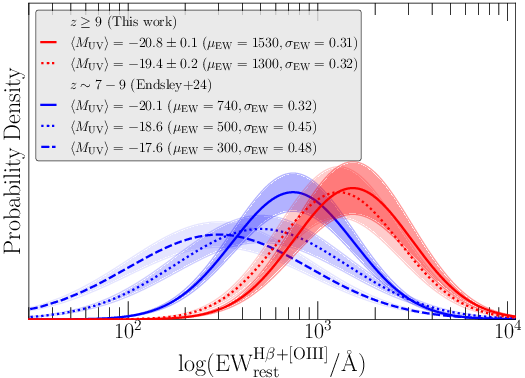
Figure 4: Inferred EW distributions for bright and faint z≥99 subsamples, compared against analogous JADES $9.4 < z < 11.3$0–9 subsamples.
No statistically significant anti-correlation between EW and stellar mass is found in the $9.4 < z < 11.3$1 sample, though a log-linear fit is broadly compatible with the anti-correlation established at lower redshifts.
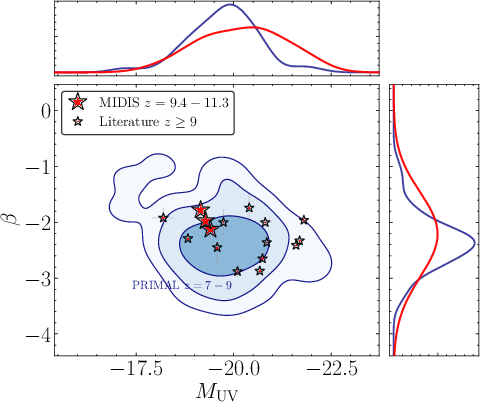
Figure 5: Distribution of the MIDIS and literature $9.4 < z < 11.3$2 galaxies in $9.4 < z < 11.3$3–$9.4 < z < 11.3$4 parameter space compared to the $9.4 < z < 11.3$5–9 PRIMAL sample.
Examining the redshift evolution, the EW measurements at $9.4 < z < 11.3$6–11.3 are fully consistent with the plateau observed at $9.4 < z < 11.3$7, contradicting theoretical expectations of either a rapid increase or systematic decline in nebular line strengths beyond $9.4 < z < 11.3$8.
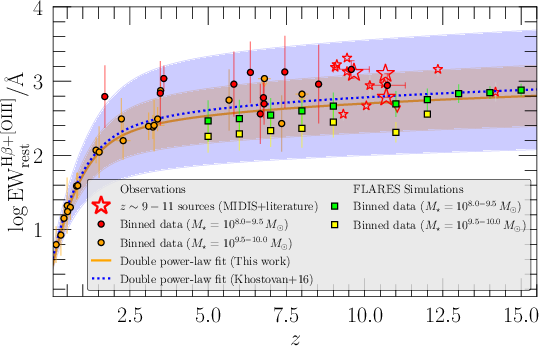
Figure 6: EW vs. redshift for star-forming galaxies, highlighting the MIDIS sample at $9.4 < z < 11.3$9–11.3 in the context of literature values and evolutionary fits.
Nebular Line Luminosity Function and Implications for Galaxy Evolution
By calculating the luminosity function via the z0 method, the space density of strong Hβ+[O III] emitters at z1–11.3 is estimated as z2 Mpcz3 dexz4 at z5 (erg sz6). This measurement is consistent with a decline relative to lower-z7 determinations by the FRESCO/COSMOS-3D and GLIMPSE surveys.
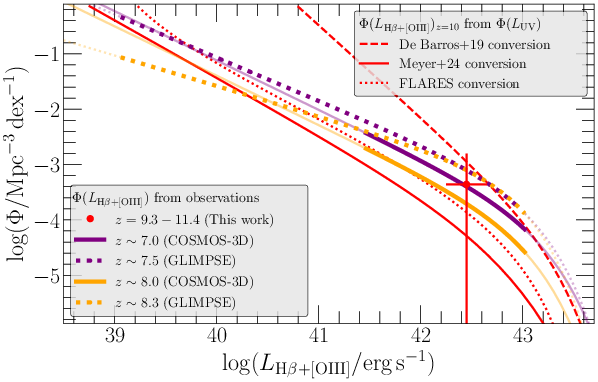
Figure 7: Hβ+[O III] luminosity function at z8–11.3, compared to z9–8 spectroscopic luminosity functions.
Cross-calibration with the UV luminosity function at MUV∼−19.20 confirms that assumptions regarding the MUV∼−19.21 mapping are critical: the MIDIS sample represents the high line-to-continuum tail, exceeding the population average in other deep JWST fields.
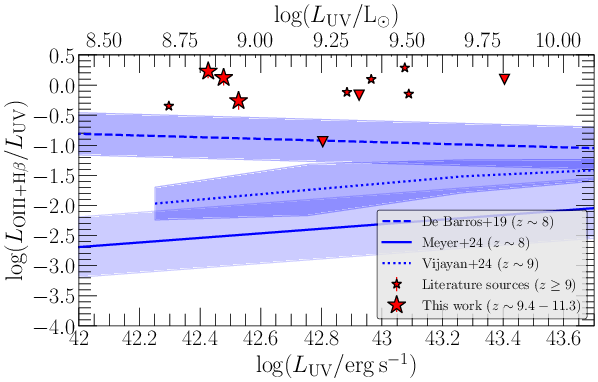
Figure 8: Hβ+[O III] to UV luminosity ratio as a function of MUV∼−19.22 for the MIDIS and literature MUV∼−19.23 sample, compared to empirical and simulated scaling relations.
Ionizing Photon Production Efficiency and Scaling Relations
Inferred MUV∼−19.24 for the MIDIS sample spans 25.1–25.4 Hz ergMUV∼−19.25, within the upper envelope established at MUV∼−19.26–9 and consistent with MUV∼−19.27 literature sources. This is sufficient to support models where galaxies reionize the early universe without invoking exotic stellar populations.
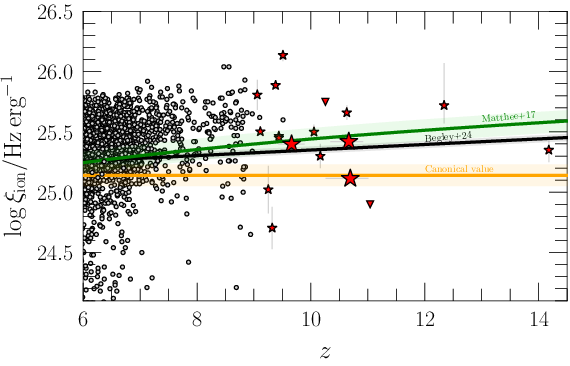
Figure 9: The ionizing photon production efficiency, MUV∼−19.28, as a function of redshift compared with literature samples and canonical MUV∼−19.29 values.
Statistically significant correlation is found between −19.40 and both EW and UV slope −19.41 at −19.42, mirroring established scaling relations at lower redshift. No significant correlation is seen with −19.43, indicating that EW and −19.44 are more fundamental predictors of −19.45 in nascent galaxies.
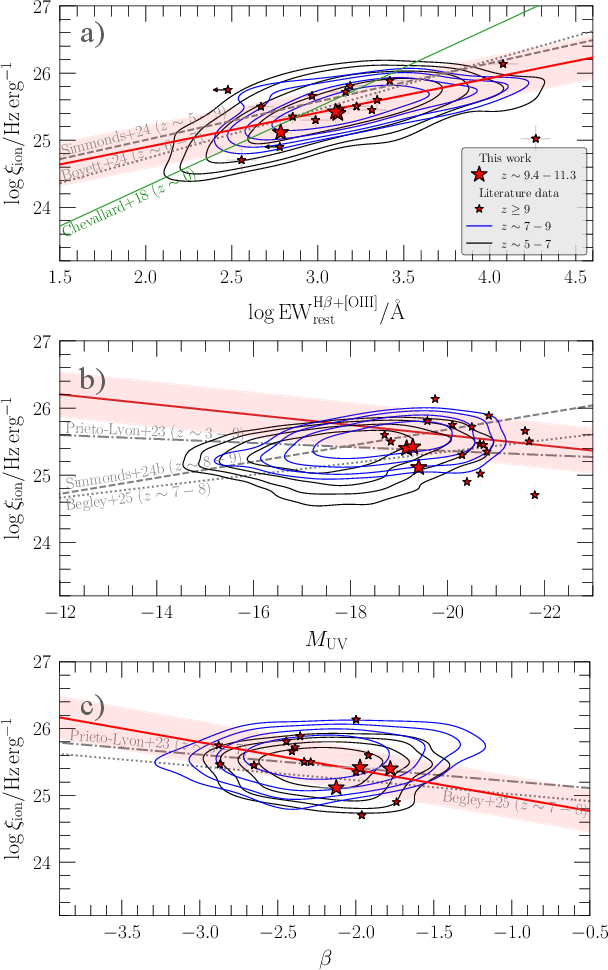
Figure 10: Scaling relations of −19.46 with Hβ+[O III] EW, −19.47, and UV continuum slope −19.48 at high redshift, including MIDIS and literature samples.
Theoretical Implications and Future Directions
These results support the continuation of established trends in nebular excitation and ionizing efficiency to −19.49, suggesting early assembly of the ISM conditions and stellar properties seen in later, logM⋆/M⊙∼8.00–9, extreme emission line galaxies. MIDIS findings challenge predictions of either a marked increase or significant drop in integrated nebular EWs at the onset of reionization, instead favoring a scenario in which both the ionizing photon budget and the connection between line emission and continuum properties are essentially in place within logM⋆/M⊙∼8.01500 Myr of the Big Bang.
The existence of UV-faint, high-EW systems boosts the argument that low-mass galaxies are efficient reionization sources. The lack of an obvious anti-correlation between EW and mass, as well as the persistent high median EWs, points towards bursty SFHs and rapid assembly of low-metallicity, high-logM⋆/M⊙∼8.02 ionized regions, consistent with both fine-structure line observations and recent cosmological simulations.
Conclusion
The MIDIS survey provides robust evidence that strong Hβ+[O III] line emission is prevalent among galaxies at logM⋆/M⊙∼8.03–11.3, with typical physical and spectrophotometric properties extending the trends observed at logM⋆/M⊙∼8.04–9. The measured Hβ+[O III] equivalent widths, their distribution, and the derived luminosity function directly constrain models of early star formation, chemical enrichment, and the photon budget for reionization, demonstrating that the physical mechanisms controlling nebular emission and its coupling to continuum and ionizing properties are well established in early galaxy populations. These results set the stage for future deep surveys and spectroscopic follow-up with JWST and next-generation facilities, targeting the emergent population of extreme emission-line galaxies within the first logM⋆/M⊙∼8.05400 Myr after cosmic dawn.