- The paper introduces a novel location-invariant flexibility potential (LI-FP) metric validated on a real 95-bus MV grid to quantify system-wide flexibility under DSR.
- The methodology employs AC power flow constraints and boundary sampling via parametric optimizations (AC-Flex-Max/Min) to construct nodal and aggregated flexibility sets.
- Empirical results show that optimal DSR increases the normalized PQ flexibility area by up to 173%, highlighting significant operational improvements.
Location-Invariant Flexibility Potential Assessment in Radial Distribution Grids
Introduction
As the penetration of decentralized and variable renewable energy sources (RES) escalates, distribution system operators (DSOs) face increasing demands for operational flexibility to maintain grid security, stability, and efficient utilization of assets. The primary flexibility metric, typically quantified by PQ capability curves (representing feasible active and reactive power provision at nodal or aggregate levels), is highly sensitive to grid topology. Distribution system reconfiguration (DSR) enables DSOs to optimize the network's operational structure via switching actions, inducing additional degrees of freedom that are not generally considered in standard flexibility analyses.
This paper introduces a rigorous framework for assessing flexibility under DSR, leveraging AC power flow constraints and explicitly enforcing radial operation, which reflects practical distribution system requirements. A novel location-invariant flexibility potential (LI-FP) metric is proposed to quantify spatially aggregated flexibility irrespective of the provider’s nodal location within the aggregation region. The methodology is validated on a real 95-bus medium voltage (MV) test system, demonstrating that DSR can drive substantial amplification in system and regional flexibility. The approach offers a transparent evaluation tool for system operators, facilitating enhanced procurement and coordination of flexibility services.
Methodological Framework
The methodology is based on a detailed AC power flow model capturing all relevant device limits and network operational constraints, including voltage, thermal, and power flow limits at each bus and branch. Flexibility at a bus—nodal flexibility potential (NFP)—is encoded as the maximal feasible set of (P,Q) injections admissible at that node, defined by the boundary of the feasible set under all system and device constraints. Boundary sampling is performed via a set of parametric optimizations (AC-Flex-Max and AC-Flex-Min) for various power factor angles, yielding a polygonal approximation of the NFP.
To capture flexibility at arbitrary aggregations, the location-invariant flexibility potential (LI-FP) F^V is constructed as the intersection of NFPs across all considered buses in region V. This intersection quantifies the minimal simultaneous flexibility available at all nodes in V, providing a robust measure for operational planning, ancillary service provision, or market-based flexibility products.
Computational Procedures and DSR
The assessment procedure solves IV AC-constrained non-linear programs (NLPs) for each region of interest, where I is the number of power factor samples and V the number of buses in the region. The combinatorial explosion of possible topologies under DSR is tackled using scalable heuristics and exhaustive methods previously validated for practical network topologies [Hinneck2024], [Hinneck2025]. Each resulting topology is evaluated for its influence on NFP and LI-FP.
Visualization and Interpretation
The boundaries of the region-level and nodal flexibility sets are visualized in the PQ plane, allowing direct comparison of operational flexibility unlocked under different topologies. The methodology reveals not only aggregate gains but also the spatial distribution and trade-offs inherent in topology changes.



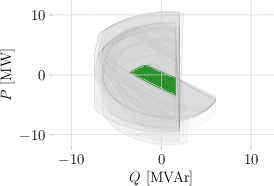
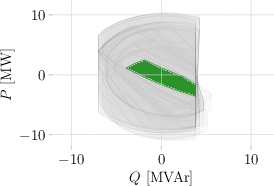
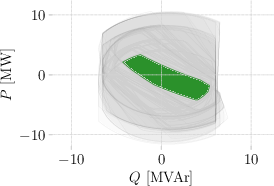
Figure 1: Example of an unfavorable topology in the distribution grid, showing the connectivity that limits flexibility.
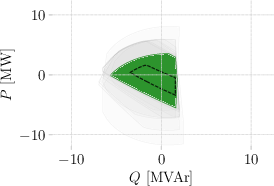
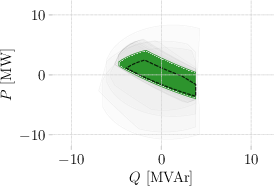
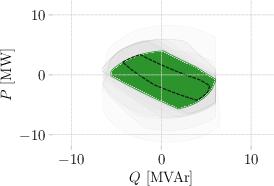
Figure 2: Another example of an unfavorable topology, highlighting network sections prone to constraints under high RES infeed.
Empirical Results
Case Study: 95-Bus MV Distribution System
The framework is applied to a realistic MV network (SimBench dataset, 20 kV base voltage, 17.26 MW load, 25.57 MW RES generation), operated radially with open ring structures typical of German distribution systems. Three distinct topologies are considered: an unfavorable heuristic-based topology, the test case baseline, and an optimal topology identified using combinatorial DSR optimization [Hinneck2024], [Hinneck2025].
PQ capability regions are computed for the entire system and representative subregions. Figures below illustrate both the topological context and the corresponding flexibility sets.
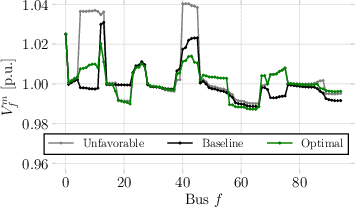
Figure 3: Location-invariant hosting capacity (LI-FP) for various nominal topologies, highlighting differing system-wide PQ capability regions.
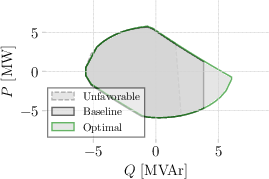
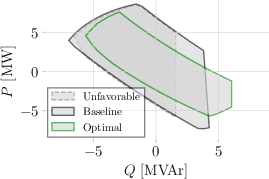
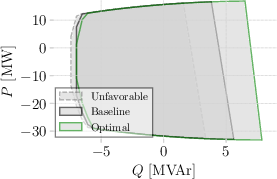
Figure 4: Nodal flexibility potential set (NFP) at Bus 25 under different topologies.
Topological changes yield dramatic differences in overall flexibility:
- The optimal topology increases the normalized PQ flexibility area by 173% compared to the worst-case and 66% over the baseline.
- Unfavorable topologies quickly exhaust voltage upper limits due to localized RES surges, cutting off capacitive provision at various buses. Topological balancing via DSR flattens voltage profiles and relieves such bottlenecks.
Systematic aggregation enables flexibility assessment for arbitrary network regions.
Nodal Sensitivity and Trade-offs
Spatial flexibility is highly non-uniform and sensitive to topological control. The empirical analysis uncovers several key effects:
- Local vs. System Flexibility Trade-off: A topology that is optimal for system-wide flexibility may constrict local flexibility at certain buses, revealing fundamental trade-offs inherent to DSR-driven flexibility maximization.
- Edge Effects: At interface buses (e.g., HV/MV substations), reconfiguration can substantially enhance available flexibility for ancillary service provision up to the transmission system.
- Regionalization: By restricting V to a subregion (e.g., a single open ring), LI-FP increases, as it is the intersection over fewer, more similar nodes. This hierarchy is preserved under aggregation.
Implications and Future Research
The presented methodology provides system operators with a powerful tool for real-time, spatially resolved flexibility monitoring under operational switching actions. It enables transparent quantification of minimum region-wide flexibility available for markets, redispatch, or emergency control, even across distinct voltage levels.
Key implications include:
- Operational Coordination: DSOs can proactively manage network flexibility via DSR, ensuring robust capability to provide ancillary services to TSOs in multi-level coordination schemes.
- Market Integration: Location-invariant flexibility metrics facilitate the design of flexibility markets and supports spatial aggregation in market clearing, providing secure lower bounds for contracted flexibility.
- Computational Tractability: Further research is encouraged on model reduction, sampling optimization, and parallelization to improve runtime for large-scale or highly meshed networks.
- Extension to Non-Radial/Contingency Operation: While the present method enforces radiality, adaptation to meshed, looped, or contingent operational states remains an open technical avenue.
Conclusion
The paper establishes a rigorous, AC-constrained framework for assessing the impact of DSR on both nodal and location-invariant flexibility potential in practical MV distribution grids. The introduction of the LI-FP metric enables region-wide, location-agnostic quantification of operational flexibility, with explicit sensitivity to grid topology and switching actions. Numerical results validate strong system-wide flexibility improvements through DSR, but also elucidate spatial and regional trade-offs that emerge in complex distribution systems.
The framework not only improves transparency in assessing and coordinating flexibility provision across voltage levels but also sets the stage for future integration with market-based mechanisms and advanced grid automation strategies.