Modeling within-department homogeneity in research quality rankings: an application to the Italian ISPD
Published 3 Apr 2026 in stat.ME | (2604.03073v1)
Abstract: In this paper, we consider the academic department ranking system of Italy, which is based on a performance index named Indice Standardizzato di Performance Dipartimentale (ISPD). While critiques to the ISPD have been moved for its marked tendency to polarization, we here formalize a yet unexplored determinant of this phenomenon, that is, the presence of within-department homogeneity among the standardized scores used to build the index. We account for this intra-departmental correlation by modeling it as a function of departments' size. The proposed model, estimated via Maximum Likelihood, allows to build a fairer ranking procedure via the definition of a properly adjusted version of the ISPD. The estimation framework is also adapted to fit publicly available data, which are coarsened by rounding and/or left-truncated. To this end, a novel probability distribution termed Betoidal is introduced. Empirical evidence in favor of the proposed model is found in the 2017 and 2022 data. Moreover, a simulation study shows that the adjusted index significantly overcomes not only the original ISPD, but also other more data-demanding competing proposals.
The paper introduces a model that adjusts Italian ISPD rankings by accounting for intra-department score correlation.
It employs the novel Betoidal distribution for likelihood-based parameter estimation under data coarsening and truncation.
Simulations demonstrate that the proposed adjustment mitigates ranking polarization and improves inter-department comparability.
Modeling Within-Department Homogeneity in Research Quality Rankings: Analysis and Implications for the Italian ISPD
Introduction
The paper "Modeling within-department homogeneity in research quality rankings: an application to the Italian ISPD" (2604.03073) examines the statistical underpinnings of the Indice Standardizzato di Performance Dipartimentale (ISPD), the metric central to Italian university department research rankings administered by ANVUR. It addresses a critical and previously unformalized determinant of ranking polarization: intra-department homogeneity in standardized research scores, which introduces dependency among department-submitted outputs. The work formalizes this intra-departmental correlation, models its dependency on department size, and demonstrates how neglecting this structure in current ISPD computations leads to pronounced polarization and reduced discriminatory power. A new probability distribution, the Betoidal, is introduced for parameter estimation in the presence of data coarsening and truncation.
Statistical Limitations of the Current ISPD and the Role of Correlation
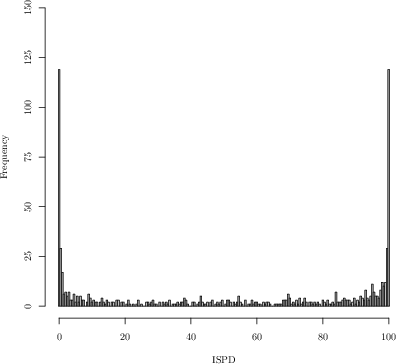
The current ISPD formulation is predicated on independence among the standardized scores contributing to each department's index, justified via the Central Limit Theorem (CLT) for large sample sizes. The index aims to normalize for department size by using a scaled average and then ranks departments based on the cumulative distribution function (CDF) transformation. However, empirical analysis of the 2017 and 2022 rankings reveals extreme polarization: large numbers of departments obtain either the minimum or maximum possible ISPD.
Figure 1: Distributions of ISPDs from the 2017 exercise (full distribution) and 2022 (upper tail), both exhibiting strong polarization.
This U-shaped distribution contradicts the expectation under the null hypothesis of independent scores, where the ISPD would follow a nearly uniform distribution. The paper formalizes that the violation stems from intra-department score correlations, which induce overdispersion in department-level means, especially as department size increases.
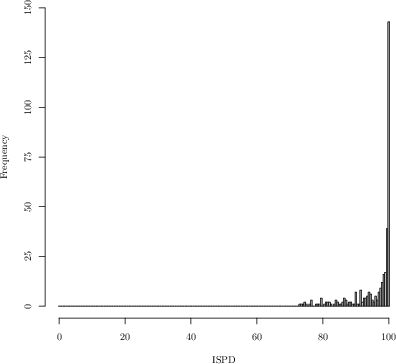
Further, the ISPD's correction for size is rendered ineffective in the presence of intra-department correlation, as the variance V(Z~d) grows with Nd when ρd>0. As a result, larger departments are statistically more likely to receive extreme ISPD values.
Figure 2: Illustration of two departments with identical scores but differing sizes, demonstrating the larger department's inflation of apparent extremeness under current ISPD calculations.
Model Specification: Intra-Departmental Correlation and ISPD Adjustment
To restore comparability and fairness, the authors propose an analytical adjustment for the ISPD. Letting ρd denote average pairwise intra-departmental correlation, they redefine the ISPD by normalizing each department’s scaled average by the correct, correlation-adjusted standard deviation:
ISPDdadj=⌊200⋅Φ(z~d/σd)+0.5⌋/2
where σd=1+ρd(Nd−1).
The intra-departmental correlation is itself modeled as a function of department size Nd via a monotonic transformation reminiscent of the Fisher z-transform,
log1−ρd1+N~ρd=α+β(Nd−1).
Here, β<0 ensures decreasing correlation with increasing department size, consistent with theoretical expectations.
Likelihood-Based Estimation and the Betoidal Distribution
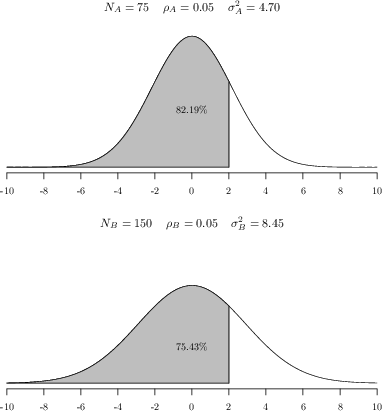
Direct estimation of department-specific correlations from microdata may not be feasible when only ISPDs are available. The authors introduce the Betoidal distribution, defined as the distribution of X=Φ(Z~d) where Nd0. The Betoidal has the same mean and median (0.5) as the uniform, but becomes U-shaped for Nd1, precisely matching the empirical distribution observed in ISPDs under correlation.
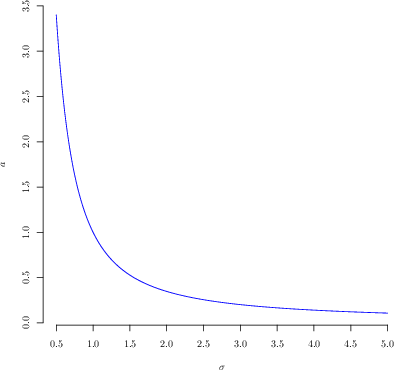
Figure 3: (a) Betoidal densities for several Nd2 values, depicting transition from bell-shaped to U-shaped; (b) mapping between Betoidal parameter Nd3 and the BetaNd4 distribution parameter Nd5 for variance matching.
The Betoidal serves as the parametric family for the maximization of the likelihood (and its left-truncated counterpart for the 2022 top-350-only case), allowing estimation of correlation model parameters Nd6 from departmental ISPDs alone, even under rounding and truncation.
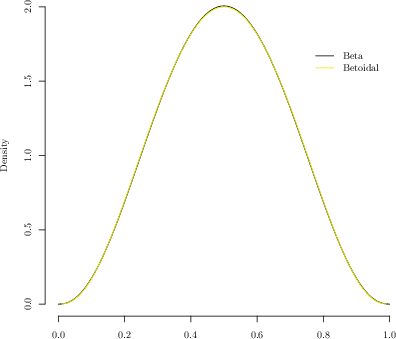
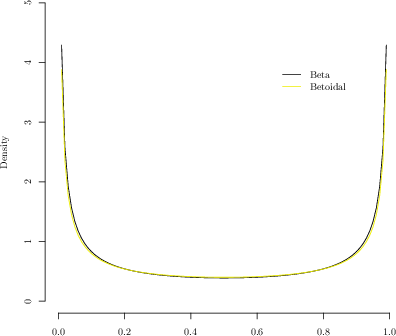
Figure 4: Side-by-side comparison of fitted Betoidal and Beta densities, highlighting near-indistinguishability with matched variance.
The empirical fit finds strong evidence for Nd7. The likelihood ratio tests decisively reject both the hypothesis of no correlation and the hypothesis of uniform intra-departmental correlation in favor of the size-dependent model, in both 2017 and 2022 datasets.
Simulation Study and Comparative Performance
Model-driven simulations, calibrated from 2017 data, demonstrate that the model-based ISPD adjustment eliminates artificial polarization, restoring the discriminatory capability of the index.
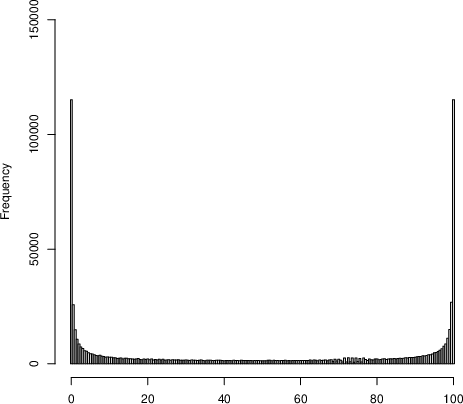
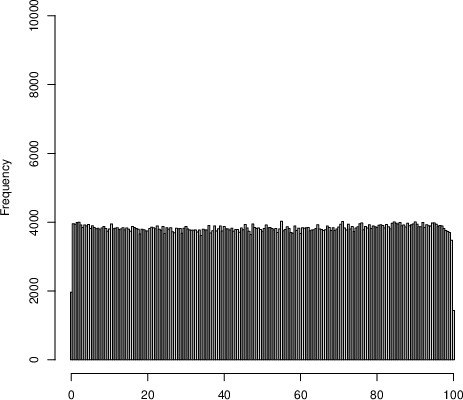
Figure 5: Empirical histograms of simulated original ISPD and FCM-adjusted ISPD, confirming the near-uniformity of the latter and the mitigation of polarization.
The mean absolute deviation (MAD) and percentage of discordant comparisons (PDC) versus the ground-truth ISPD (computed with true, known correlation) are substantially reduced for the proposed model-based adjustment compared to both the official ANVUR procedure and alternatives relying on empirical or random-intercept-based correction. This superiority is maintained under various scenarios of model perturbation.
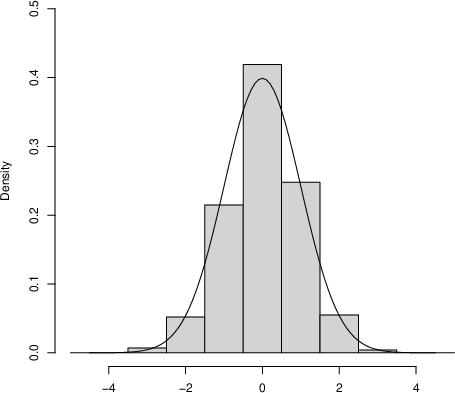
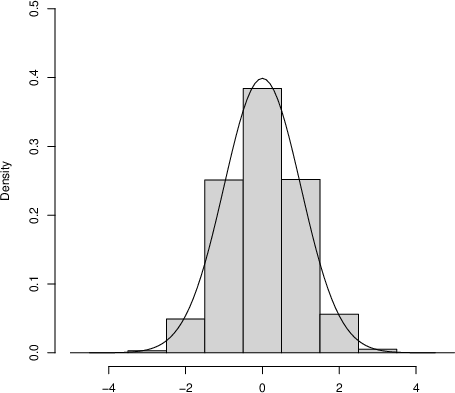
Simulations further confirm that normalization of scaled averages by the correct, size-dependent standard deviation ensures appropriate inter-departmental comparability, regardless of department size.
Figure 6: Empirical distributions of size-standardized averages for minimum and maximum-size departments, both closely matching the theoretical Normal.
Broader Implications and Prospective Directions
The findings demonstrate that intra-departmental score correlation, if neglected, invalidates the probabilistic rationale of ISPD-based rankings and introduces explicit size-dependent distortions into funding-related performance metrics. This has direct distributive consequences, as "ties" and extreme outcomes are not reflective of underlying departmental performance but of statistical artifact.
Practically, the publication of only macro-level ISPDs does not preclude adequate estimation of the required parameters for proper adjustment, due to the sufficiency of the Betoidal model. Theoretically, the approach refines the use of order statistics in large-scale institutional evaluation, accounting for complex dependency structures with minimal parametric imposition.
The introduction of the Betoidal distribution adds a useful technical tool for dealing with transformations of correlated Gaussian aggregates, with potential applications in educational testing, econometrics, and any setting where performance indicators are computed on coarsened or rank-based transformations.
Conclusion
This study exposes a critical statistical limitation of the Italian ISPD ranking protocol, formalizes the cause of extreme polarization as intra-departmental correlation, and provides a maximum-likelihood-based correction that restores interpretability and fairness across departments of widely varying sizes. The adoption of the Betoidal family enables practical adjustments using only publicly available, coarsened ISPD values. The approach outlined is readily extensible to other countries and evaluation frameworks, with direct relevance for the construction of fair, accountable performance-based research funding systems. If unaddressed, the issues highlighted have the potential to distort resource allocation and undermine the legitimacy of national research assessment protocols. Future developments may integrate longitudinal dynamics, evolving evaluation rules, or further generalize the dependency structure to include cross-departmental or hierarchical effects.
“Emergent Mind helps me see which AI papers have caught fire online.”
Philip
Creator, AI Explained on YouTube
Sign up for free to explore the frontiers of research
Discover trending papers, chat with arXiv, and track the latest research shaping the future of science and technology.Discover trending papers, chat with arXiv, and more.