- The paper demonstrates that global solar flare waiting times, integrating near- and far-side events, yield a steep power-law tail (α > 3) that challenges conventional models.
- It employs maximum-likelihood estimation and rigorous statistical model selection to compare multiple probability density functions for capturing flare timing behavior.
- The findings reveal marked temporal clustering and memory effects in active regions, suggesting that interconnected magnetic processes modulate flare occurrences.
Waiting Time Distributions of Solar Flares: New Insights from Global Observations
Introduction
The statistics of waiting times between solar flares—the so-called waiting time distribution (WTD)—constitute an essential diagnostic for underlying physical mechanisms governing solar activity, including the balance of self-organized criticality (SOC), memory effects, nonstationary Poisson processes, and magnetohydrodynamic (MHD) turbulence. However, previous analyses were fundamentally limited by incomplete sampling, as near-Earth platforms cannot observe far-side flares. This work leverages coordinated Geostationary Operational Environmental Satellite (GOES) and Solar Orbiter (SolO/STIX) observations during April–June 2024, enabling almost-complete temporal and spatial coverage, including one of the most flare-productive super active regions (SARs) in recent history: NOAA SAR 13664/13697. This study delivers a comprehensive determination of WTDs for both individual active regions (ARs) and the entire solar globe, employing rigorous statistical model selection and highlighting the consequences of a genuinely global flare view.
Comprehensive Data Acquisition and Region Characterization
The observational campaign captured 2,044 C-class-and-above flares globally, with 741 events attributable to SAR 13664/13697—a region ranked above the 99.9th percentile by magnetic area and complexity metrics. The study robustly delineates region identities, excludes cross-instrument duplication, and ensures spatial association by tracing flares with GOES/Stix data and Carrington maps. The coverage interval ensures that the majority of the solar disk was visible to at least one vantage, minimizing the impact of unobservable intervals.
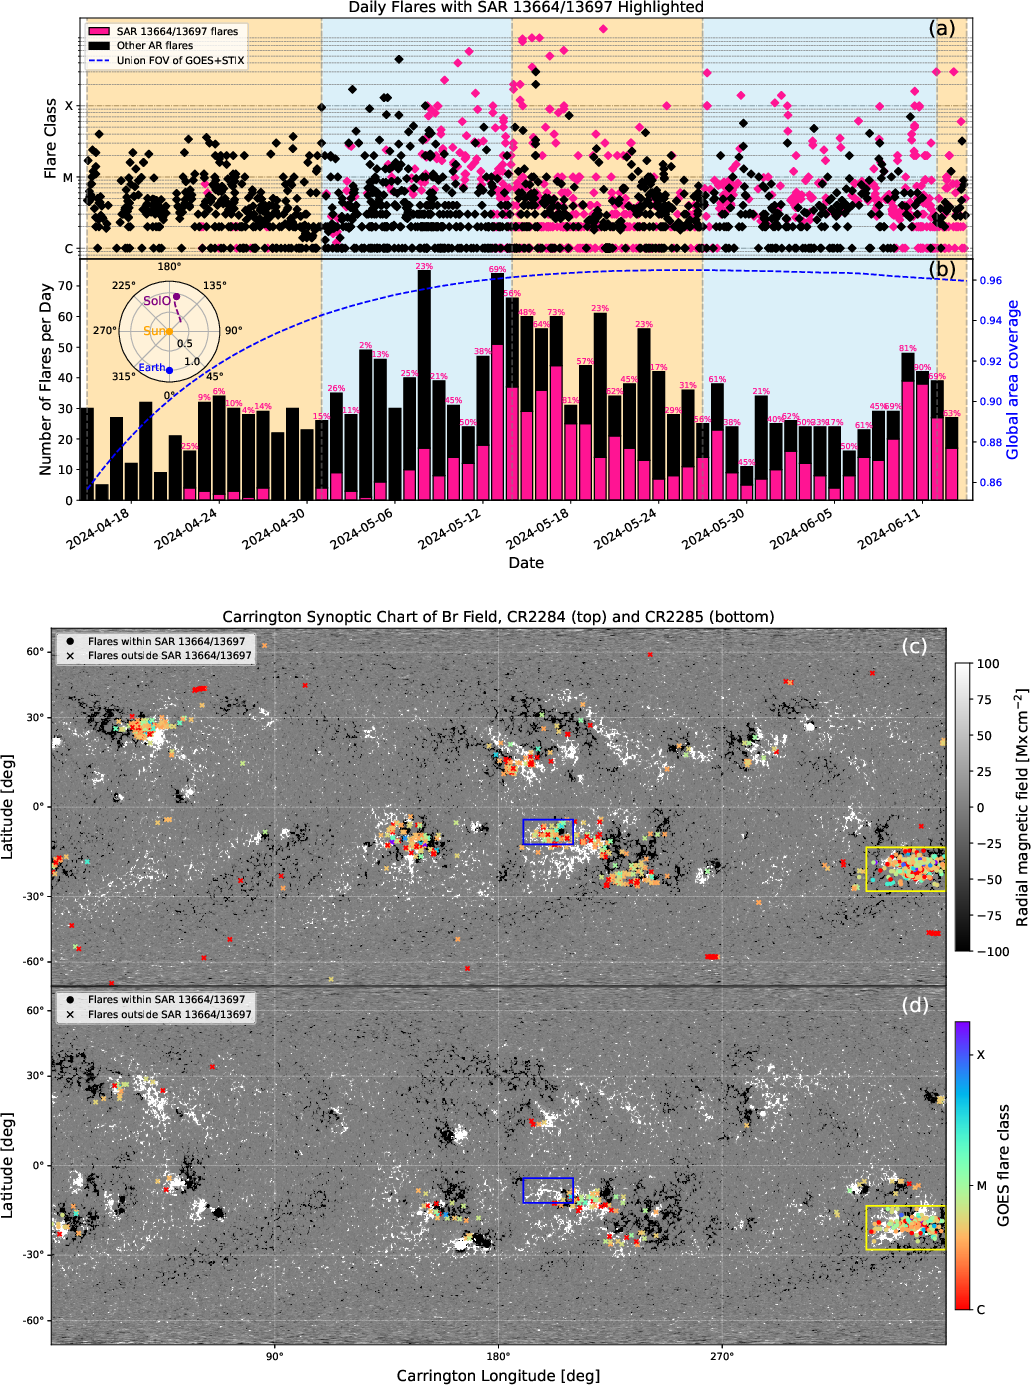
Figure 1: Temporal and spatial distribution of global flares during the lifetime of SAR 13664/13697, including observational coverage and active region tracking.
Methodological Framework: Multi-Model Inference on WTDs
Flare waiting times are defined as peak-to-peak intervals, eschewing alternative definitions that incur pile-up or duration-based contamination. WTDs are then systematically fitted using maximum-likelihood estimation (MLE) to four key PDFs: exponential (stationary Poisson), log-normal, power-law (tail), modified power-law (body+tail), and the e-function (a stable, memory-influenced process). Model selection employs Kolmogorov-Smirnov (KS) goodness-of-fit and is further discriminated by information-theoretic criteria (Akaike, corrected Akaike, Bayesian Information Criteria), augmented by log-likelihood ratio testing. To interrogate the independence hypothesis, the H-statistic is applied, reflecting temporal aggregation (clustering) or regularity.
Results: Regional Versus Global Flare Dynamics
Regional AR Results
WTDs for SAR 13664/13697 manifest unique statistical signatures compared to typical ARs. The tail segment (long waiting times; x>xmin) is well-described by a power-law (α≈2.6), supported over alternatives by information criteria. The overall profile deviates from traditional power-laws, instead favoring a log-normal law, in direct contrast to typical ARs (e.g., AR 13679/13711), for which the e-function outperforms all alternatives throughout the distribution. The tail indices (α<3) are consistent with expected SOC, nonstationary Poisson, and turbulence theory predictions.
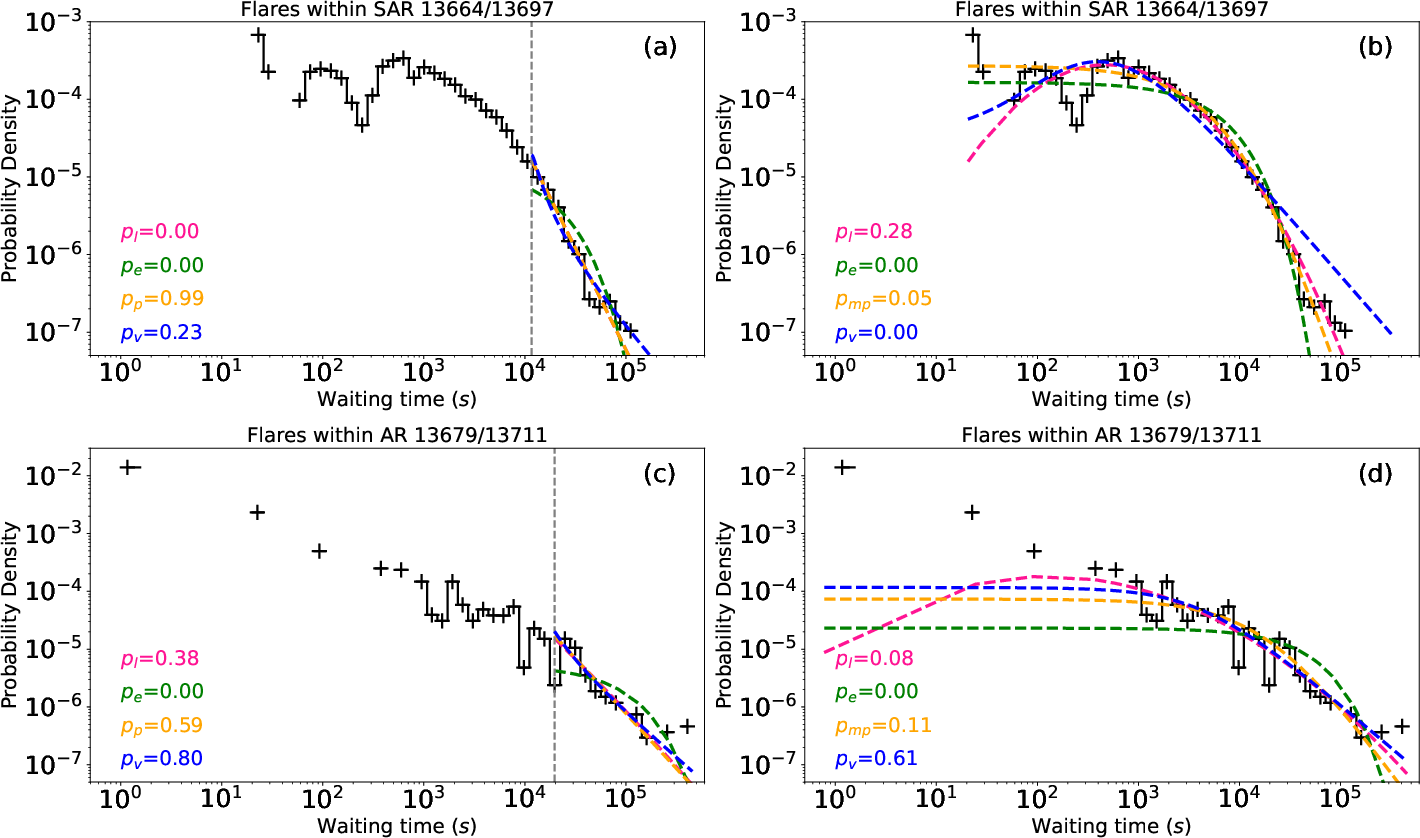
Figure 2: Waiting time distributions for individual ARs: SAR 13664/13697 reveals a log-normal body and power-law tail, whereas AR 13679/13711 aligns with the e-function.
Global Flare Ensemble
The global WTD, when integrating both near- and far-side events, fails to be adequately described by any of the four canonical distributions over its entire profile—an indicator of the composite and multi-process nature of global flaring. Critically, the power-law tail for the global distribution is significantly steeper than theoretical bounds (α>3), indicating a drastic suppression of long intervals and an enhancement of short intervals relative to SOC and nonstationary Poisson predictions.
When SAR flares are excluded, the tail exponent flattens (α≈3), approaching the theoretical maximum, but remains inconsistent with a stationary Poisson process. Notably, when restricting the data to M-class-and-above flares or C-class events only, the global WTD shows consistent heavy-tailed features, but the overall profile consistently rejects all candidate fits under KS testing.
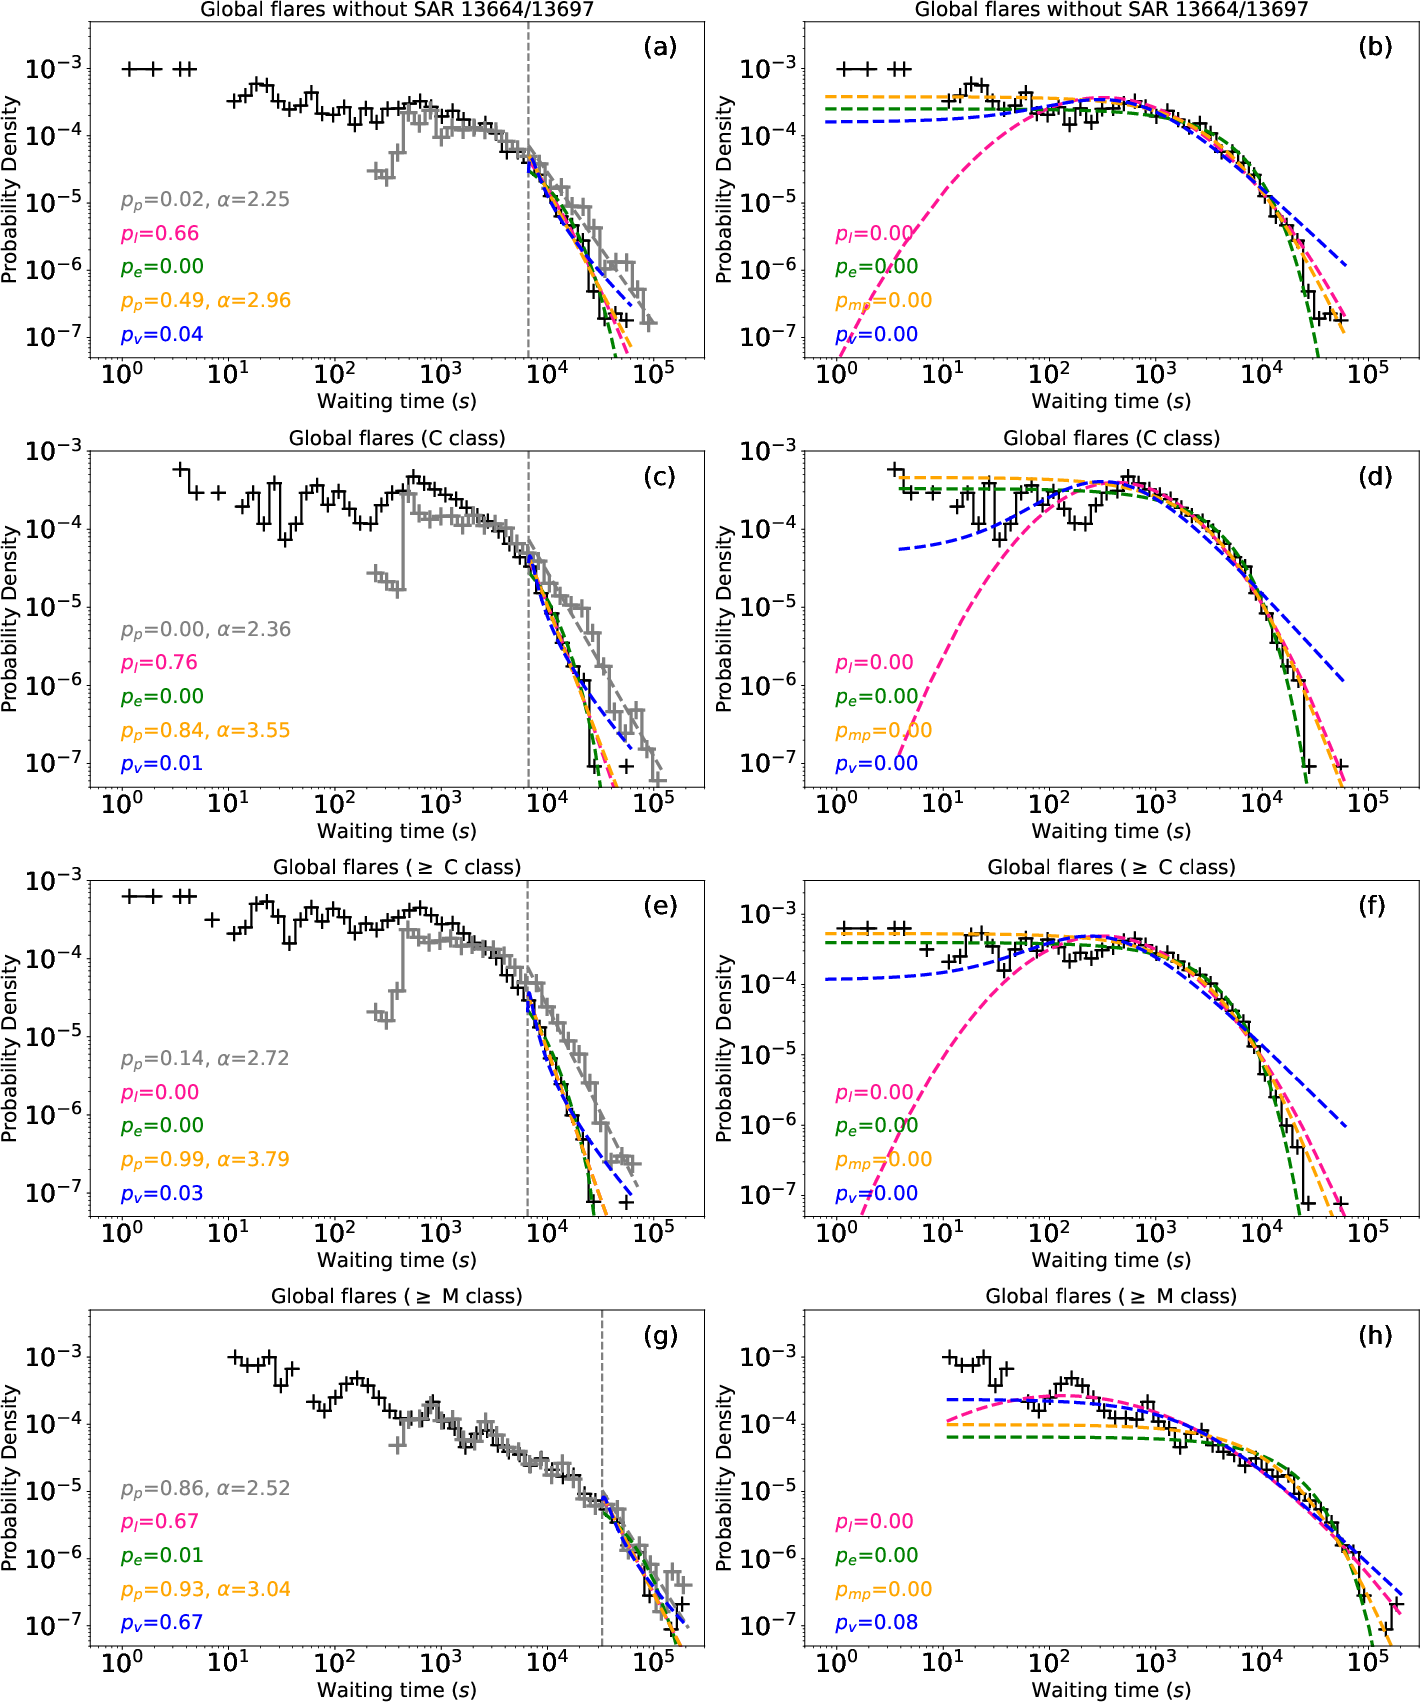
Figure 3: WTDs for global flares; overlays and fits display key deviations from classic theoretical distributions, especially the steep tail (α>3) when including far-side coverage.
Departures from Poissonianity and Memory Effects
Testing the local Poisson hypothesis with H-statistics, global WTDs are inconsistent with independence, instead manifesting strong temporal clustering, except in high-magnitude subsets. In contrast, individual AR WTDs—including the super AR—are statistically compatible with Poissonianity within their shorter intervals, but display aggregation in the body, reflecting high local flare rate and possible duration overlap effects.
Theoretical and Practical Implications
These results call for a re-examination of SOC and nonstationary Poisson paradigms in the context of flare occurrence on the global Sun. The substantial steepening of the power-law tail (α>3) is not predicted by extant stochastic or avalanche models, nor by MHD turbulence theory, all of which typically yield 1.5<α<3. The inclusion of far-side events fragments long intervals, increasing the density of short waits and heavily suppressing long ones relative to single-hemisphere sampling. The inability to globally fit any standard PDF reflects that flare occurrence is fundamentally non-universal outside individual AR or magnitude classes, likely representing a complex superposition of region-scale processes with possible long-range coronal correlations.
The enhanced clustering and aggregation in SARs, quantified by elevated x>xmin0-statistics, also indicate possible contamination from duration overlap, or intrinsic memory induced by AR morphology and evolutionary status. These findings argue against memoryless, scale-agnostic models of solar activity operating globally, and suggest that temporal correlations—potentially modulated by magnetic connectivity across ARs—play an increased role as observational completeness is improved.
Conclusion
The incorporation of global solar coverage fundamentally alters the statistical landscape of flare WTDs. Individual ARs, especially superactive complexes, display distinct WTD profiles, with power-law tails but log-normal cores, and enhanced clustering. Globally, flare WTDs cannot be described by Poisson, SOC, or classical turbulence-based PDFs throughout; the observed tail steepening (x>xmin1), induced by inclusion of far-side flares, compels reevaluation of current theoretical mechanisms for flare triggering and temporal correlation. Practical implications extend to flare forecasting, where global event rates and clustering must be reparametrized in light of these findings, and to models of coronal energy release, where multi-scale and interconnected triggering must now be quantitatively incorporated.
Future work should systematically address the coupling between far-side visibility, flare magnitude, and clustering, while exploring whether nonlocal magnetic connectivity quantitatively ties AR activity to global flare statistics.
For methodological rigor and complete results, see "Waiting time distribution of solar flares from a global perspective" (2604.00877).

