- The paper introduces a novel district-embedded Neural ODE framework to reconstruct and forecast poverty indicators in Odisha.
- It combines GRU-based encoding with continuous latent dynamics and an adjoint sensitivity method to capture nonlinearities and heterogeneity.
- Empirical results show robust convergence with RMSE below 0.03, offering actionable insights for policy and socioeconomic analysis.
Neural Ordinary Differential Equations for Socioeconomic Dynamics: District-Embedded Modeling of Poverty Indicators in Odisha
Introduction
This study presents a technically rigorous approach to modeling the temporal evolution of key poverty-related indicators by leveraging Neural Ordinary Differential Equations (Neural ODEs) embedded with district-specific representations ("Neural Ordinary Differential Equations for Modeling Socio-Economic Dynamics" (2604.00632)). Socioeconomic systems such as poverty trajectories are governed by nonlinearities, delayed effects, heterogeneity, and exogenous shocks, which challenge both parametric econometric models and classic mechanistic ODEs. Conventional ML methods, while flexible, typically operate in discrete time and are limited in handling irregular sampling or extrapolation.
The Neural ODE framework generalizes residual neural networks by transitioning from discrete-layer transformations to continuous-time flows parameterized via neural networks. In this study, this paradigm is extended by integrating district embeddings, enabling the identification of structural heterogeneity and nuanced context effects. The supplied time series spans 30 districts in Odisha, India, and records six poverty-relevant indicators over three survey years (2007, 2015, 2020), normalized for continuous modeling. The combination of a GRU-based encoder, learned district embeddings, continuous latent dynamics, and a decoder allows for the reconstruction and forecasting of indicator trajectories, providing actionable projections for policy.
Methodological Framework
Model Structure
The architecture proceeds by (1) encoding the temporal sequence of indicators for each district with a GRU conditioned on learnable district embeddings, (2) initializing a latent state z0 for each district that is evolved in continuous time via an ODE where the vector field is parameterized by a multilayer perceptron and explicitly conditioned on district embeddings, and (3) reconstructing observed and unobserved indicator values via a district-aware decoder MLP with sigmoid output. This structure supports both reconstruction and forecasting at arbitrary future times and ensures that both short-term and long-term dependencies are modeled.
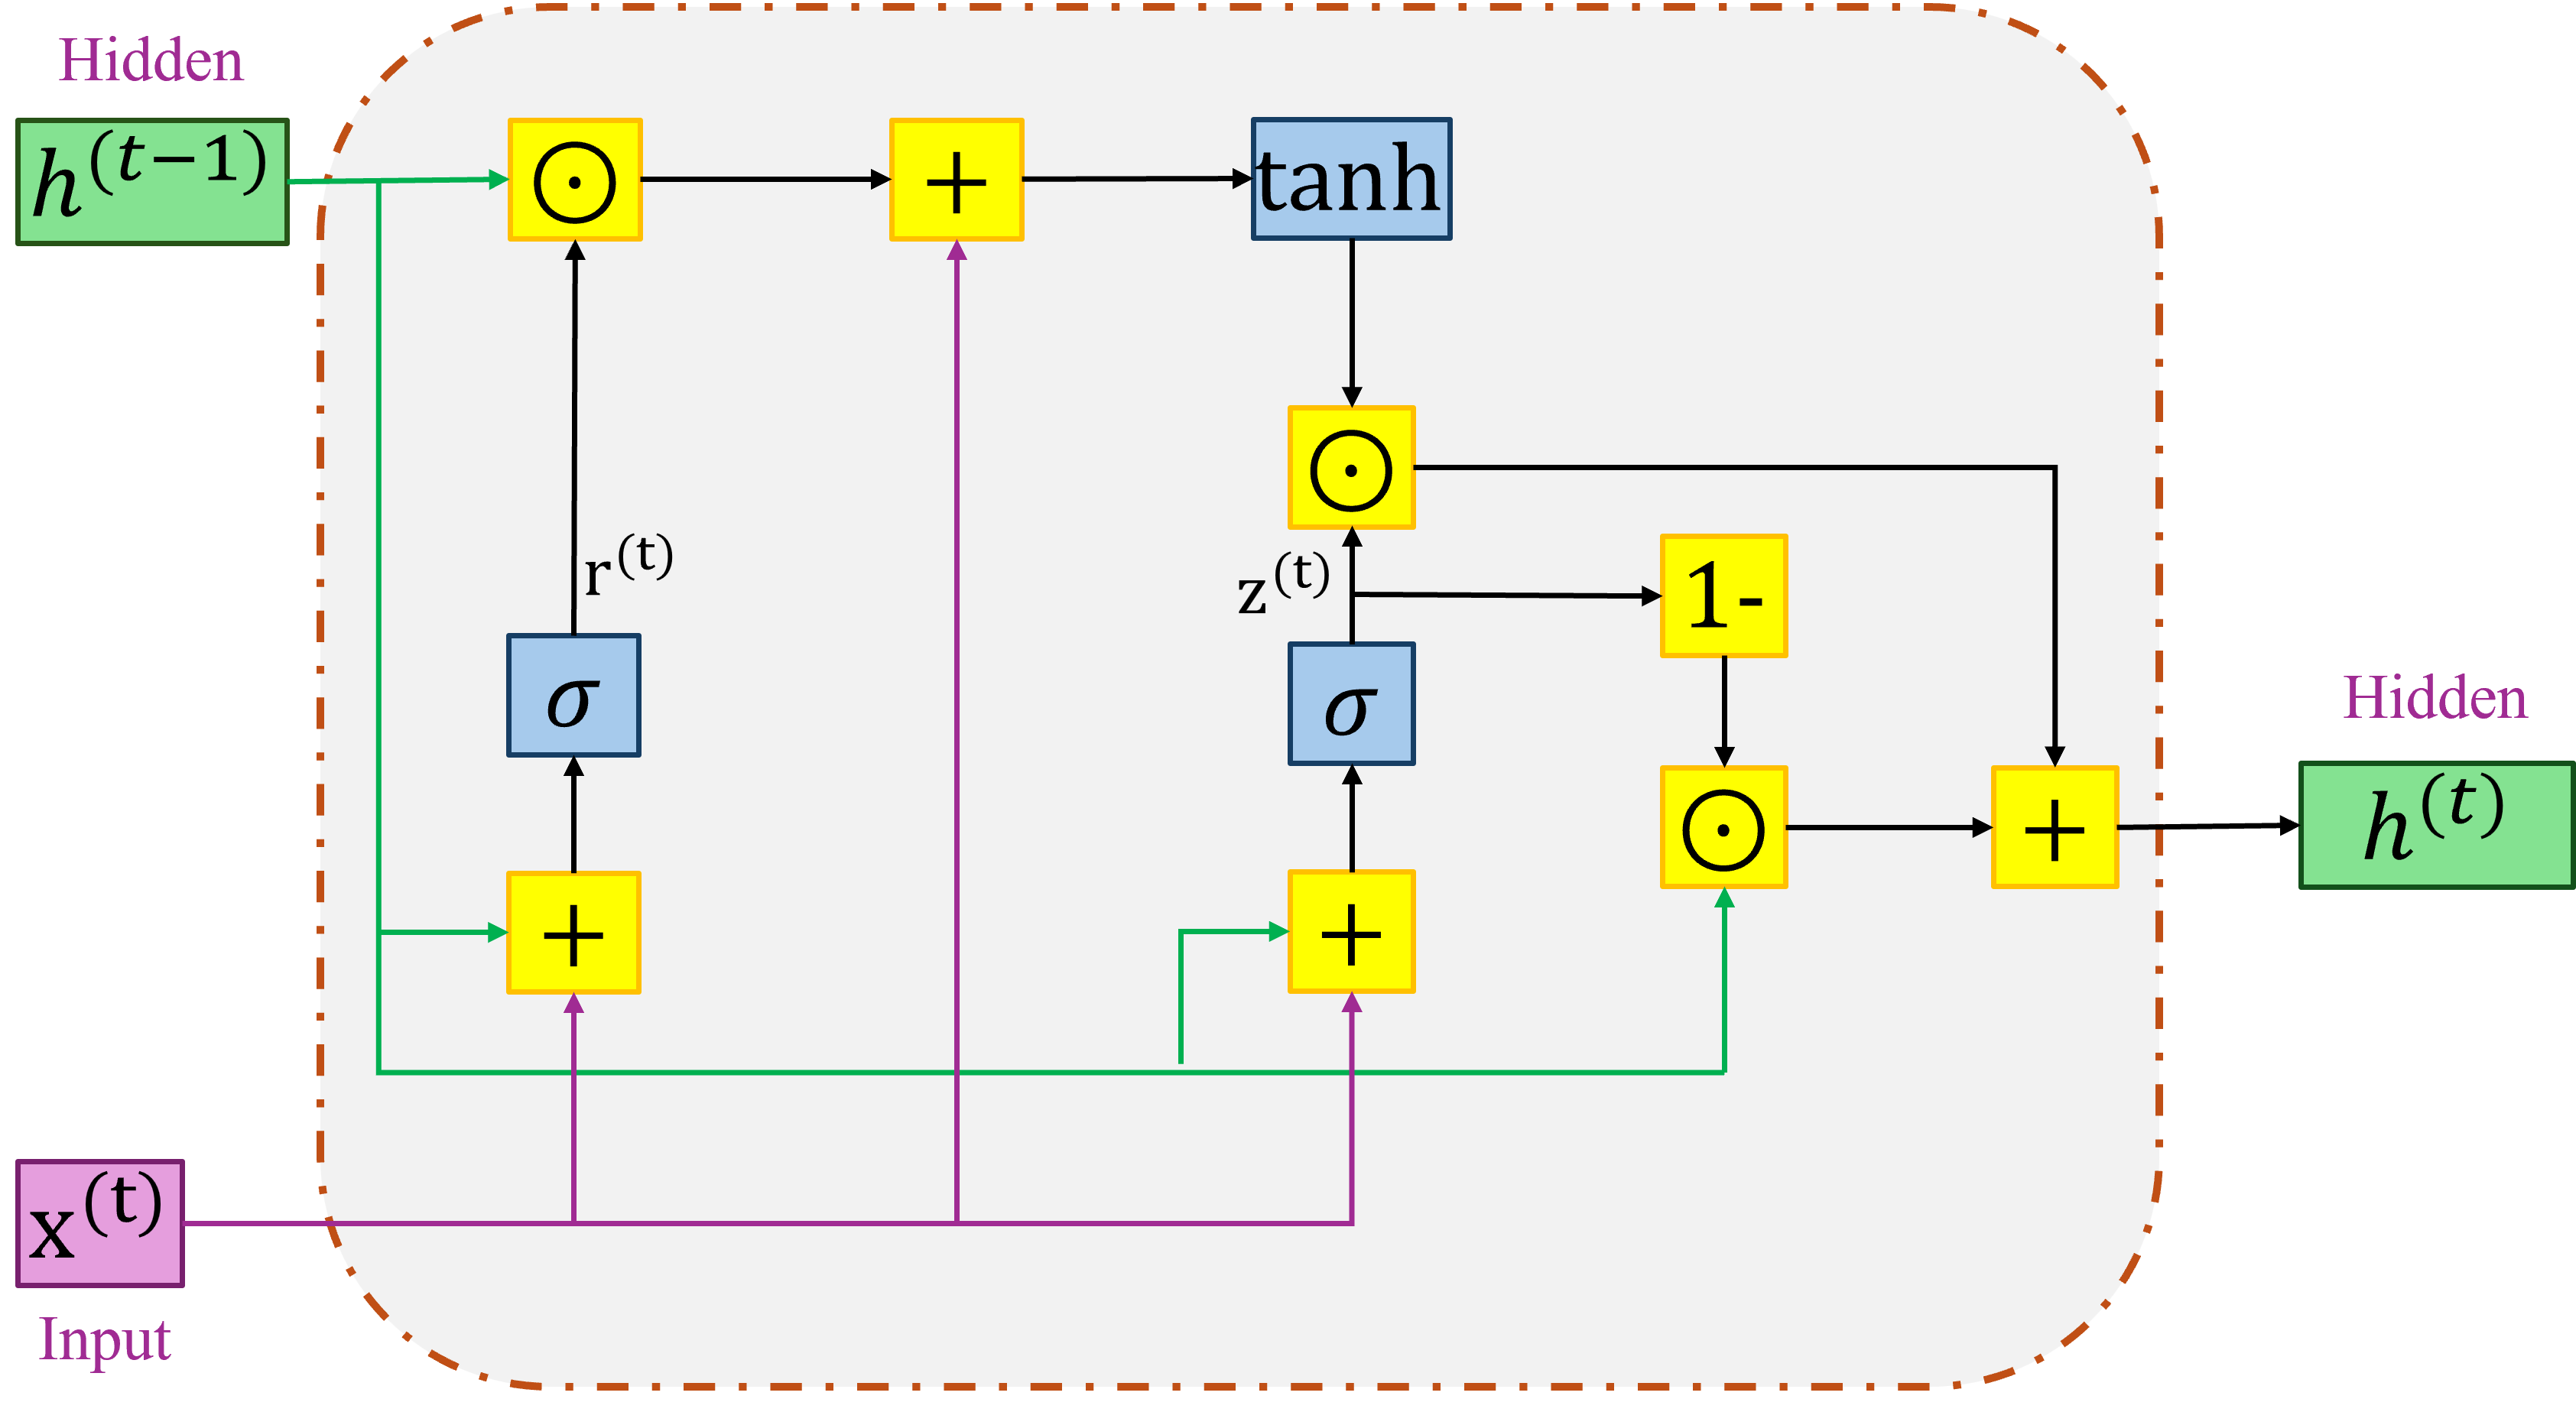
Figure 1: Schematic diagram of a GRU, showing the relationship between sequential input/hidden state and the gating mechanisms used in the encoder.
The continuous temporal flow is realized via a Dormand–Prince (order 5) adaptive-step ODE solver (dopri5), allowing dynamic control over precision and resolving both smooth and abrupt changes in indicator dynamics. The GRU's gating mechanisms are critical for summarizing both short- and long-run temporal dependencies from sparse survey inputs (Figure 1). District embeddings, learned end-to-end, are injected at every modeling layer.
Training Objective and Gradient Flow
Model fitting minimizes a dense mean squared error (MSE) loss over all available indicator observations. Critically, parameter gradients with respect to the ODE dynamics are computed using the adjoint sensitivity method rather than naive backpropagation through ODE solver operations. This reduces memory requirements from O(Nsteps) to O(1), a necessity for continuous-depth models.
The training protocol combines Adam optimization and cosine annealing learning rate scheduling, enforcing regularization via weight decay. Encoder and decoder parameters are updated with standard backpropagation; ODE parameter gradients are propagated via the augmented state backpropagation outlined in the adjoint formalism.
Data Structure
Inputs are structured as 3D tensors: districts × time points × indicators; targets are normalized for [0,1] support, aligning with the decoder's sigmoid constraint. The modeling horizon is constrained to 2007–2020 for fitting; forecasts are produced for extrapolated years through continuous integration.
Empirical Results
Model Convergence and Reconstruction Accuracy
Training proceeds stably, with the MSE loss (log scale) decreasing consistently over 1000 epochs and converging to a final RMSE of ~0.0219, evidencing that the model captures both cross-district and cross-indicator heterogeneity without overfitting.
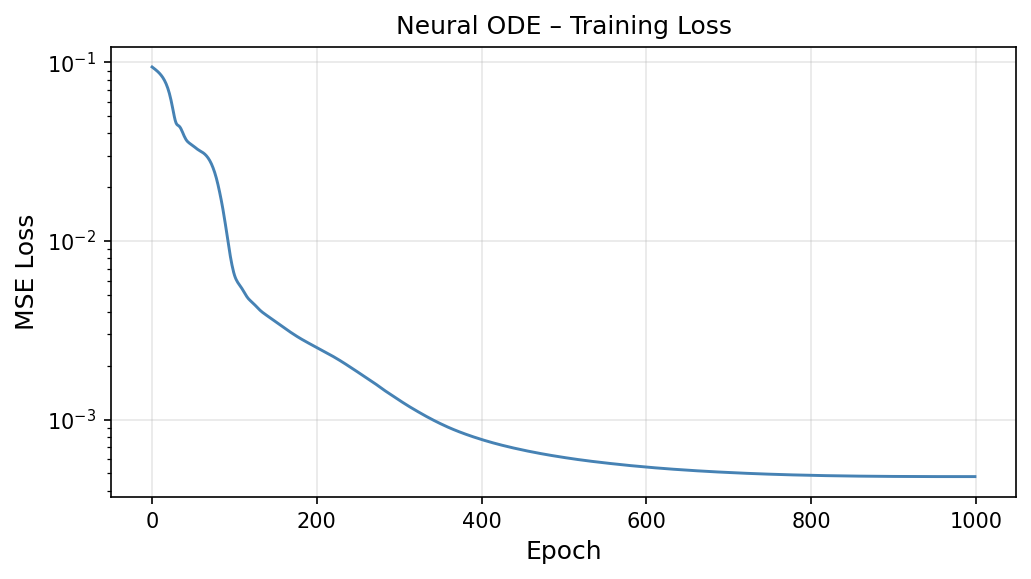
Figure 2: Log-scaled training loss curve demonstrating robust convergence over 1000 epochs.
Indicator-specific RMSEs are all below 0.03, confirming both the flexibility of the continuous dynamics approach and the informativeness of the district conditioning. The latent space enables modeling of nonlinearities and allows for smooth interpolation across non-uniformly observed time intervals.
Learned Embeddings
The model discovers multi-dimensional vector embeddings for each district that compactly represent persistent structural variation. PCA visualizations show that districts with analogous poverty trajectories cluster in the embedding space, implying that the model automatically segments the socioeconomic landscape in a functionally meaningful way.
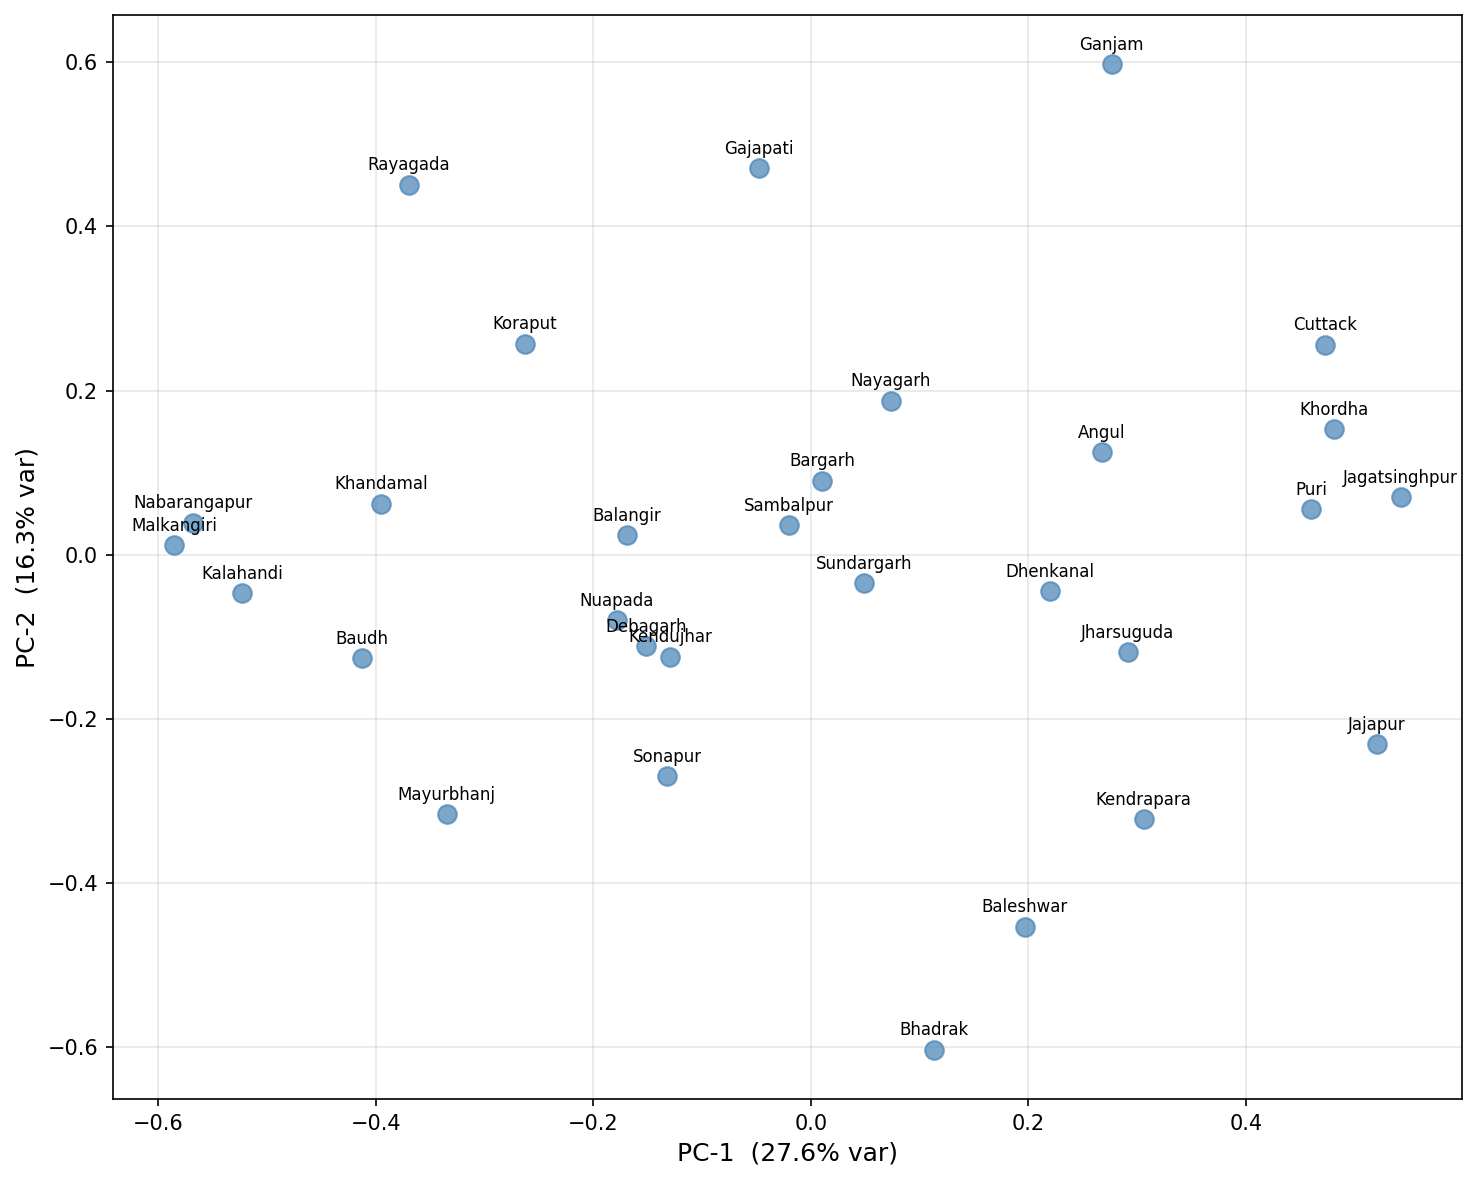
Figure 3: PCA projection of district embeddings, showing that districts with similar indicator evolution form coherent clusters.
District-Level Trajectories and Out-of-Sample Forecasts
Indicator trajectories (both reconstructed and forecasted) for Koraput, Balangir, and Kalahandi districts evidence both high fidelity to observed data and plausible, smooth extrapolation into 2025 and 2030. Continuous ODE integration provides predictions not limited to the training timestamps, offering quantitative tool for forward-looking policy analysis.
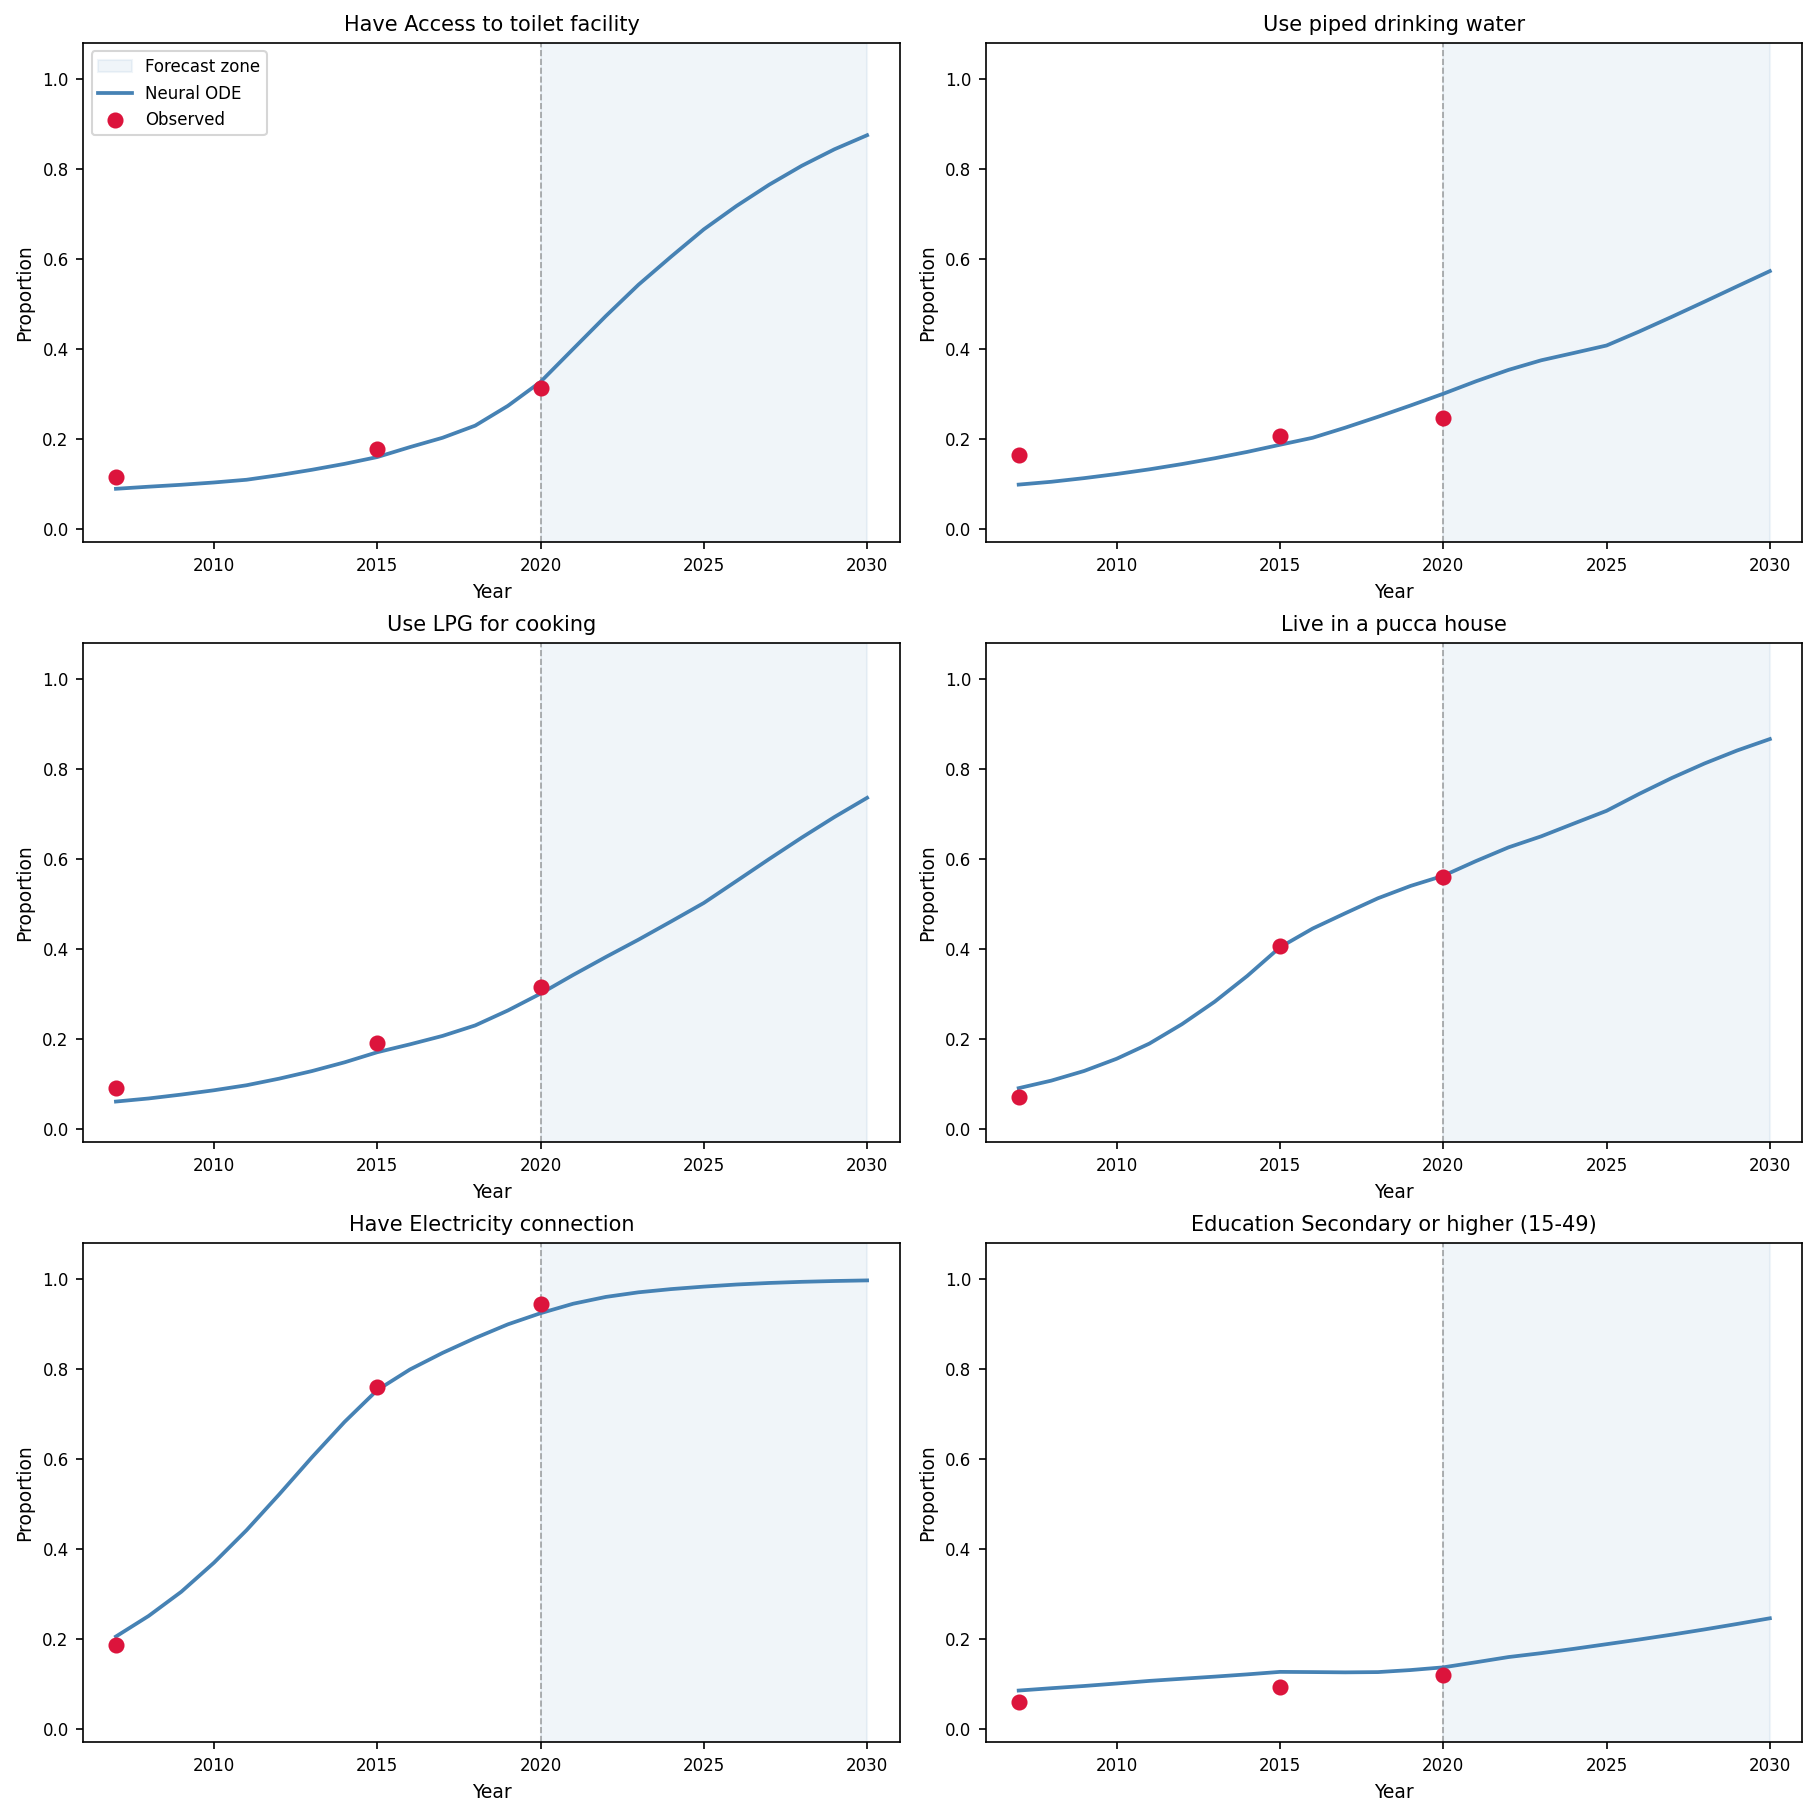
Figure 4: Model fit and forecast for Koraput district, illustrating reconstruction accuracy and out-of-sample trajectory generation.
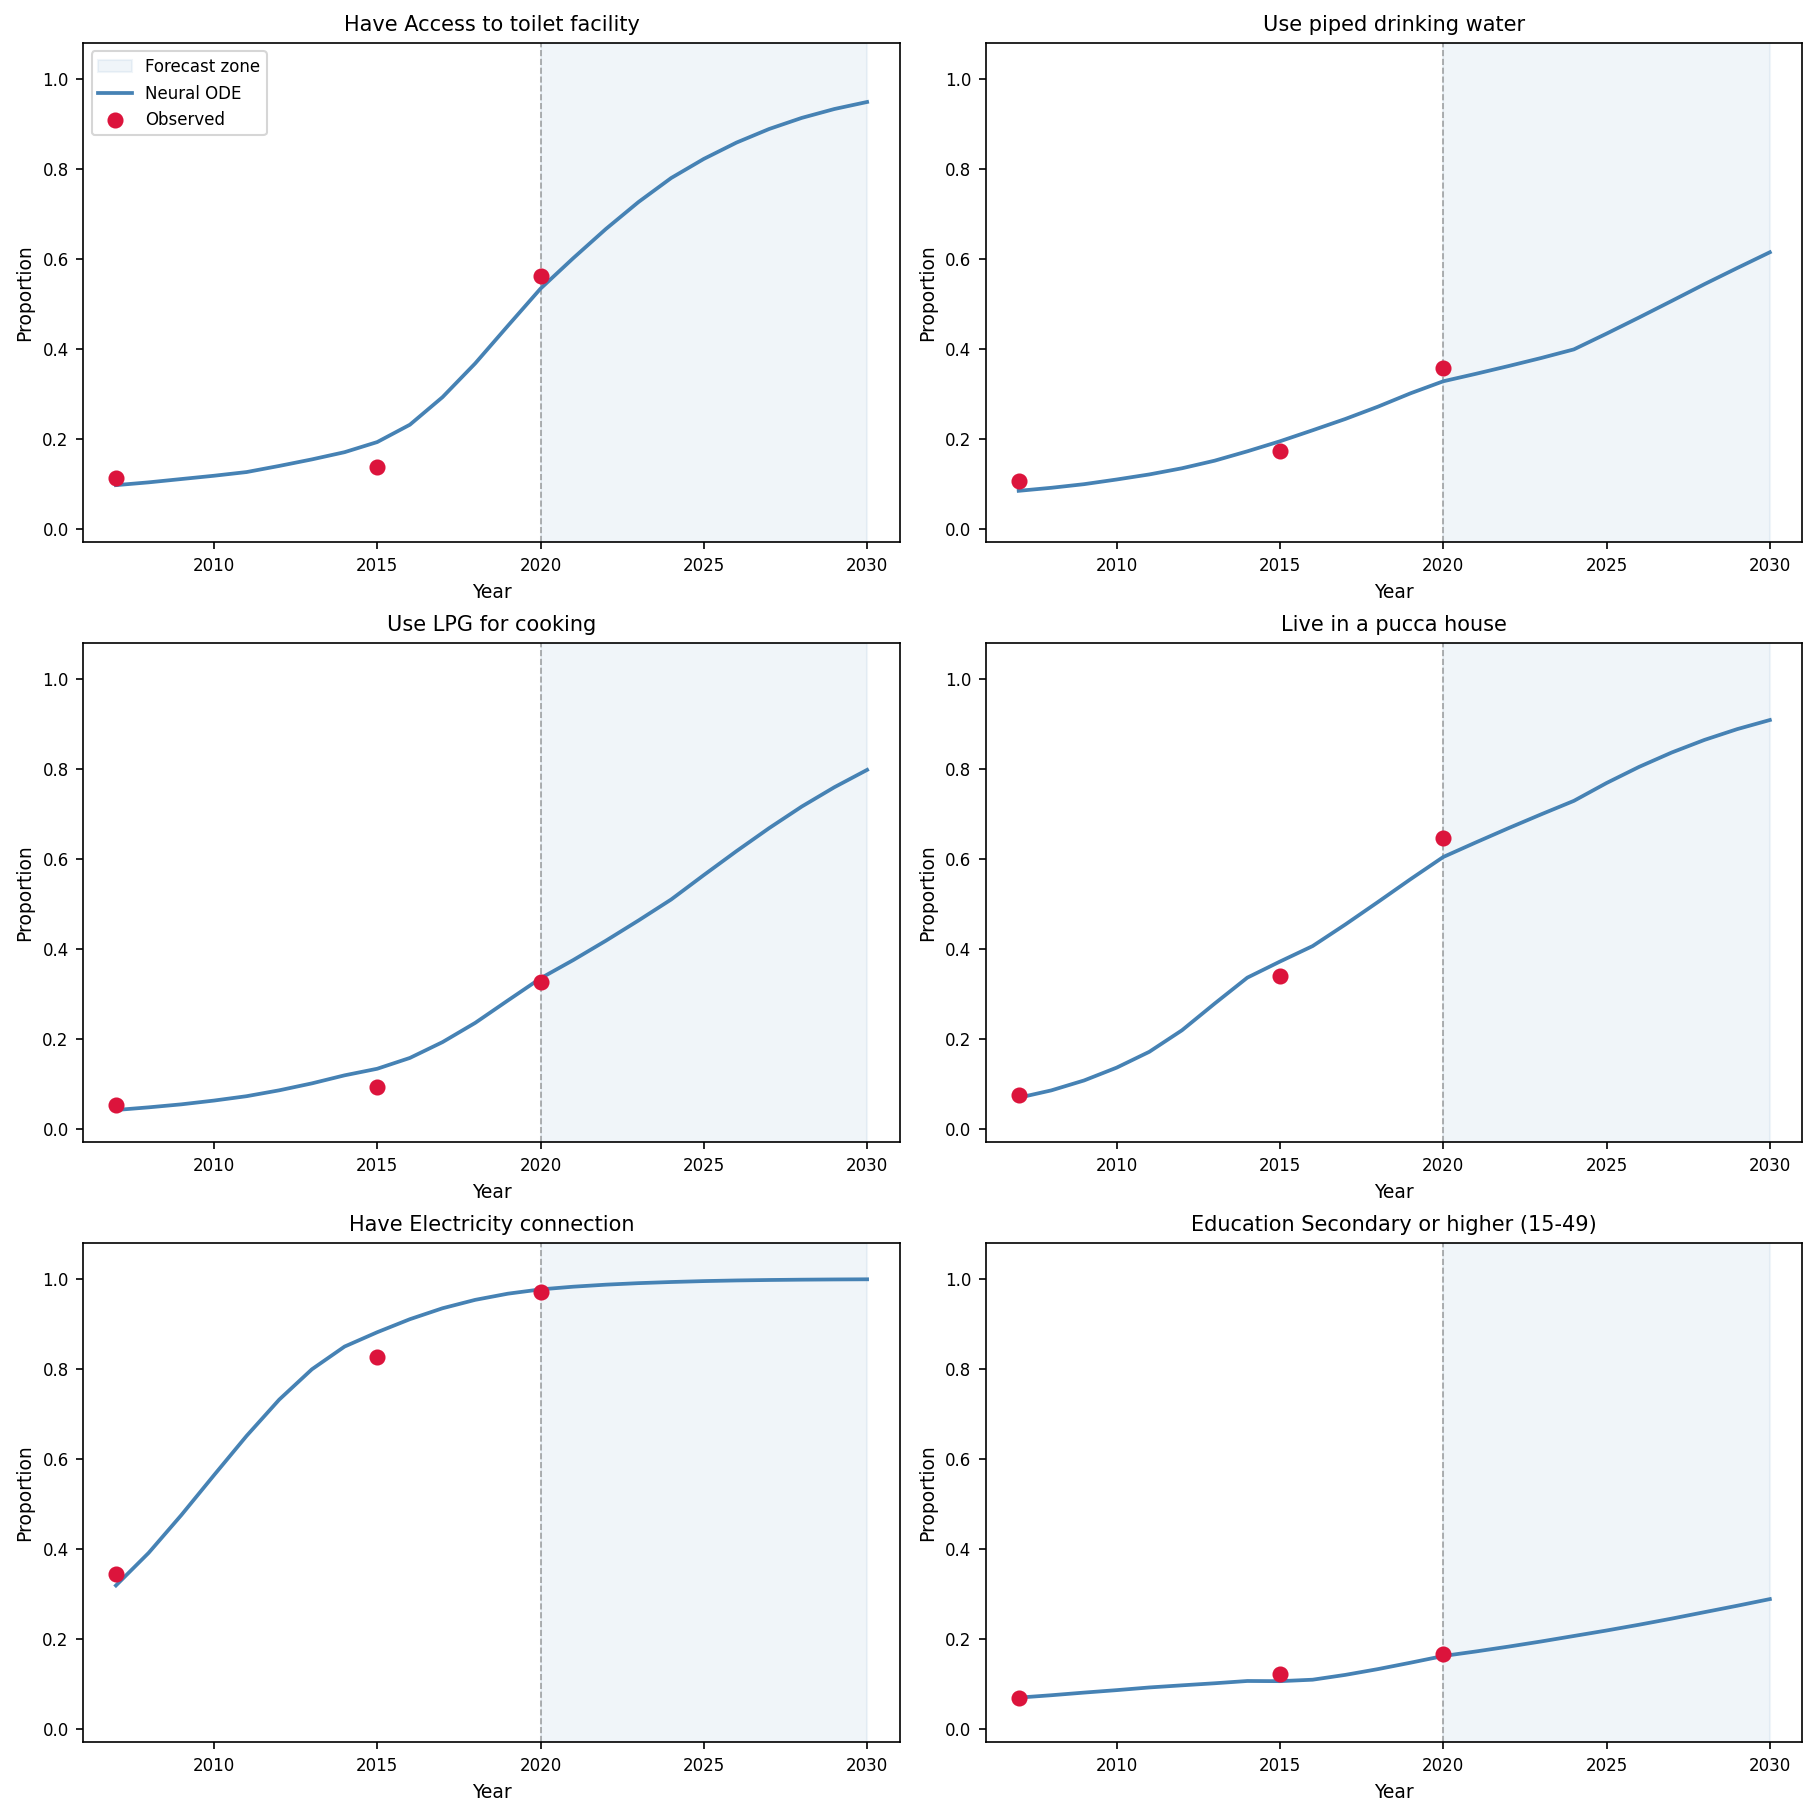
Figure 5: Analogous fit and extrapolation for Balangir district; observed points are accurately interpolated and projected.
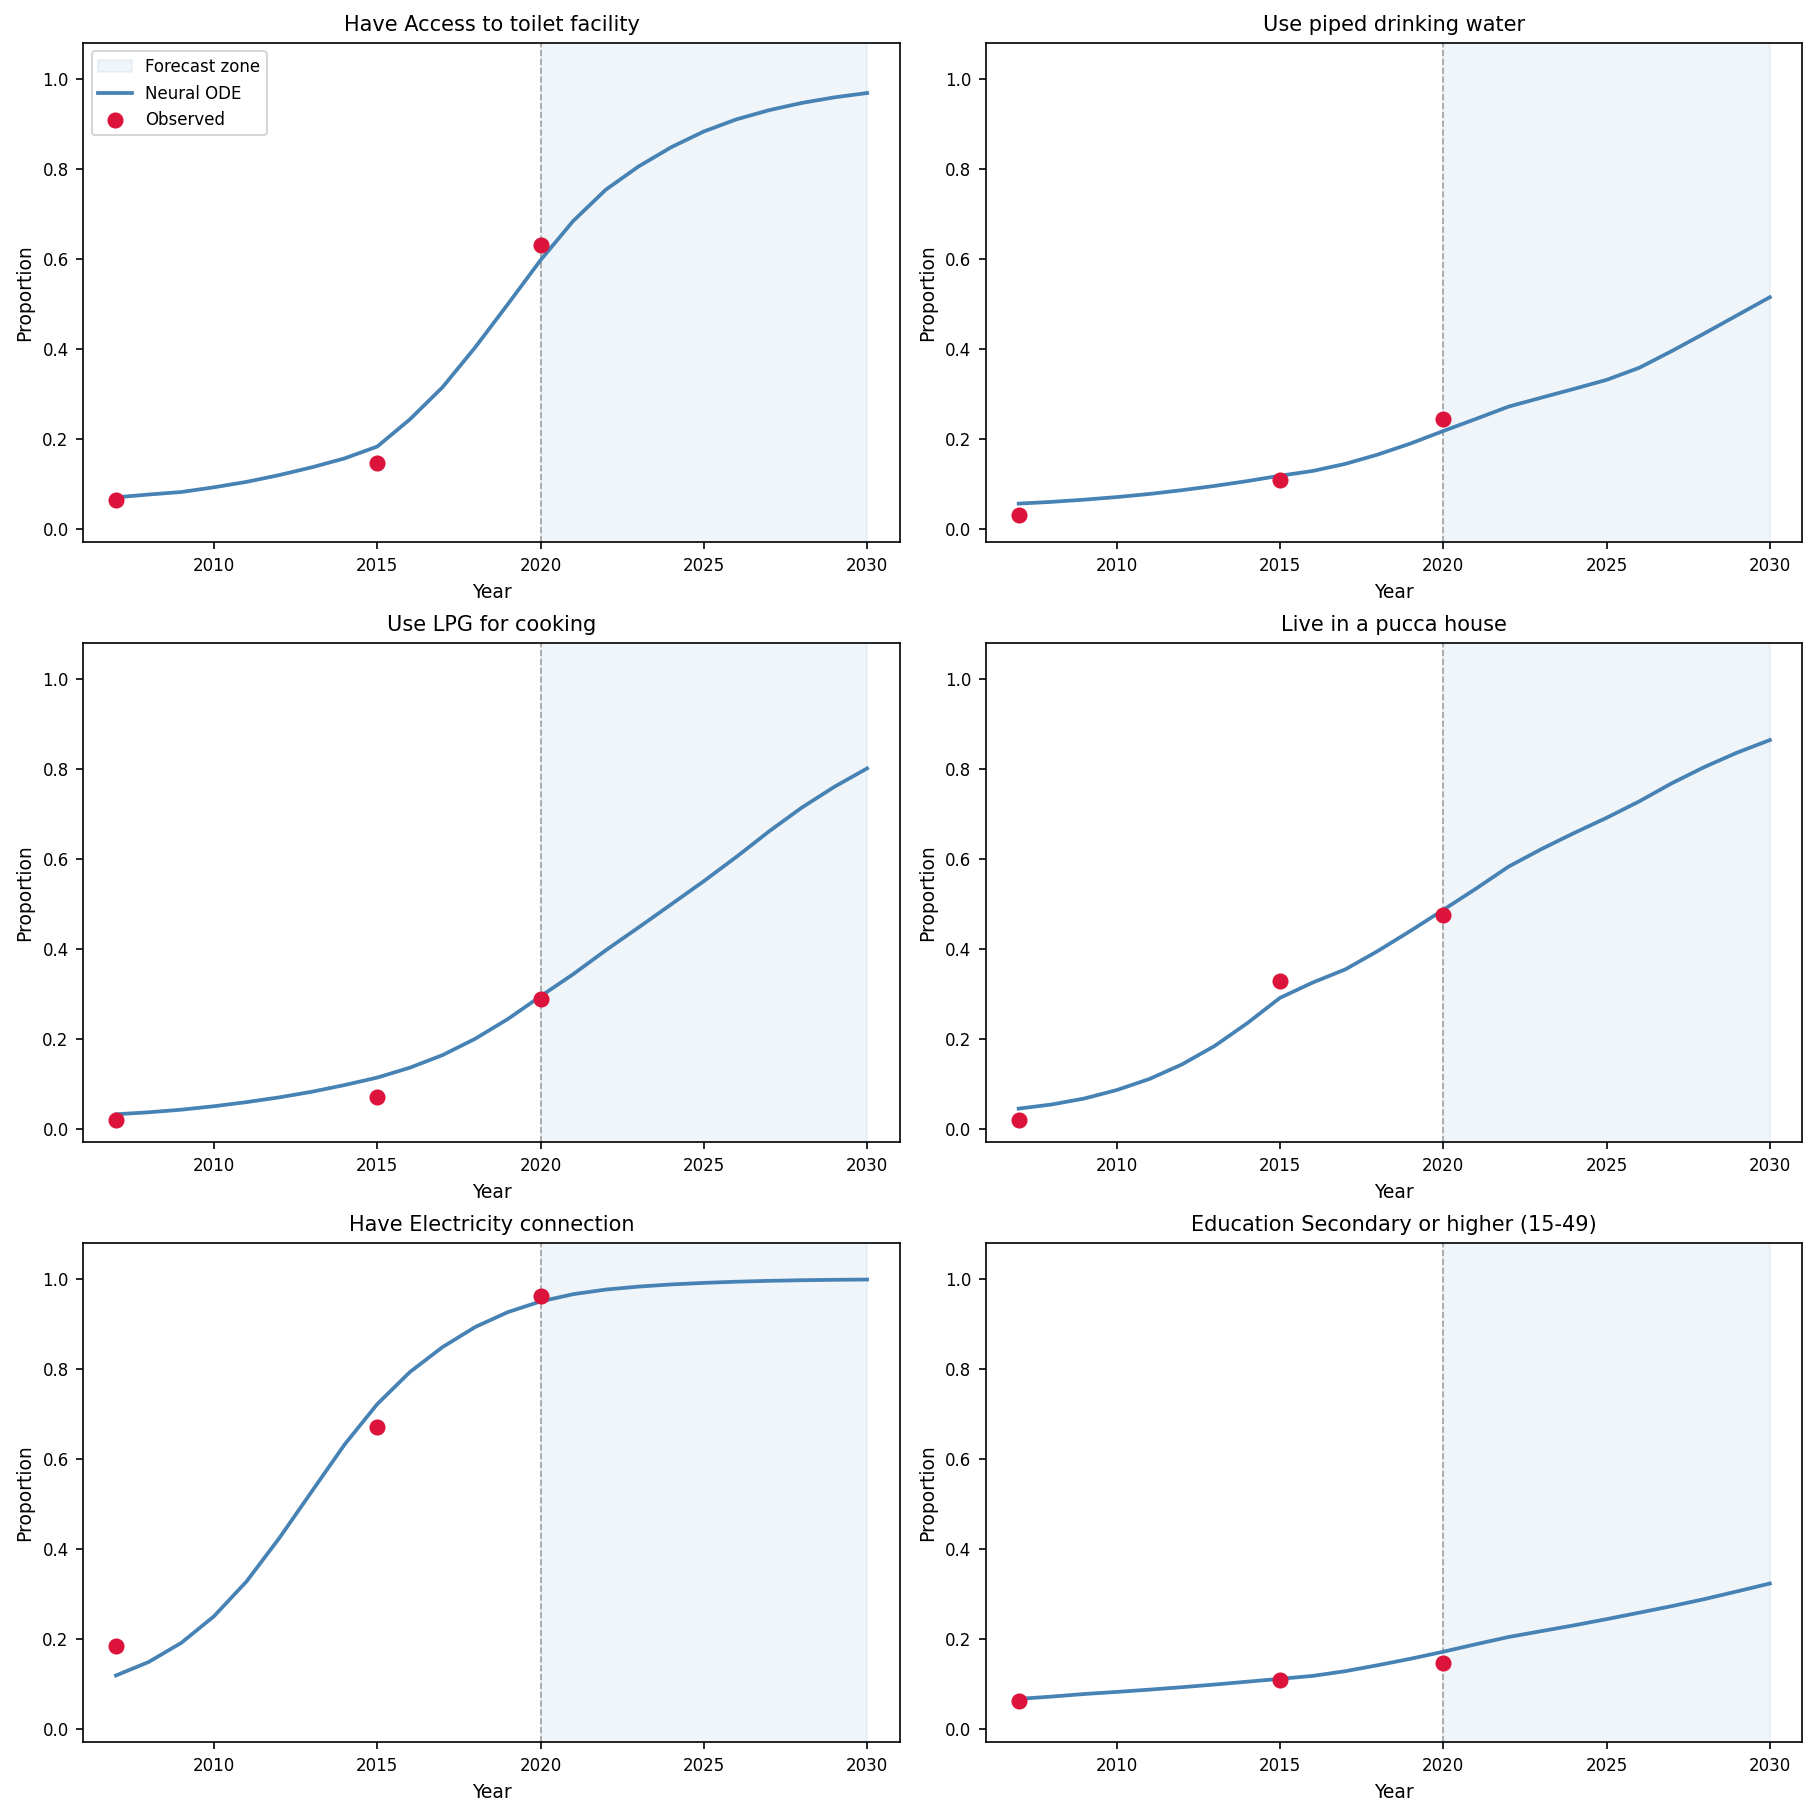
Figure 6: Kalahandi district’s indicator trajectories, highlighting robustness across heterogeneous temporal evolution patterns.
Forecast Quantification
Tabular forecast summaries for 2026 and 2030 across all districts and indicators show near-monotonic improvements for infrastructure metrics (toilets, LPG, pucca housing, electricity). Education lags, demonstrating slower dynamic response, which is consistent with known sectoral inertia in human-capital accumulation. Electricity access saturates close to unity by 2030, while piped drinking water and education indicators present significant residual spatial heterogeneity.
Implications and Limitations
The district-embedded Neural ODE framework demonstrates efficacy in modeling sparse, nonlinear, heterogeneous socioeconomic systems where mechanistic ODEs are infeasible. The approach yields both interpretable forecasts and interpretable learned representations, which are highly relevant for resource targeting and performance monitoring in multi-district settings.
However, the design is purely observational and agnostic to exogenous shock events or major policy regime shifts (i.e., model extrapolates current dynamics forward, not accounting for structural breaks). Time span limitations (3 points over 13 years) constrain long-horizon reliability. Uncertainty quantification is not addressed—point forecasts can hide confidence interval width. Bayesian Neural ODEs or ensembling could address this in future work.
From a theoretical standpoint, this work affirms the value of combining deep sequence models (GRU) with continuous dynamical systems augmented with learned context variables. Future research directions include (i) explicit modeling of intervention effects/shocks as exogenous covariates, (ii) uncertainty quantification via posterior predictive intervals, and (iii) adaptation to spatiotemporal extensions or models with richer auxiliary data such as satellite or mobile data streams.
Conclusion
This work provides a principled and robust application of district-embedded Neural ODEs for modeling the evolution of poverty indicators in Odisha. The model’s ability to reconstruct irregularly sampled, nonlinear time series, generate policy-relevant forecasts, and interpret district structural heterogeneity situates it as a practical alternative to discrete-time deep learning and classic econometrics for complex social systems. Its continuous-time, data-driven, embedding-conditioned approach advances the methodological toolkit for dynamical socioeconomic analysis.