- The paper establishes that the contact process exhibits novel survival mechanisms on bipartite spatial networks driven by anisotropic infection rates and heavy-tailed degree distributions.
- It uses combinatorial path classification and martingale estimates to derive sharp asymptotics for the survival probability, revealing distinct phase regions.
- The findings have practical implications for epidemiology and network design by clarifying how spatial locality and bipartition jointly modulate infection persistence.
Introduction and Model Motivation
The paper "The contact process on a bipartite spatial network" (2604.00630) presents an in-depth investigation of the contact process on a random bipartite network constructed in Euclidean space. The primary motivation stems from scenarios where populations are inherently bipartite and spatially embedded, including sexually transmitted epidemics in heterosexual populations (with typically asymmetric infection rates and heterogeneous degree distributions) and higher-order contagion processes mediated by group gatherings. The authors rigorously characterize the survival probability of the contact process on such networks with anisotropic infection rates and demonstrate that the interplay between spatial structure, bipartition, and power-law connectivity gives rise to novel survival mechanisms absent in classical random graph models.
Model Definition and Structural Properties
The network considered is a random bipartite spatial hypergraph formed from two independent Poisson point processes P1 and P2 on R×[0,1], corresponding to two distinct vertex types. Edge formation between a type-1 vertex (x,u) and a type-2 vertex (y,v) is controlled by the inequality ∣x−y∣≤u−γ1v−γ2, with parameters γ1,γ2∈(0,1). Vertex marks u,v modulate spatial reach and expected degree, yielding heavy-tailed degree distributions whose exponents depend critically on γ1 and γ2. The model interpolates between previously studied graphs (such as weight-dependent spatial random graphs) while capturing realistic clustering and locality.
The regime P20 is shown to be necessary for percolation and thus for the survival of the contact process; outside this region, almost surely all connected components are finite.
The authors analyze the contact process with type-dependent infection rates: type-1 vertices infect at rate P21, type-2 at P22 for some P23, with focus on the low-P24 asymptotic regime. The survival probability P25 is linked (for small P26) to the "dominant" or "optimal" infection strategy that can sustain the process indefinitely. The bipartite and spatial structure of the graph introduces significant complexity, as survival can be orchestrated through various mechanisms involving highly connected vertices ("stars"), bridges to stars, or direct propagation through a sequence of increasing degrees.
Dominant Survival Mechanisms and Heuristic Framework
A key technical contribution of the work is the systematic identification of all possible survival mechanisms in terms of the infection's access to vertices with sufficiently high degree or direct transmission success. The relevant mechanisms can be summarized as:
- Stars: Vertices with degree much larger than P27. The infection can survive for long periods by oscillating between such vertices.
- Bridges: Vertices that are optimally positioned to reach stars of the opposite type via direct transmission.
- Direct Spreaders: Sequences of vertices enabling direct low-probability but high-impact jumps to new potential "star" vertices.
For each mechanism, parameter regions are delineated using explicit formulas involving P28. The minimum exponent among these mechanisms determines the survival probability's logarithmic asymptotics.
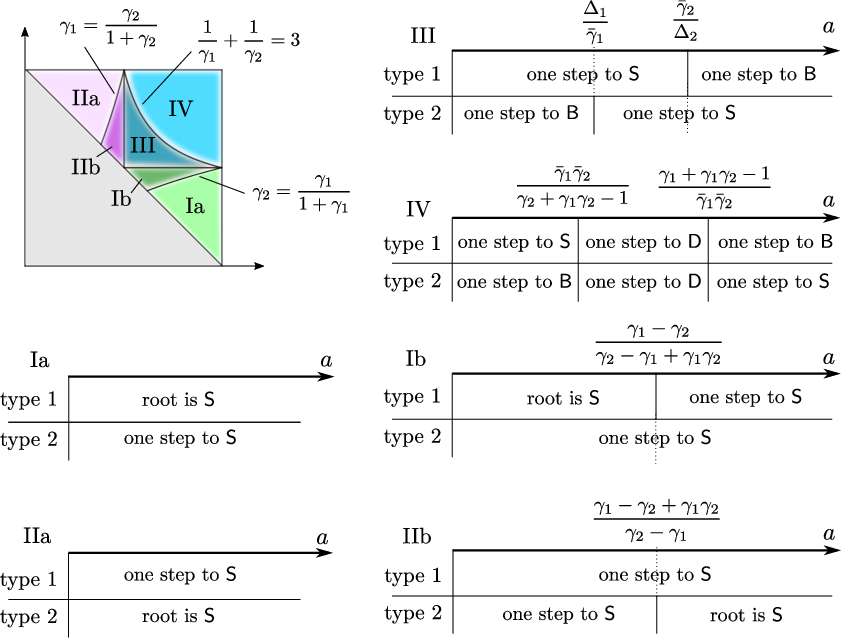
Figure 1: Strategies yielding the survival exponent for all parameter ranges P29, indicating the regions where stars, bridges, or direct pathways dominate.
Main Theorem: Phase Diagram and Asymptotics
The central result rigorously establishes sharp asymptotics (up to polylogarithmic factors) for the survival probability: R×[0,1]0
where R×[0,1]1 is an explicit function of R×[0,1]2, defined as a minimum over different survival strategies. The phase diagram features several regions, each associated with distinct optimal strategies and corresponding exponents. The theorem also specifies the regime boundaries, which coincide with critical transitions between survival mechanisms.
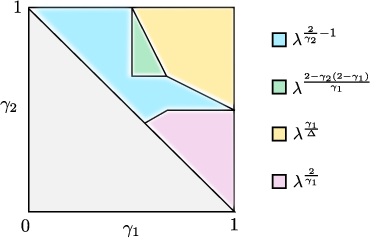
Figure 2: Phase diagram for R×[0,1]3 (symmetric infection rates), annotated by dominant survival strategies in the R×[0,1]4 plane.
The analysis not only recovers known results from the unipartite or classical spatial random graph cases in appropriate limits but also identifies new collaborative survival scenarios, such as regimes where "multiple stars" can mutually support persistence despite being individually subcritical.
Combinatorial and Martingale Techniques
The proof architecture combines a lower bound via explicit construction of survival events, e.g., by tracing infection paths that make use of stars or direct transmission, and a sharp upper bound that utilizes martingale estimates for the probabilities of long infection paths. Infection paths are combinatorially classified by their ordered trace and encoded into "combinatorial paths" with associated "discovery trees," permitting a general counting argument.
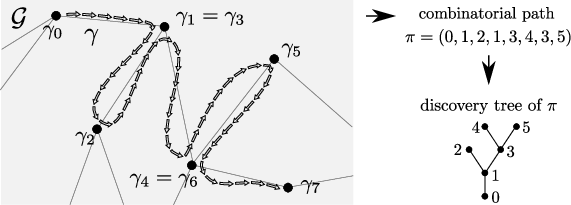
Figure 3: Illustration of the mapping from graph paths to combinatorial traces and their associated discovery trees.
Sharp reduction lemmas show that, up to logarithmic corrections, only infection paths of length at most 2 are relevant in the optimal asymptotic; longer, more elaborate infection strategies are subdominant.
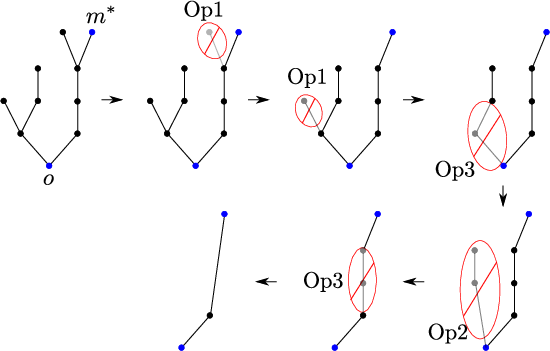
Figure 4: Example of tree reduction via combinatorial operations, demonstrating the reduction of arbitrary trees to line segments for analysis.
Optimization of Survival Exponents
A systematic optimization procedure is performed to determine the minimal exponent in the survival probability, given the model parameters. The critical minimizers, which correspond to target marks facilitating either star, bridge, or direct strategies, are displayed as phase diagrams over parameter space.

Figure 5: Regions in R×[0,1]5-space where each minimizer (star, bridge, direct spreader) dominates.
Implications and Future Directions
Practically, the results elucidate how both degree heterogeneity and asymmetry in transmission rates—ubiquitous in real-world bipartite and spatial networks—affect epidemic persistence. The demonstrated existence of new survival mechanisms due to the interaction of spatial locality, degree distributions, and bipartite structure may inform intervention strategies in epidemiology and can guide structural design in synthetic or engineered bipartite networks.
Theoretically, the work extends the classification of contact process phase diagrams to a richer family of spatial hypergraphs and quantifies the extent to which higher-order and group-mediated contagion modifies survival thresholds. Several technical refinements—especially concerning logarithmic corrections or extension to further general classes of models—are deferred, with suggestions for future research including the precise characterization of metastable densities, exploration of analogous dynamics in temporal or adaptive bipartite graphs, and further investigation into hypergraph percolation phenomena.
Conclusion
The analysis presented in this work provides a comprehensive understanding of the survival probability for the contact process on bipartite spatial networks, substantially enriching the landscape of known results for interacting particle systems on complex graphs. By explicitly determining the dominant survival strategies and phase transitions, it offers both new mathematical predictions and methodological tools for the study of epidemics and other spreading processes in structured populations with heterogeneous connectivity (2604.00630).

