Disease Progression and Subtype Modeling for Combined Discrete and Continuous Input Data
Abstract: Disease progression modeling provides a robust framework to identify long-term disease trajectories from short-term biomarker data. It is a valuable tool to gain a deeper understanding of diseases with a long disease trajectory, such as Alzheimer's disease. A key limitation of most disease progression models is that they are specific to a single data type (e.g., continuous data), thereby limiting their applicability to heterogeneous, real-world datasets. To address this limitation, we propose the Mixed Events model, a novel disease progression model that handles both discrete and continuous data types. This model is implemented within the Subtype and Stage Inference (SuStaIn) framework, resulting in Mixed-SuStaIn, enabling subtype and progression modeling. We demonstrate the effectiveness of Mixed-SuStaIn through simulation experiments and real-world data from the Alzheimer's Disease Neuroimaging Initiative, showing that it performs well on mixed datasets. The code is available at: https://github.com/ucl-pond/pySuStaIn.
Paper Prompts
Sign up for free to create and run prompts on this paper using GPT-5.
Top Community Prompts
Explain it Like I'm 14
Overview
This paper is about a new way to understand how diseases like Alzheimer’s progress over time. The authors created a model that can use different kinds of medical data together—numbers, scores, and yes/no results—to map out how a disease changes from early stages to later stages. This helps doctors and researchers see the “timeline” of disease for different groups of patients, rather than guessing from a few short check-ups.
Key Objectives
The paper sets out to do the following:
- Build a single model that can handle mixed data types at the same time: continuous numbers (like brain volume), ordered scores (like a rating from 0 to 3), and binary data (like normal vs. abnormal lab results).
- Fit this model into an existing tool called SuStaIn (Subtype and Stage Inference), which finds different disease “subtypes” and stages.
- Test the model on simulated data and on real patient data from the Alzheimer’s Disease Neuroimaging Initiative (ADNI).
- Check if the new model is accurate and useful, especially compared to an older method that treats everything like a simple normal/abnormal (binary) switch.
Methods (Explained Simply)
Think of disease progression like building a timeline from snapshots. Each snapshot is a person’s biomarker test—biomarkers are signs in your body that tell us something about a disease (for example, brain volume, spinal fluid results, or test scores). Because most people are only measured a few times, researchers need smart methods to guess the full timeline.
Here’s what the new method does:
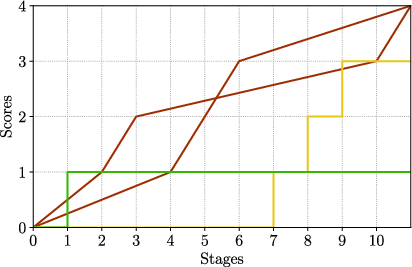
- It treats changes in a disease as “events,” like checkpoints in a game. An event happens when a biomarker moves from one level to another.
- It can handle three types of biomarker data:
- Continuous numbers: like the size of a brain region. The model assumes these numbers gradually change over time (like a slow, steady slope).
- Ordinal scores: like a rating that goes from 0 to 3. The model assumes these jump in steps (0 → 1 → 2 → 3).
- Binary values: simple yes/no or normal/abnormal. The model assumes these switch once from normal to abnormal.
- It combines all these types into one model using a “likelihood” function. In everyday terms, likelihood is a score for how well a guessed timeline fits the actual data.
- It plugs this mixed-data model into SuStaIn. SuStaIn looks for:
- Subtypes: different paths the disease can take for different groups of people.
- Stages: where a person is along a subtype’s path.
How the team checked the model:
- Simulations: They made fake datasets with known answers to see if the model could recover the correct order of events.
- Real ADNI data: They used brain MRI measurements (continuous), spinal fluid tests (binary), and standard corrections (like age and head size). They then compared their new model (Mixed-SuStaIn) to an older version (EBM-SuStaIn) that treats all data as simple normal/abnormal switches.
Helpful analogies for the stats:
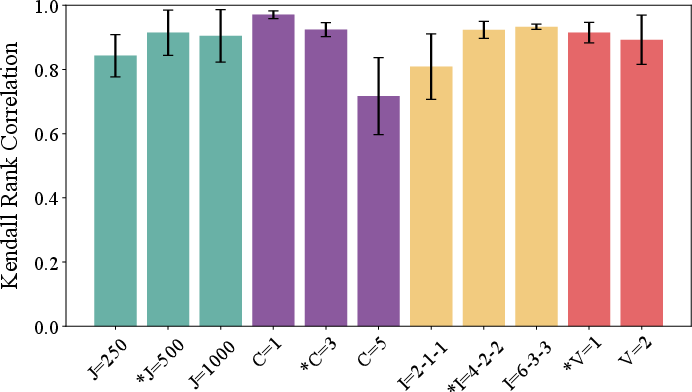
- Kendall rank correlation: Think of it as a score from 0 to 1 for “how well the order we predicted matches the true order.” 1 means perfect ordering.
- AUC-ROC: A skill score from 0.5 (random guessing) to 1.0 (perfect prediction) for telling apart people who will grow worse soon from those who won’t.
Main Findings
Here are the key results, summarized for clarity:
- Simulations: The new model recovered the correct event order well, with Kendall rank correlations between about 0.6 and 1.0. Results were a bit lower when there were many subtypes (because each subtype had fewer people) or fewer biomarkers (less information).
- Real-world ADNI data:
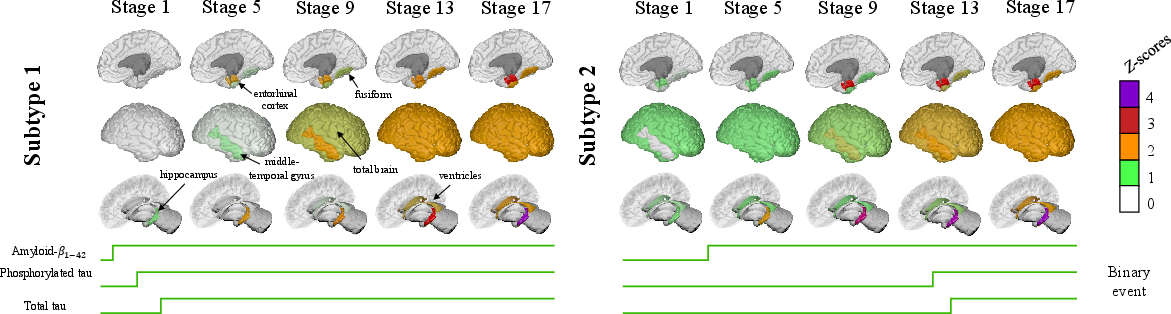
- The model found two subtypes:
- Subtype 1: A “typical Alzheimer’s” path—spinal fluid markers for amyloid and tau became abnormal early, followed by brain changes.
- Subtype 2: Brain shrinkage in certain regions (like the hippocampus) happened earlier, with amyloid changes later. This shows a different disease path for some people.
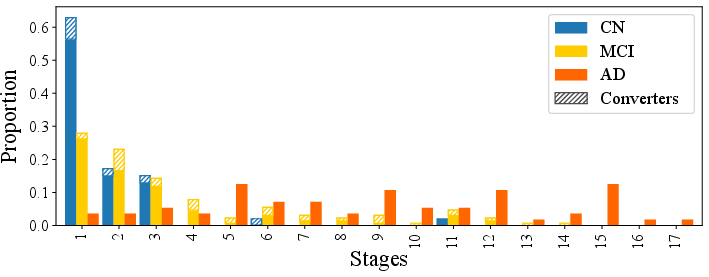
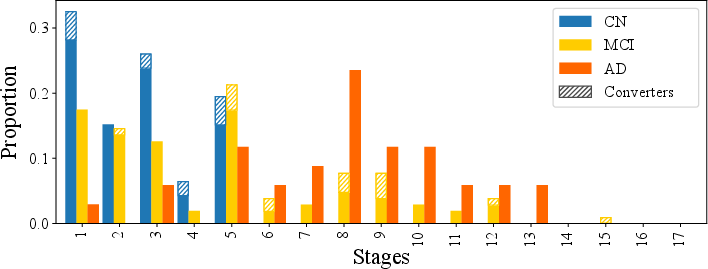
- Staging made sense: People with Alzheimer’s were mostly placed at higher disease stages than people with mild cognitive impairment (MCI) or normal cognition (CN). People who got worse within 24 months tended to be at higher stages at baseline.
- Predicting who would get worse:
- CN → MCI: AUC ≈ 0.724 (Mixed-SuStaIn), similar to 0.723 (older method).
- MCI → AD: AUC ≈ 0.828 (Mixed-SuStaIn), similar to 0.825 (older method).
- Link to thinking ability (MMSE scores): Higher disease stage was linked to lower MMSE scores. The strength of this link was similar between the new and old methods and stronger in the “typical Alzheimer’s” subtype.
Why This Matters
This work shows that it’s now possible to model disease progression using different kinds of medical data together—numbers, scores, and yes/no results—without forcing everything to fit one shape. Even when predicting short-term changes, the new mixed-data model performs about as well as the older method. But its big advantage is flexibility: it can use more types of real-world data, which should lead to a more complete picture of how a disease unfolds.
Potential impact:
- Better personalization: Doctors could identify which subtype and stage a person is at using mixed data, leading to more tailored care.
- Improved research: Scientists can include a wider range of biomarkers to understand disease paths more fully and find new patient groups.
- Future work: Applying this model to broader datasets—including more kinds of scores and measures—could uncover new, meaningful patterns that single-data-type models miss.
For those interested, the code for this method is available at https://github.com/ucl-pond/pySuStaIn.
Knowledge Gaps
Knowledge gaps, limitations, and open questions
Below is a single, actionable list of what remains missing, uncertain, or unexplored in the paper.
- Lack of real-world evaluation with ordinal biomarkers: although the method supports ordinal inputs, the ADNI application excluded ordinal measures to allow comparison with EBM-SuStaIn, so the practical value of including ordinal data remains untested on real cohorts.
- External validity across diseases and cohorts: the model was only validated on ADNI (AD/MCI/CN); applicability to other neurodegenerative disorders, non-AD biomarkers (e.g., α-syn, TDP-43), or population-based cohorts is unassessed.
- Longitudinal validation is missing: staging and subtyping were derived from baseline data; the model’s longitudinal consistency (e.g., stage monotonicity, test–retest reliability, progression rates) and ability to forecast future biomarker trajectories are not evaluated.
- Handling of missing data not demonstrated: the real-world analysis required complete MRI+CSF cases; robustness to missingness, and the performance of Mixed-SuStaIn under realistic missing-data patterns are untested.
- Sensitivity to modeling choices is unexplored: no sensitivity analyses for key hyperparameters and design decisions (e.g., z-score knot placement, z-max defined via 99% quantile, choice of sigma for NormPDF, kernel vs Gaussian mixtures for binary, priors P(k) and P(c)).
- Distributional assumptions for binary/ordinal likelihoods are not stress-tested: the impact of mis-specified mixtures, non-Gaussian tails, overlapping classes, or alternative density estimators on event orderings and staging is unknown.
- Uncertainty quantification is limited: there are no credible intervals or posterior variance for event orderings, stages, or subtype assignments; robustness to label switching and identifiability issues in mixed-data settings is not examined.
- Scalability and runtime are unreported: computational costs with increasing numbers of biomarkers, subjects, subtypes, and event levels (especially with many ordinal levels) are not characterized.
- Model selection criteria are underspecified: five-fold cross-validation is used for choosing the number of subtypes, but the objective function/metric (e.g., CV-likelihood, information criterion) and its stability across folds are not reported.
- Limited benchmark comparisons: evaluation is only against EBM-SuStaIn; comparisons to other progression/subtyping frameworks that can handle mixed data (e.g., latent-time joint models, disease course mapping, discriminative EBMs, or missing-data-enabled SuStaIn variants) are absent.
- Predictive utility is narrowly assessed: only short-term conversion AUCs (CN→MCI and MCI→AD within 24 months) are reported; calibration, decision-curve analysis, survival/hazard modeling, and time-to-event prediction performance are not assessed.
- Biological/clinical validation is shallow: beyond MMSE correlations, there is no neuropathological, fluid–PET, or therapeutic-response validation to substantiate the biological plausibility and clinical utility of discovered subtypes.
- Generalizability across acquisition sites/scanners not addressed: multi-site harmonization (e.g., ComBat) is not applied or evaluated; susceptibility to site/scanner effects and batch biases remains unknown.
- Confounding control is limited: MRI z-scores are corrected for age and ICV, but not for sex, education, APOE, vascular risk, or site; the impact of unmodeled confounding on subtypes/stages is unclear.
- Reference group dependence may induce circularity: CN-defined z-scoring could bias staging and subtype structure; alternative reference strategies and their effects are not tested.
- Monotonicity and fixed-shape trajectory assumptions: piecewise linear (z) and stepwise (binary/ordinal) monotonic trajectories may be violated in real data (e.g., non-monotonic, plateauing, or reversible biomarkers); model misspecification effects are unknown.
- Inter-modality event granularity mismatch: how differing event resolutions (e.g., many z-score events vs. single binary transitions) affect ordering dominance, stage granularity, and identifiability is not analyzed.
- Prior over stage P(k) is unspecified: there is no description or evaluation of how stage priors influence staging and subtyping; optimal or data-driven priors are not explored.
- Ordinal likelihood design choices are unclear: the chosen ordinal likelihood (categorical vs Gaussian on scores) and its calibration are not specified for simulations; the consequences for real data are untested.
- Robustness to noise and class imbalance: the simulations vary subject/biomarker counts, but do not probe heavy noise, skewed subtype prevalence, severe overlap, or outlier contamination typical of clinical cohorts.
- Reproducibility details are limited: random seeds, initialization schemes, convergence diagnostics, and repeated CV results are not reported; subtype reproducibility under bootstrapping or cross-cohort replication is unknown.
- Stage interpretability across mixed modalities: guidance on interpreting a unified stage that mixes stepwise and linear events, particularly for clinical decision-making, is not provided.
- Impact of thresholding CSF as binary: binarizing CSF via Gaussian mixtures may discard useful continuous information; the trade-off versus modeling CSF as continuous/ordinal is not quantified.
- Extension to richer modalities is untested: although the framework should accept PET, plasma biomarkers, cognitive composites, and visual ratings (ordinal), these were not integrated in the real-world analysis.
- Fairness and subgroup performance not examined: differences in staging/prediction across sex, age bands, ethnicity, APOE status, or comorbidity strata are not evaluated.
- Overfitting and subtype proliferation risk: with flexible mixed-event modeling, criteria to avoid spurious subtypes and to ensure clinical interpretability are not articulated.
- Clinical translation pathway is unclear: thresholds for actionable staging, monitoring intervals, and integration into trial enrichment or personalized treatment selection are not defined.
- Parameter estimation for z-score noise (σi) is opaque: how σi is obtained and its influence on likelihood shape and event ordering is not detailed; alternative heteroscedastic noise models are not explored.
- Point-estimate likelihood for z-scores: the choice to compare to the point estimate (instead of integrating over piecewise linear segments) is adopted from prior work but not re-examined for mixed-data settings; potential biases are unknown.
Practical Applications
Immediate Applications
Below are practical, deployable-now use cases that leverage the paper’s Mixed Events model and its Mixed-SuStaIn implementation, primarily in research and translational settings where multi-modal biomarker data are already collected.
- Healthcare (research hospitals and memory clinics): Retrospective patient subtyping and staging in Alzheimer’s disease using mixed MRI volumetrics (continuous z-scores) and CSF biomarkers (binary thresholds) via
pySuStaInMixed-SuStaIn to:- stratify patients by subtype (e.g., typical AD vs. early atrophy-first subtype) and stage,
- prioritize follow-up and triage patients at higher risk of near-term conversion (supported by reported AUC ~0.83 for MCI→AD and ~0.72 for CN→MCI).
- (Assumptions/Dependencies: Access to MRI+CSF data; site-specific data harmonization; a suitable cognitively normal reference for z-scoring; selection of z-values/z-max; calibration of binary thresholds using GMM.)
- Pharma/Clinical trials (neurology): Trial enrichment and cohort balancing using Mixed-SuStaIn-derived subtype/stage labels to:
- pre-specify inclusion/exclusion criteria,
- reduce heterogeneity by enrolling patients from targeted subtypes/stages that align with mechanism of action,
- run stratified analyses and adaptive randomization.
- (Assumptions/Dependencies: Multi-center biomarker standardization; protocol pre-specification; reproducible subtype assignment; regulatory acceptance for stratification.)
- Academia (biomedical imaging, computational neurology): Methodological replication and extension studies:
- apply Mixed-SuStaIn to other datasets to study AD heterogeneity and validate subtype/stage-cognition correlations (e.g., MMSE),
- test robustness across biomarker panels (e.g., adding visual ratings as ordinal inputs).
- (Assumptions/Dependencies: Public or institutional datasets with mixed data types; adherence to the paper’s likelihood formulations; cross-validation to select subtype count.)
- Software/Analytics (bioinformatics platforms): Integrate Mixed-SuStaIn into data-science pipelines as a reusable module:
- turnkey scripts for data preprocessing (z-scoring, GMM thresholds),
- dashboards summarizing subtype/stage distributions and predicted conversion risks.
- (Assumptions/Dependencies: Engineering integration with
pySuStaIn; compute resources; MLOps for versioning and provenance.)
- Hospital operations (care pathway design): Use subtype/stage distributions to inform scheduling of follow-ups and cognitive testing intensity (e.g., higher-frequency assessments for late-stage or high-risk subtypes). (Assumptions/Dependencies: Institutional workflow alignment; clinical governance; continuous access to updated biomarker results.)
- Education/Training (neurology residency, biostatistics courses): Classroom and lab exercises demonstrating mixed-data disease progression modeling with replication of ADNI analyses to build practical skills in multi-modal modeling. (Assumptions/Dependencies: Availability of de-identified sample datasets; basic Python infrastructure.)
- Data curation (biobank/EHR-embedded registries): Standardize biomarker pipelines to produce model-ready inputs (z-scored imaging, categorical/ordinal scales, binary lab thresholds) for periodic Mixed-SuStaIn runs. (Assumptions/Dependencies: Harmonized DICOM-to-volumetrics workflows; validated reference cohorts; site-effect correction.)
- Health technology assessment (HTA) scoping: Exploratory cost-effectiveness analyses of trial enrichment using Mixed-SuStaIn subtyping/staging to estimate likely reductions in sample size or time-to-signal. (Assumptions/Dependencies: Access to historical trial data; realistic assumptions about subtype-treatment interaction; cautious interpretation pending prospective validation.)
- Cross-cohort meta-analysis (consortia): Harmonize mixed biomarkers across centers to compare subtype prevalence and progression patterns internationally. (Assumptions/Dependencies: Data-sharing agreements; federated or centralized analysis infrastructure; harmonization of acquisition protocols.)
- Clinical research decision support (pilot): Clinician-facing research dashboards that annotate patients with subtype/stage and show correlations to cognition, as a complement to standard radiology and lab reports. (Assumptions/Dependencies: Research-use-only status; IRB approval; clinician training; no diagnostic claims without regulatory clearance.)
Long-Term Applications
These use cases require further validation, scaling, regulatory approval, broader data integration, or technology/productization beyond the paper’s current scope.
- Healthcare/EHR-integrated clinical decision support: Real-time multi-modal AD staging and subtyping at point of care to:
- personalize treatment planning,
- trigger guideline-based alerts for diagnostic workups or CSF/PET confirmation,
- monitor longitudinal trajectory changes.
- (Assumptions/Dependencies: Prospective multi-site validation; regulatory approval; robust interpretability; interoperability with EHR standards like FHIR.)
- Public health and policy (screening guidelines, resource allocation): Population-level modeling of progression risk profiles to:
- prioritize screening or memory clinic referrals,
- allocate imaging/CSF testing resources based on subtype prevalence.
- (Assumptions/Dependencies: Demonstrated generalizability across demographics; cost-effectiveness studies; equity and fairness audits.)
- Multi-disease platform (neurology and beyond): Extend Mixed-SuStaIn to diseases with mixed biomarkers:
- Parkinson’s disease (UPDRS as ordinal, DaTscan PET/SPECT continuous, CSF alpha-synuclein binary),
- Multiple sclerosis (EDSS ordinal, MRI lesion load continuous, oligoclonal bands binary),
- Oncology (tumor burden continuous, staging scores ordinal, mutation panels binary/thresholded),
- Cardiometabolic disorders (lab panels continuous, risk scores ordinal, event histories discrete).
- (Assumptions/Dependencies: Disease-specific biomarker selection; normative references; calibration of ordinal/binary likelihoods; clinical validation in each domain.)
- Companion diagnostics (regulated software as a medical device): Productize Mixed-SuStaIn into an FDA/CE-marked tool for patient stratification and progression prognosis supporting therapeutic selection. (Assumptions/Dependencies: High-quality evidence from prospective trials; post-market surveillance; cybersecurity/privacy compliance.)
- Precision trial design and adaptive therapeutics: Use subtype/stage to guide:
- N-of-1 and adaptive trials targeting specific trajectories,
- mechanistic alignment of therapies (e.g., amyloid-first vs. atrophy-first subtypes),
- dynamic enrichment as patients evolve in stage.
- (Assumptions/Dependencies: Regulatory acceptance of dynamic stratification; robust subtype-treatment effect estimates.)
- Digital health/wearables integration (daily life): Incorporate digital biomarkers (e.g., passive mobility, sleep, speech metrics) as ordinal/continuous inputs for at-home progression monitoring with patient/caregiver feedback apps. (Assumptions/Dependencies: Validated mappings of digital signals to clinical events/scores; privacy-preserving data pipelines; usability studies.)
- Population registries and federated learning: Privacy-preserving training of Mixed-SuStaIn across hospitals for generalized subtypes without centralizing data. (Assumptions/Dependencies: Federated infrastructure; secure aggregation; harmonized preprocessing; site-effect mitigation.)
- Multi-omics and imaging-genetics integration: Combine genomic risk, proteomics/metabolomics (continuous), and pathology thresholds (binary) to refine subtype definitions and identify targetable biological mechanisms. (Assumptions/Dependencies: Cohorts with multimodal omics; causal inference frameworks; data harmonization.)
- Clinical workflow automation: End-to-end pipelines that automatically ingest imaging, labs, and clinical scales, compute model-ready features, run Mixed-SuStaIn nightly, and surface changes in stage/subtype to care teams. (Assumptions/Dependencies: IT integration; quality control; governance and alert fatigue management; longitudinal robustness.)
- Equity and fairness in AI policy: Audits and mitigation strategies ensuring subtype/stage outputs are fair across sex, age, ethnicity, and site, informing policy on responsible AI deployment in neurology. (Assumptions/Dependencies: Diverse, representative datasets; bias detection/mitigation tools; transparent reporting standards.)
Sector Links and Potential Tools/Workflows
- Healthcare: “AD Progression Stager” EHR plugin; clinic triage workflows; follow-up scheduling rules.
- Pharma/Trials: “Subtype-Stratified Enrollment Dashboard”; adaptive randomization modules.
- Academia: “Mixed-SuStaIn Teaching Pack” with notebooks; cross-cohort benchmarking scripts.
- Software/Data science:
pySuStaInMixed-SuStaIn extensions; harmonization and z-scoring libraries; visualization dashboards. - Public health/Policy: Registry analytics pipelines; screening prioritization tools; HTA models integrating subtype prevalence and costs.
Cross-cutting Assumptions/Dependencies Affecting Feasibility
- Data availability and quality: Access to multi-modal biomarkers; reliable CN reference cohorts; standardized acquisition protocols.
- Modeling choices: User-defined z-values/z-max; robust estimation of normal/abnormal distributions (e.g., GMM); handling site effects and missingness.
- Validation and generalizability: Prospective, multi-site validation; external replication; performance in diverse populations.
- Regulatory and ethical considerations: Clinical claims require approval; transparent interpretability; bias/fairness assessments; patient privacy and consent.
- Infrastructure: Integration with existing IT systems; compute and MLOps readiness; clinician training and workflow fit.
Glossary
- Alzheimer's Disease Neuroimaging Initiative (ADNI): A large, open-access longitudinal study collecting imaging, clinical, and biomarker data across the Alzheimer’s disease spectrum. "We demonstrate the effectiveness of Mixed-SuStaIn through simulation experiments and real-world data from the Alzheimer's Disease Neuroimaging Initiative, showing that it performs well on mixed datasets."
- amyloid-: A cerebrospinal fluid biomarker reflecting amyloid pathology central to Alzheimer’s disease. "The CSF measures amyloid-, phosphorylated tau (p-tau) and total tau (t-tau) were included as binary biomarkers in the model, as these measures exhibit relatively well-defined thresholds that separate normal from abnormal values."
- AUC-ROC: Area under the Receiver Operating Characteristic curve; a metric summarizing binary classification performance across thresholds. "To compare methods, we first evaluated predictive performance for subjects converting from CN to MCI and from MCI to AD, using AUC-ROC."
- Binary (event-based) model: A progression model where each biomarker switches discretely from normal to abnormal at a specific disease stage. "The binary (event-based) model and the ordinal (scored events) model share the assumption that a biomarker transitions in discrete steps to reflect disease progression."
- Biomarker: A measurable indicator of biological state or disease, such as imaging-derived volumes or molecular assays. "At each model stage, a biomarker transitions from one level to another according to the chosen model type for that biomarker."
- Bimodal distribution: A distribution with two distinct peaks, often representing normal and disease populations. "Biomarkers are expected to follow a bimodal distribution, distinguishing disease from reference populations."
- Cerebrospinal fluid (CSF): The fluid surrounding the brain and spinal cord, commonly used for measuring protein biomarkers of neurodegeneration. "We included all participants with baseline 3T MRI and cerebrospinal fluid (CSF) data, resulting in 641 subjects (209 CN, 341 MCI, 91 AD)."
- Cognitively normal (CN): Individuals without measurable cognitive impairment, often used as a reference group in Alzheimer’s research. "ADNI is an open-access database containing imaging, clinical, and biomarker data from subjects diagnosed with AD, mild cognitive impairment (MCI), and cognitively normal (CN) individuals (reference group)."
- Cross-validation: A resampling strategy to assess model generalization by training and testing on different data folds. "We determined the optimal number of subtypes with five-fold cross-validation \cite{young_uncovering_2018}."
- EBM-SuStaIn: A version of SuStaIn that uses the event-based model (binary transitions) to handle discrete and continuous biomarkers by binarization. "We benchmarked the performance of Mixed-SuStaIn against EBM-SuStaIn, which is the only previously-developed disease progression model that can include both discrete and continuous biomarkers."
- Entorhinal cortex: A medial temporal lobe region implicated early in Alzheimer’s pathology and used as an atrophy biomarker. "Total brain, ventricles, hippocampus, entorhinal cortex, middle temporal gyrus, and fusiform gyrus (extracted with FreeSurfer v5.1) were included as continuous biomarkers in the Mixed Events model."
- Event-based model (EBM): A data-driven progression model estimating the most likely ordering of discrete biomarker abnormality events. "One of the earliest disease progression models is the event-based model (EBM), which conceptualizes disease progression as a series of events."
- FreeSurfer v5.1: A neuroimaging software suite for automated brain MRI segmentation and cortical parcellation. "Total brain, ventricles, hippocampus, entorhinal cortex, middle temporal gyrus, and fusiform gyrus (extracted with FreeSurfer v5.1) were included as continuous biomarkers in the Mixed Events model."
- Fusiform gyrus: A temporal lobe structure; its atrophy can serve as a neurodegenerative biomarker. "Total brain, ventricles, hippocampus, entorhinal cortex, middle temporal gyrus, and fusiform gyrus (extracted with FreeSurfer v5.1) were included as continuous biomarkers in the Mixed Events model."
- Gaussian mixture modeling: A probabilistic modeling approach representing data as a mixture of Gaussian components, often used to separate normal and abnormal biomarker distributions. "The probabilities for the normal distribution and the abnormal distribution are typically estimated using Gaussian mixture modeling \cite{fonteijn_event-based_2012,young_data-driven_2014} or kernel density estimation \cite{firth_sequences_2020}, although any probability distribution can be used."
- Gaussian reference distribution: A normal distribution derived from a reference group used to compute z-scores for biomarkers. "Biomarker values transformed to z-scores based on a Gaussian reference distribution"
- Hippocampus: A memory-related medial temporal lobe structure; hippocampal atrophy is a hallmark of Alzheimer’s disease. "Subtype 2 (n=289) was characterized by early atrophy in the hippocampus, total brain, and entorhinal cortex, followed by amyloid- and late tau pathology."
- Kendall's rank correlation: A nonparametric measure of ordinal association used to compare event orderings or rankings. "Performance was assessed using Kendall's rank correlation."
- Kernel density estimation: A nonparametric method to estimate probability density functions from data. "The probabilities for the normal distribution and the abnormal distribution are typically estimated using Gaussian mixture modeling \cite{fonteijn_event-based_2012,young_data-driven_2014} or kernel density estimation \cite{firth_sequences_2020}, although any probability distribution can be used."
- Likelihood function: A function measuring how probable observed data are under specific model parameters or event sequences. "The key innovation is a novel formulation of the likelihood function that enables integration of the likelihoods of the piecewise linear z-score model, the event-based model, and the scored events model into a single objective function for estimating the event ordering."
- Middle temporal gyrus: A cortical region often implicated in Alzheimer’s-related atrophy patterns. "Total brain, ventricles, hippocampus, entorhinal cortex, middle temporal gyrus, and fusiform gyrus (extracted with FreeSurfer v5.1) were included as continuous biomarkers in the Mixed Events model."
- Mild cognitive impairment (MCI): A clinical stage with measurable cognitive decline not severe enough to meet dementia criteria. "ADNI is an open-access database containing imaging, clinical, and biomarker data from subjects diagnosed with AD, mild cognitive impairment (MCI), and cognitively normal (CN) individuals (reference group)."
- Mini-Mental Stage Examination (MMSE): A brief standardized cognitive test used to assess global cognitive function. "Additionally, we evaluated the relationship between SuStaIn stage and cognition by correlating stage with Mini-Mental Stage Examination (MMSE), stratified by subtype, using Pearson's correlation."
- Mixed Events model: A generalized disease progression model that jointly handles binary, ordinal, and continuous (z-score) biomarker events. "To address this limitation, we propose the Mixed Events model, a novel disease progression model that handles both discrete and continuous data types."
- Mixed-SuStaIn: The implementation of the Mixed Events model within SuStaIn to infer subtypes and stages from mixed data. "This model is implemented within the Subtype and Stage Inference (SuStaIn) framework, resulting in Mixed-SuStaIn, enabling subtype and progression modeling."
- Ordinal (scored events) model: A progression model where biomarkers move through ordered categorical levels reflecting disease severity. "In the ordinal (scored events) model \cite{young_ordinal_2021}, ordinal biomarkers transition to a progressively higher score."
- Pearson's correlation: A measure of linear association between two continuous variables. "Additionally, we evaluated the relationship between SuStaIn stage and cognition by correlating stage with Mini-Mental Stage Examination (MMSE), stratified by subtype, using Pearson's correlation."
- Phenotypic heterogeneity: Variation in observable disease characteristics across individuals, motivating multiple trajectory modeling. "While early models focused on a single disease trajectory, recent approaches estimate multiple trajectories to account for phenotypic heterogeneity, in addition to temporal heterogeneity"
- Phosphorylated tau (p-tau): A CSF biomarker reflecting tau pathology associated with neurodegeneration. "The CSF measures amyloid-, phosphorylated tau (p-tau) and total tau (t-tau) were included as binary biomarkers in the model, as these measures exhibit relatively well-defined thresholds that separate normal from abnormal values."
- Piecewise linear z-score model: A model where biomarker trajectories increase linearly across predefined z-score levels. "The key innovation is a novel formulation of the likelihood function that enables integration of the likelihoods of the piecewise linear z-score model, the event-based model, and the scored events model into a single objective function for estimating the event ordering."
- Subtype and Stage Inference (SuStaIn): A framework that infers distinct disease subtypes and their stage-specific progression patterns. "This model is implemented within the Subtype and Stage Inference (SuStaIn) framework, resulting in Mixed-SuStaIn, enabling subtype and progression modeling."
- Total tau (t-tau): A CSF biomarker indicating overall tau protein levels associated with neurodegeneration. "The CSF measures amyloid-, phosphorylated tau (p-tau) and total tau (t-tau) were included as binary biomarkers in the model, as these measures exhibit relatively well-defined thresholds that separate normal from abnormal values."
- Ventricles: Fluid-filled brain cavities that typically enlarge with neurodegeneration; can serve as an imaging biomarker. "Volumes were z-scored using CN participants as the reference group and corrected for age and intracranial volume, and log-transformed for ventricles."
- Z-max: The maximum z-score level at which a biomarker trajectory saturates in the piecewise linear model. "The z-scores accumulate at z-max at stage , both -values and z-max are defined by the user."
- Z-score: A standardized value indicating how many standard deviations a measurement lies from a reference mean. "Biomarker values transformed to z-scores based on a Gaussian reference distribution"
Collections
Sign up for free to add this paper to one or more collections.