The Potential of Copernicus Satellites for Disaster Response: Retrieving Building Damage from Sentinel-1 and Sentinel-2
Abstract: Natural disasters demand rapid damage assessment to guide humanitarian response. Here, we investigate whether medium-resolution Earth observation images from the Copernicus program can support building damage assessment, complementing very-high resolution imagery with often limited availability. We introduce xBD-S12, a dataset of 10,315 pre- and post-disaster image pairs from both Sentinel-1 and Sentinel-2, spatially and temporally aligned with the established xBD benchmark. In a series of experiments, we demonstrate that building damage can be detected and mapped rather well in many disaster scenarios, despite the moderate 10$\,$m ground sampling distance. We also find that, for damage mapping at that resolution, architectural sophistication does not seem to bring much advantage: more complex model architectures tend to struggle with generalization to unseen disasters, and geospatial foundation models bring little practical benefit. Our results suggest that Copernicus images are a viable data source for rapid, wide-area damage assessment and could play an important role alongside VHR imagery. We release the xBD-S12 dataset, code, and trained models to support further research.
Paper Prompts
Sign up for free to create and run prompts on this paper using GPT-5.
Top Community Prompts
Explain it Like I'm 14
Explaining “The Potential of Copernicus Satellites for Disaster Response: Retrieving Building Damage from Sentinel-1 and Sentinel-2”
Overview: What is this paper about?
This paper explores how free, global satellite images from the European Copernicus program (Sentinel-1 and Sentinel-2) can help quickly spot buildings damaged by disasters like floods, wildfires, hurricanes, and earthquakes. The big idea: even though these satellites don’t see tiny details (each pixel shows about a 10-meter area), they might still be good enough to map damage fast and over large areas—especially when higher-detail images aren’t available right away.
What questions are the researchers asking?
The study focuses on a few simple questions:
- Can medium-detail satellites (Sentinel-1 radar and Sentinel-2 optical/color) detect where buildings are damaged after a disaster?
- How well does this work for different types of disasters (fires vs. floods vs. earthquakes, etc.)?
- Do fancy, complex AI models help, or are simpler models better for this job?
- Are huge “foundation models” (giant AI models trained on tons of satellite data) actually useful here?
How did they do it?
To make this test fair and realistic, the team did three main things.
- Built a new dataset (xBD-S12):
- They started with a popular, high-detail disaster dataset called xBD, which includes “before and after” images and building damage labels.
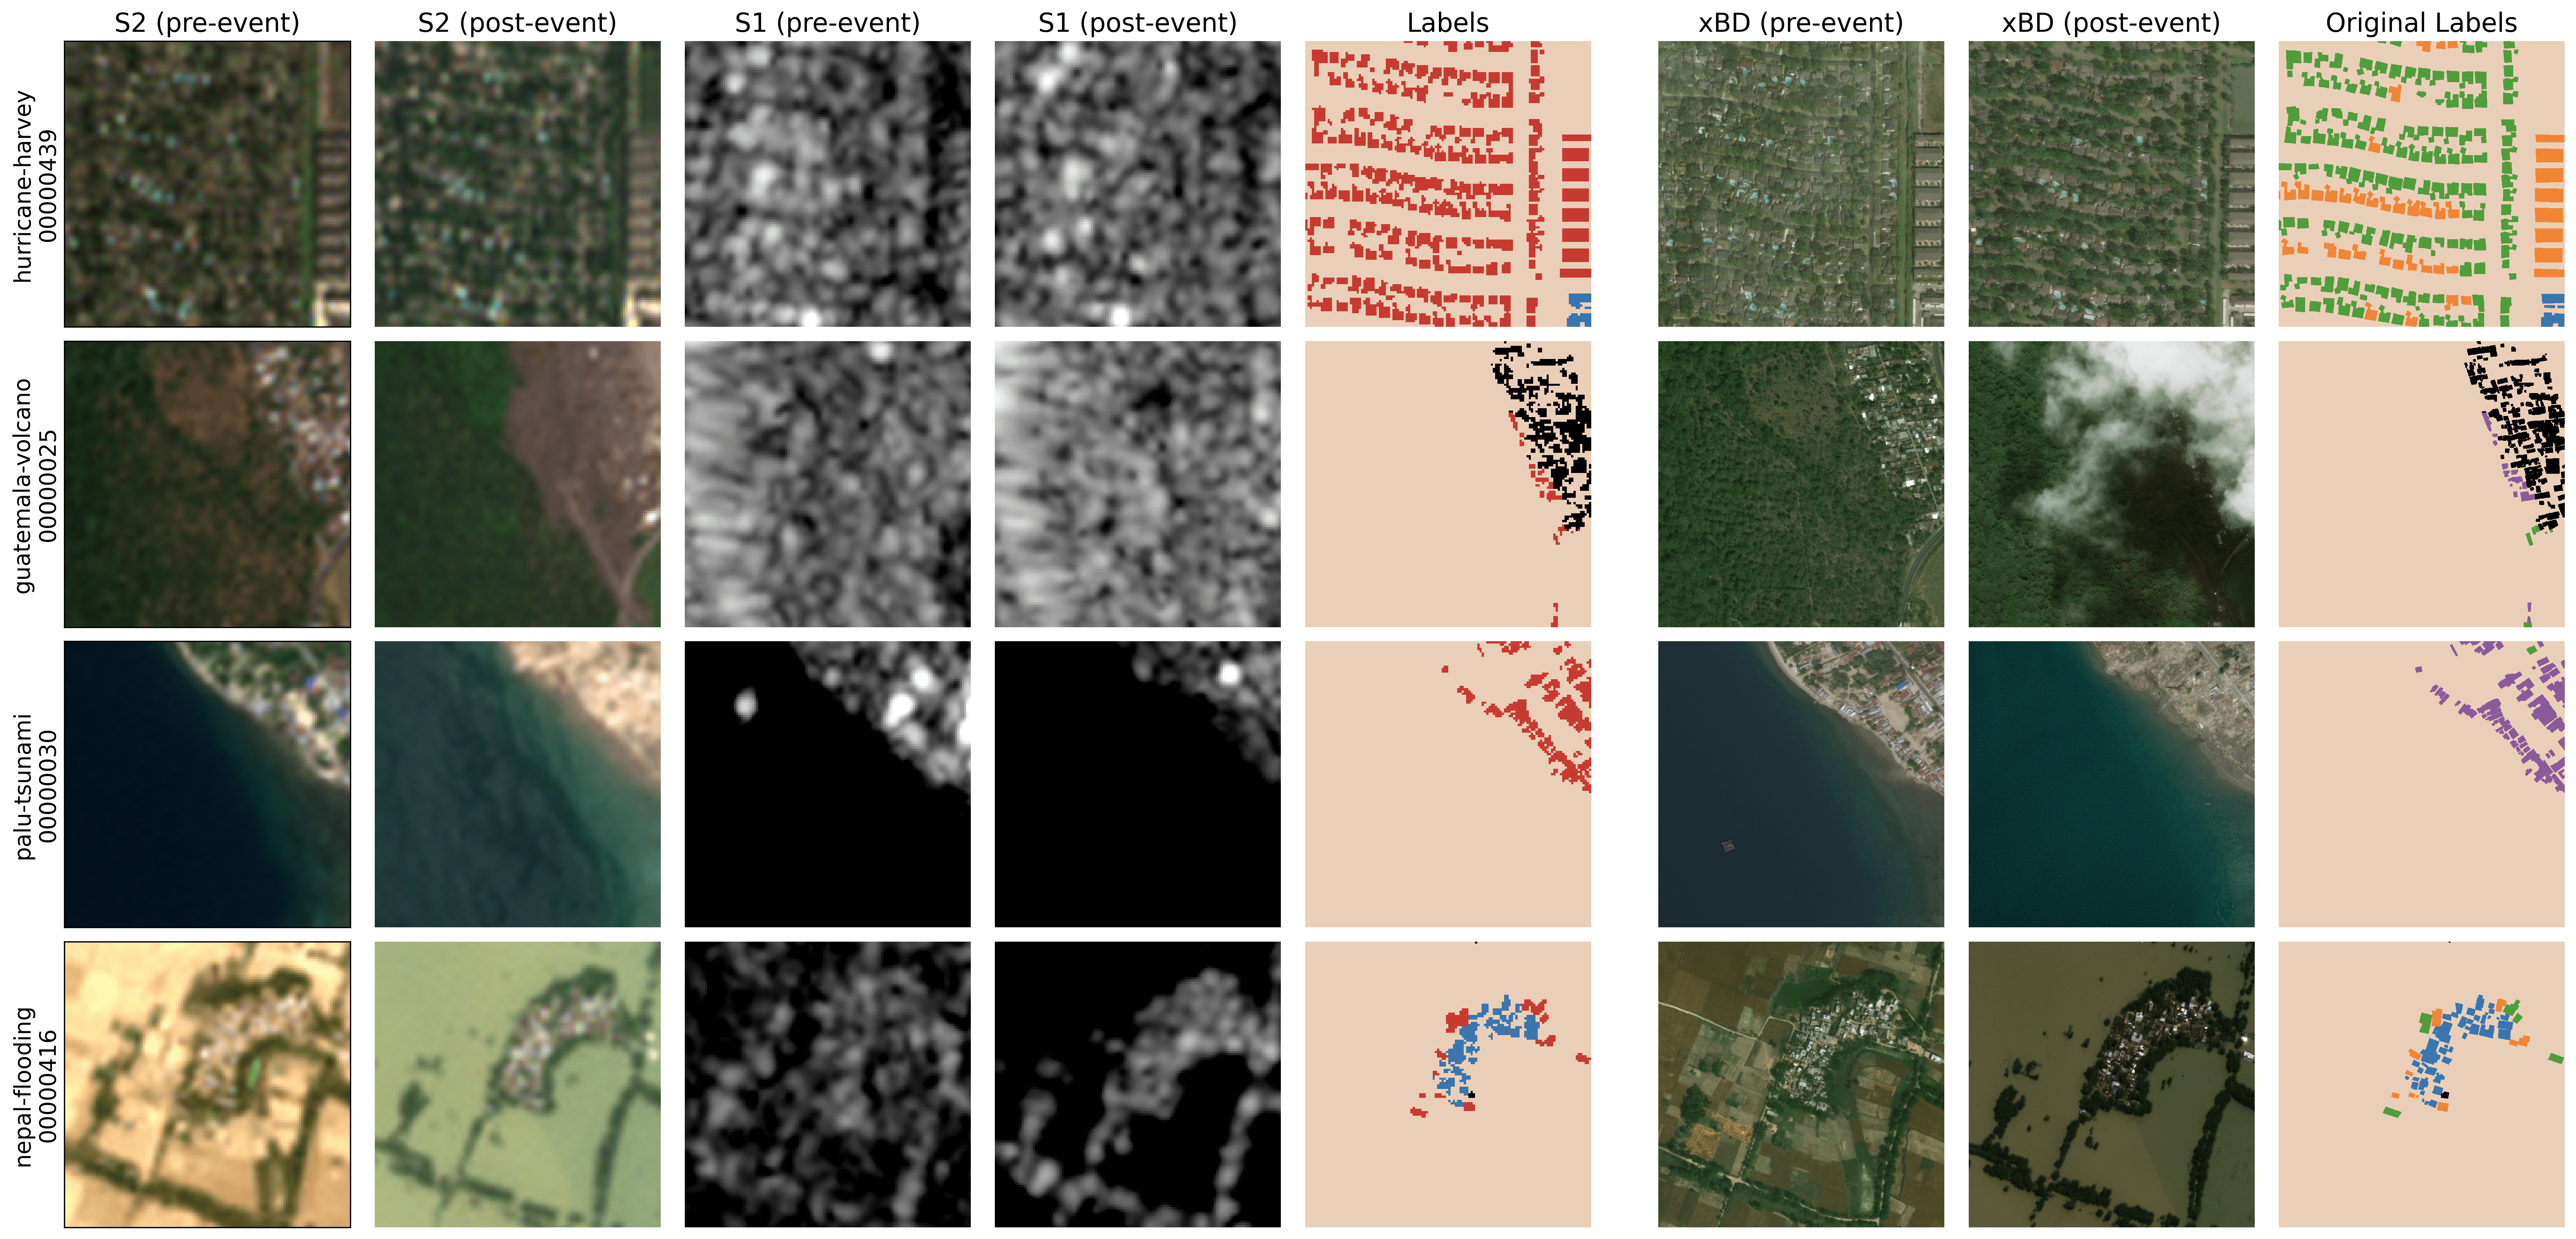
- They matched each of those high-detail image pairs with lower-detail Sentinel-1 and Sentinel-2 pairs taken around the same time and place.
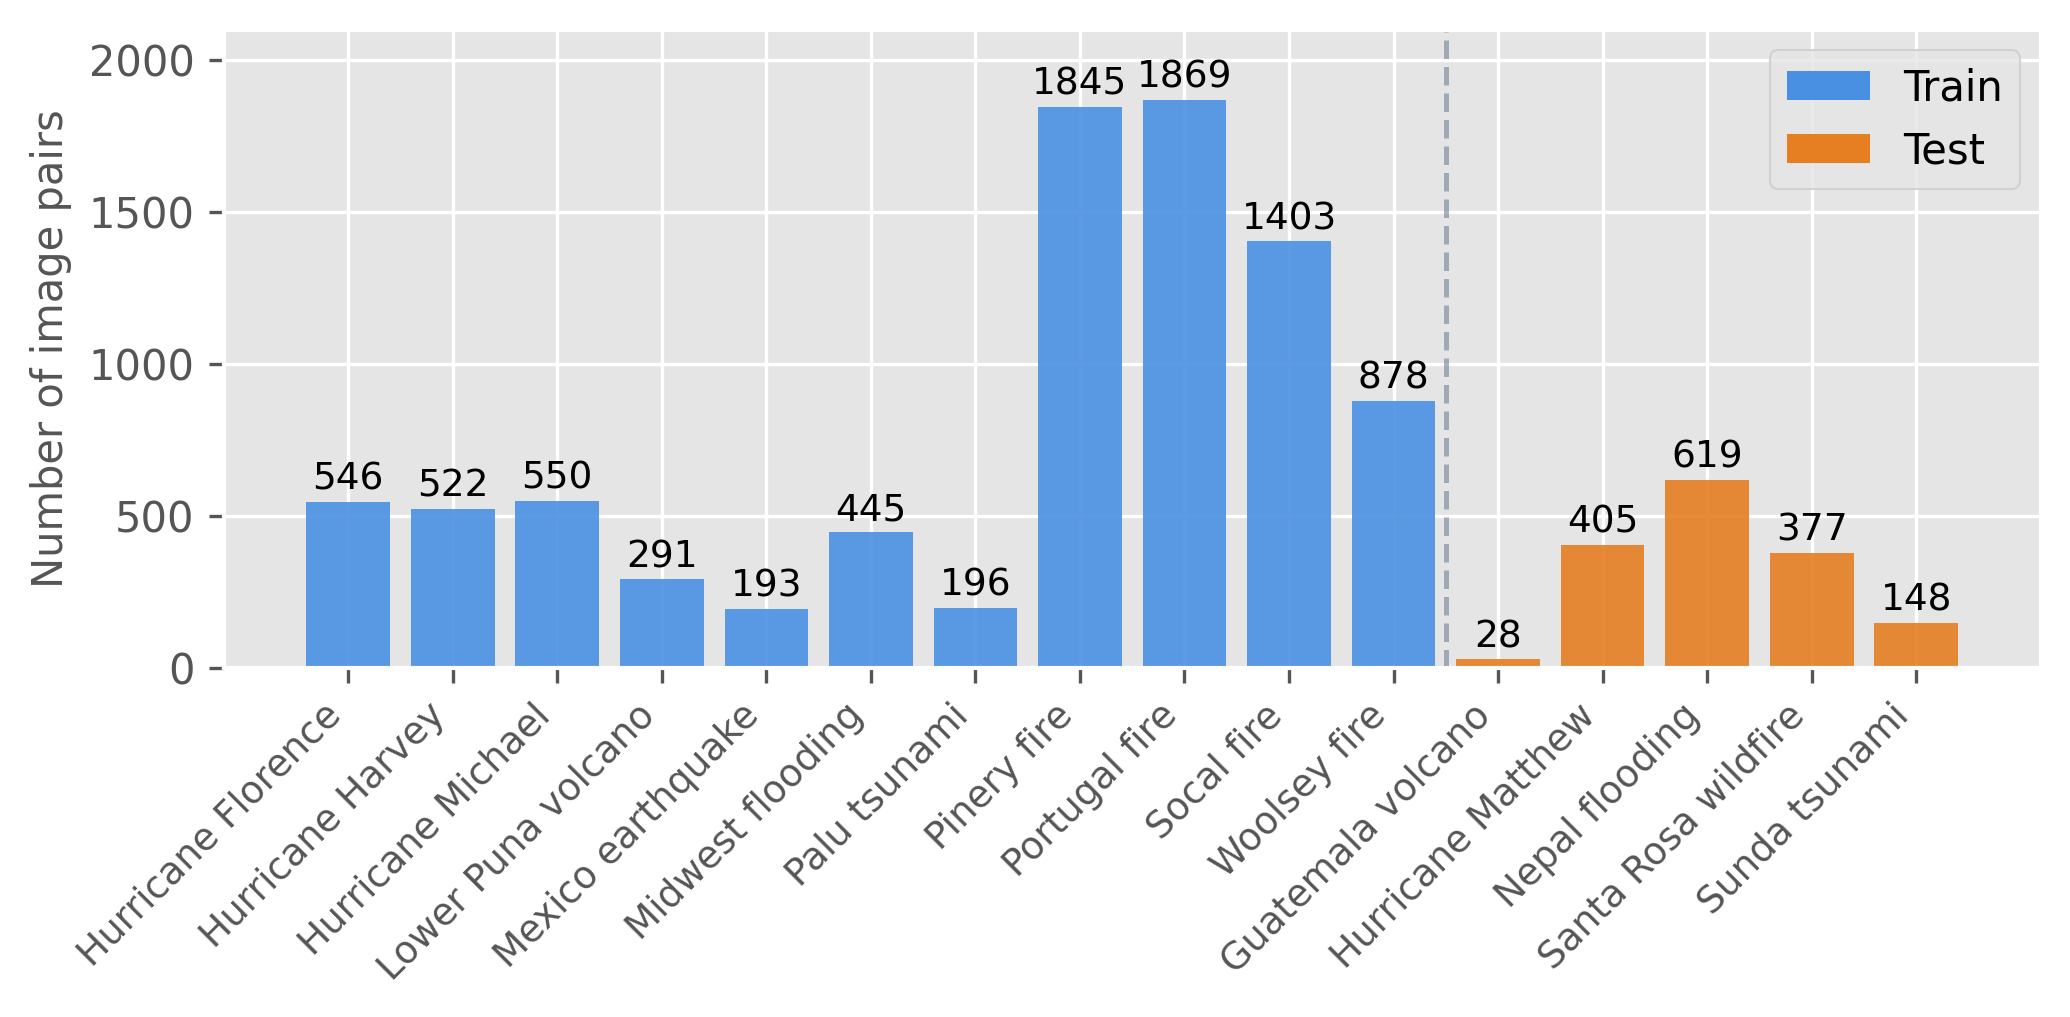
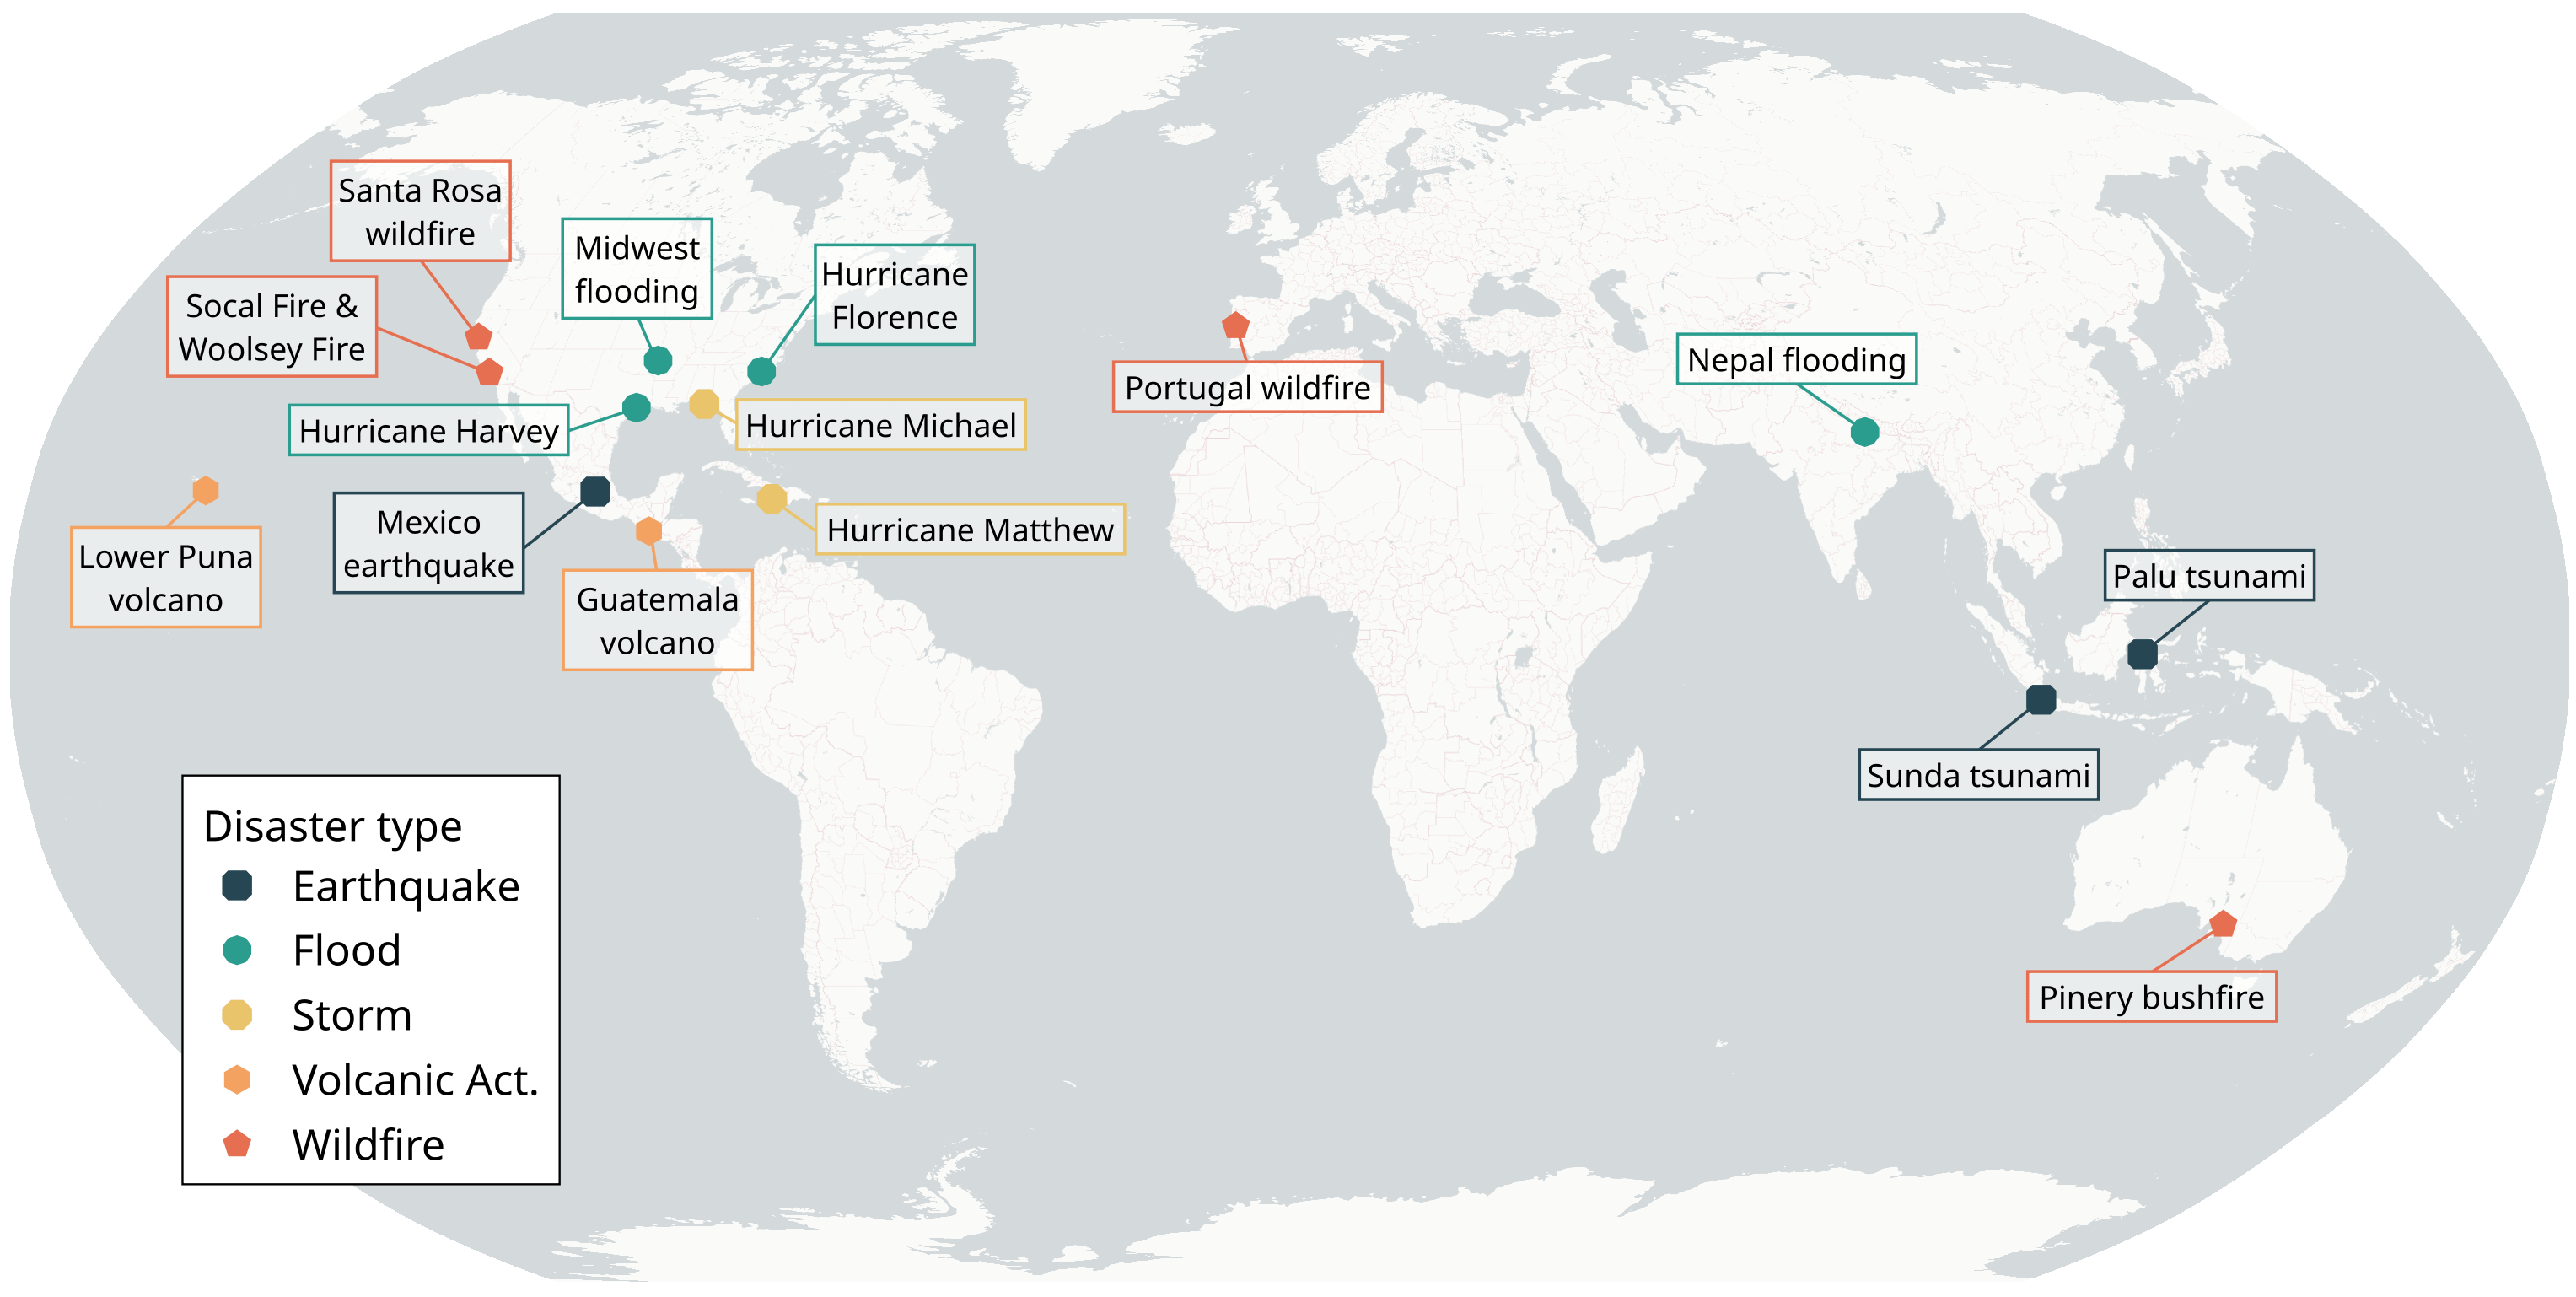
- Result: 10,315 aligned “before/after” pairs from 16 disasters, ready for training and testing AI. They also fixed location alignment errors from the original data.
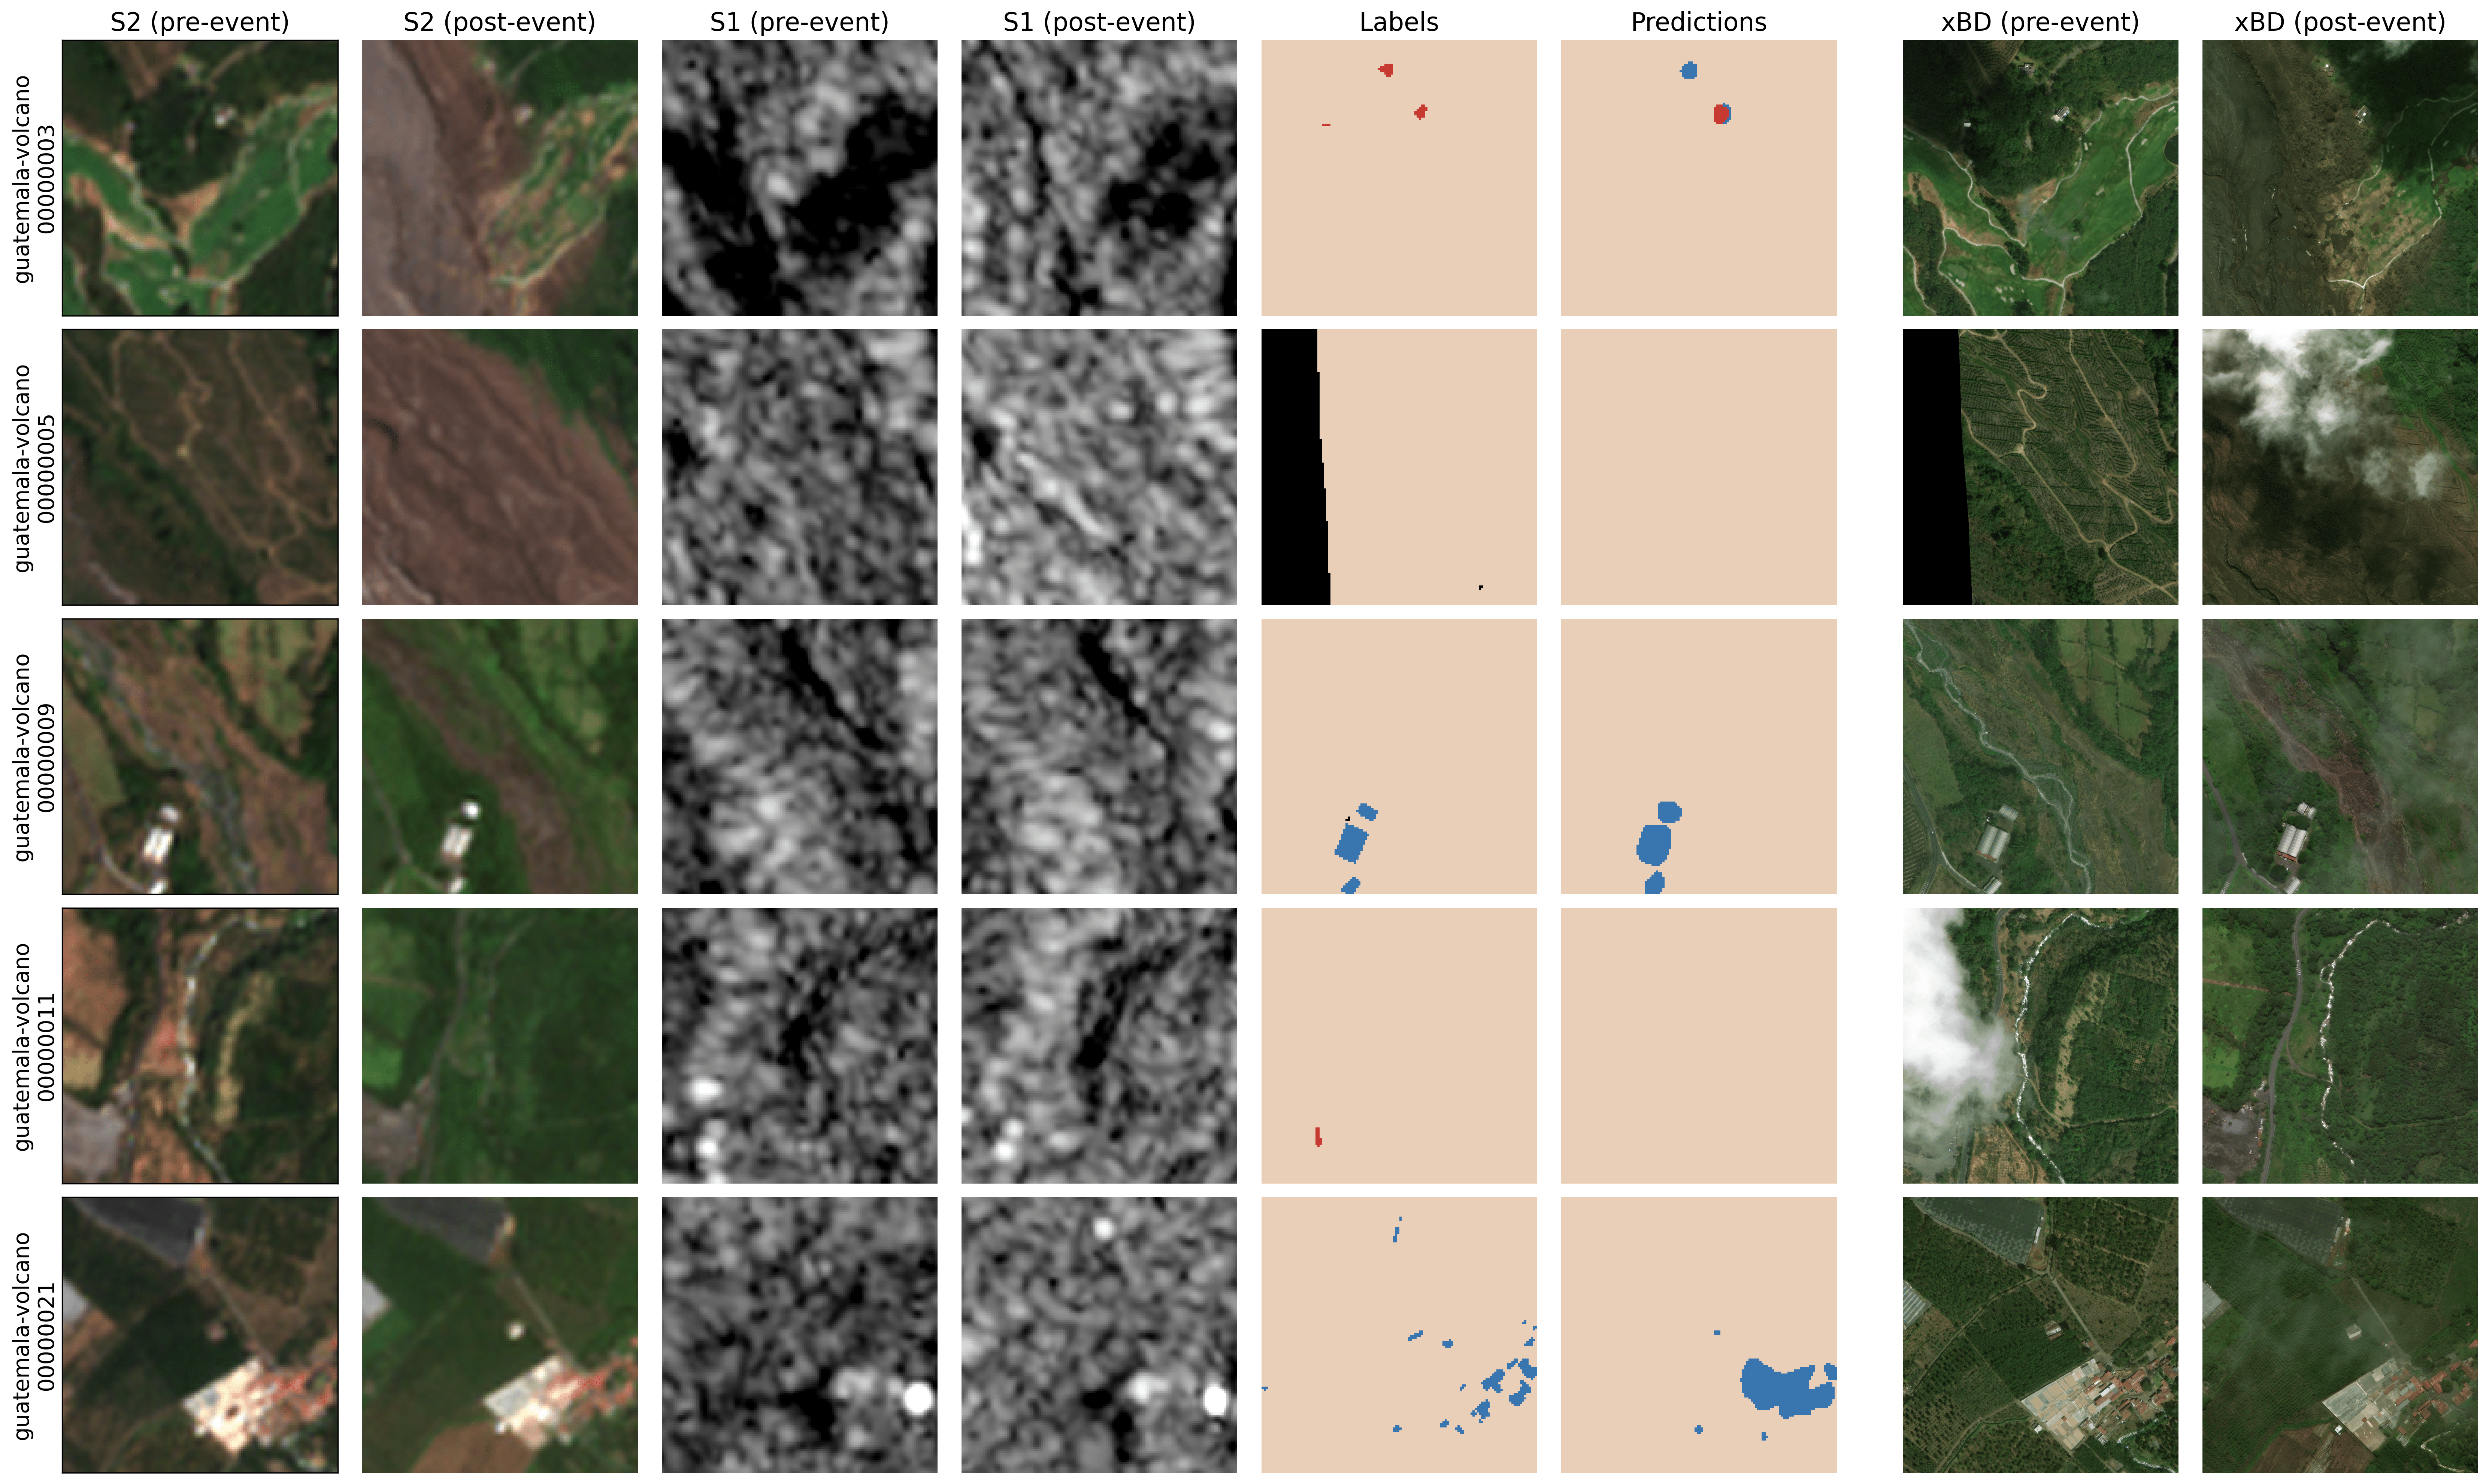
- Used two kinds of satellite “eyes”:
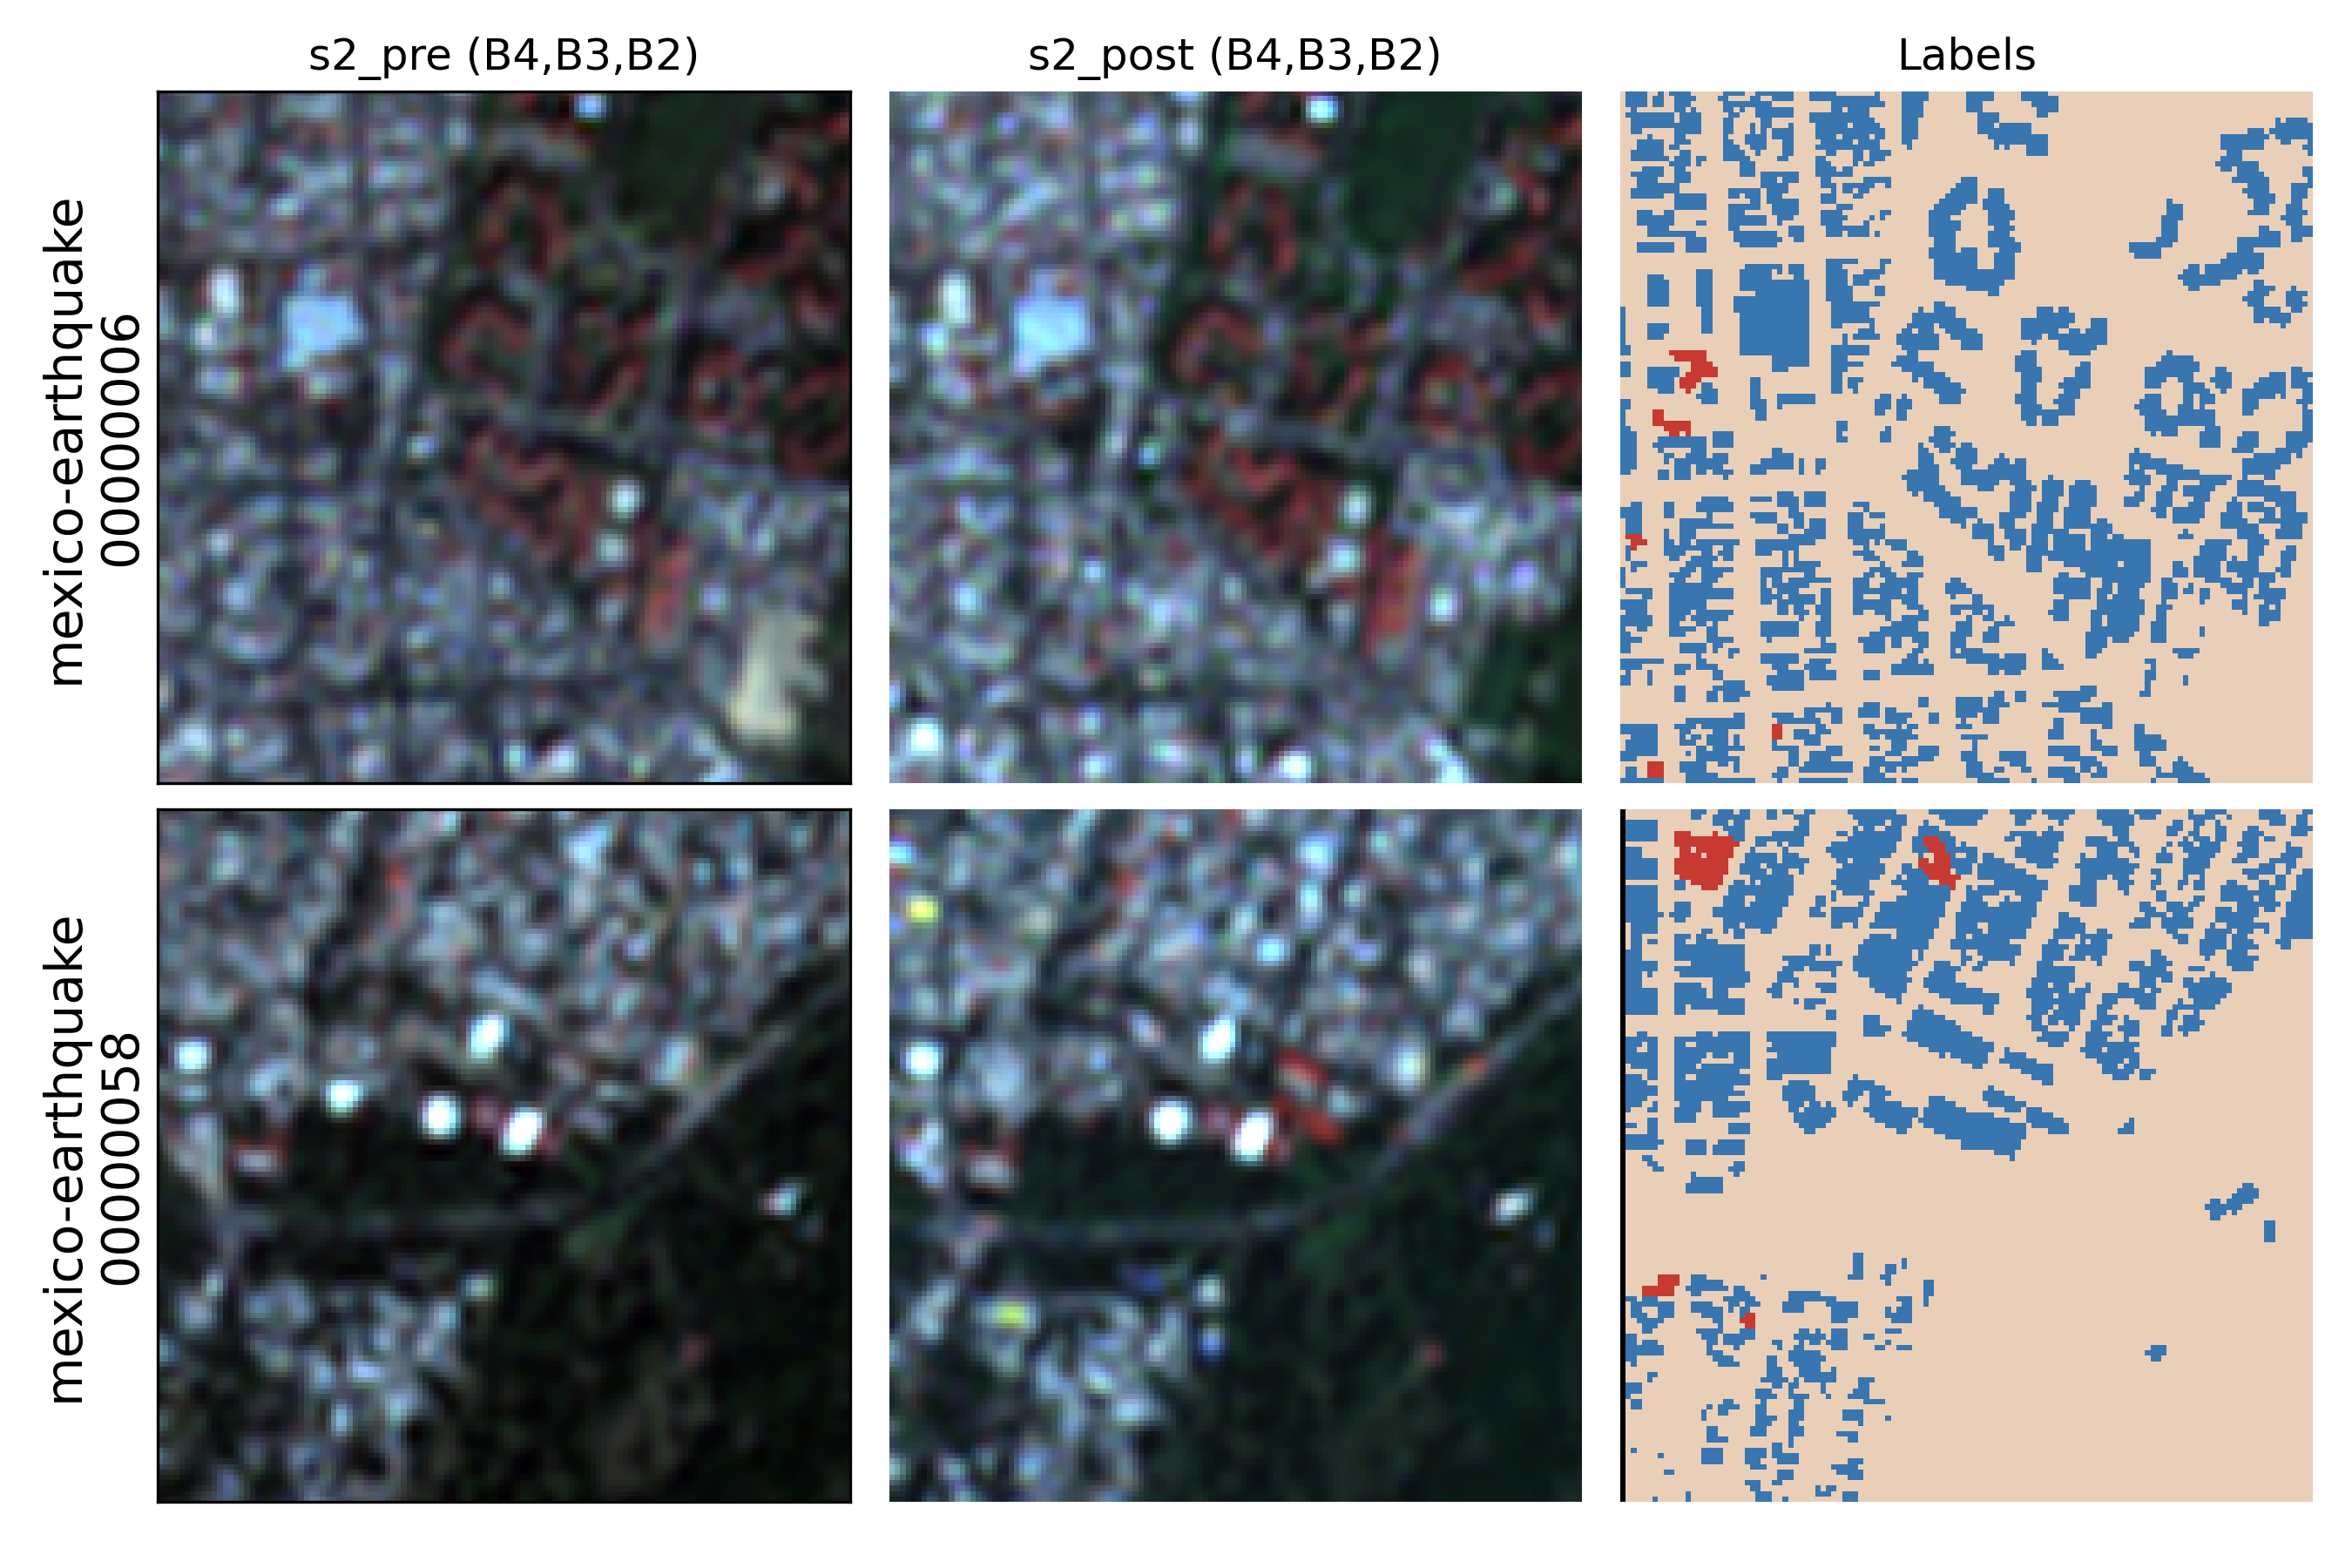
- Sentinel-2 (optical): like a normal camera from space—great for seeing colors and burn marks, but blocked by clouds.
- Sentinel-1 (radar): like a space “flashlight” that sees shapes and surfaces through clouds and at night.
Think of it like comparing two types of “before and after” photos: one shows color changes (burns, water), the other shows surface changes (roughness, structure).
- Trained AI models to map buildings and damage:
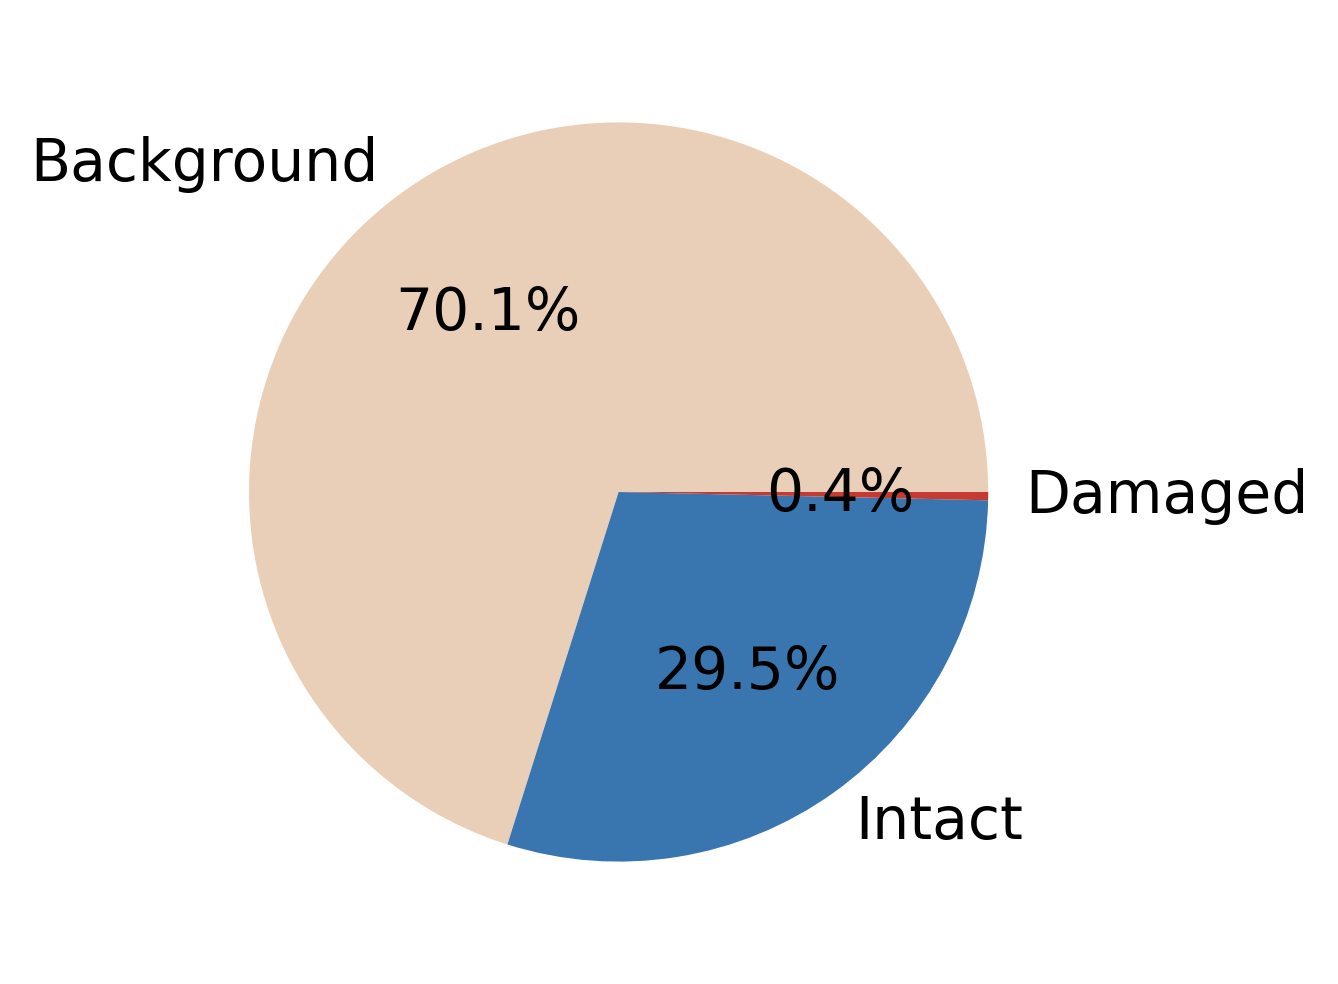
- They simplified the task to three classes: background, intact building, and damaged building (combining minor/major/destroyed into a single “damaged” class—because at 10 m per pixel, splitting damage types is unrealistic).
- Two strategies:
- Two-step: first find buildings, then mark which of those are damaged.
- One-step: predict intact vs. damaged directly.
- They tried “early fusion” (mix all input images first) and “late fusion” (analyze before and after separately, then combine).
- They compared simple models with fancier ones (like Transformers and state-space models) and also tested big geospatial foundation models.
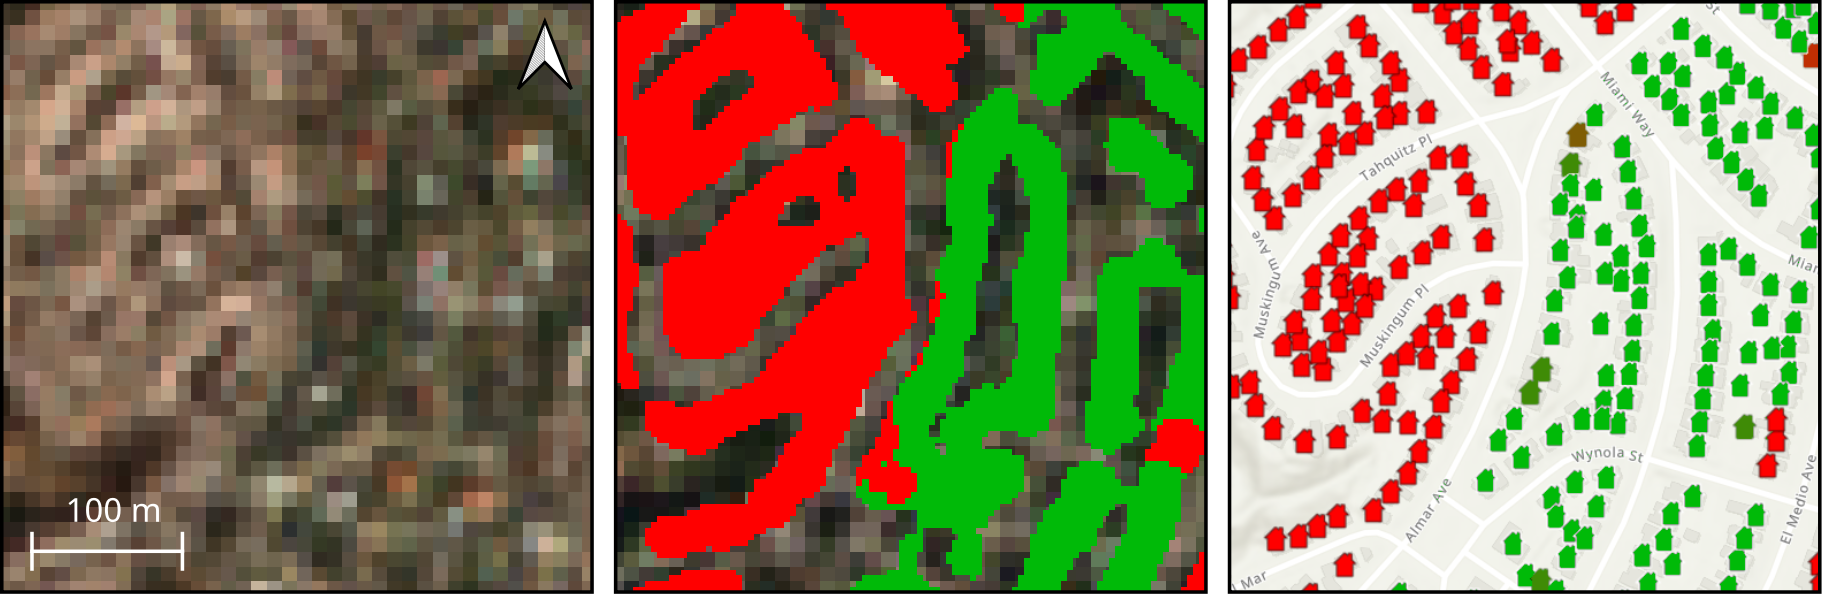
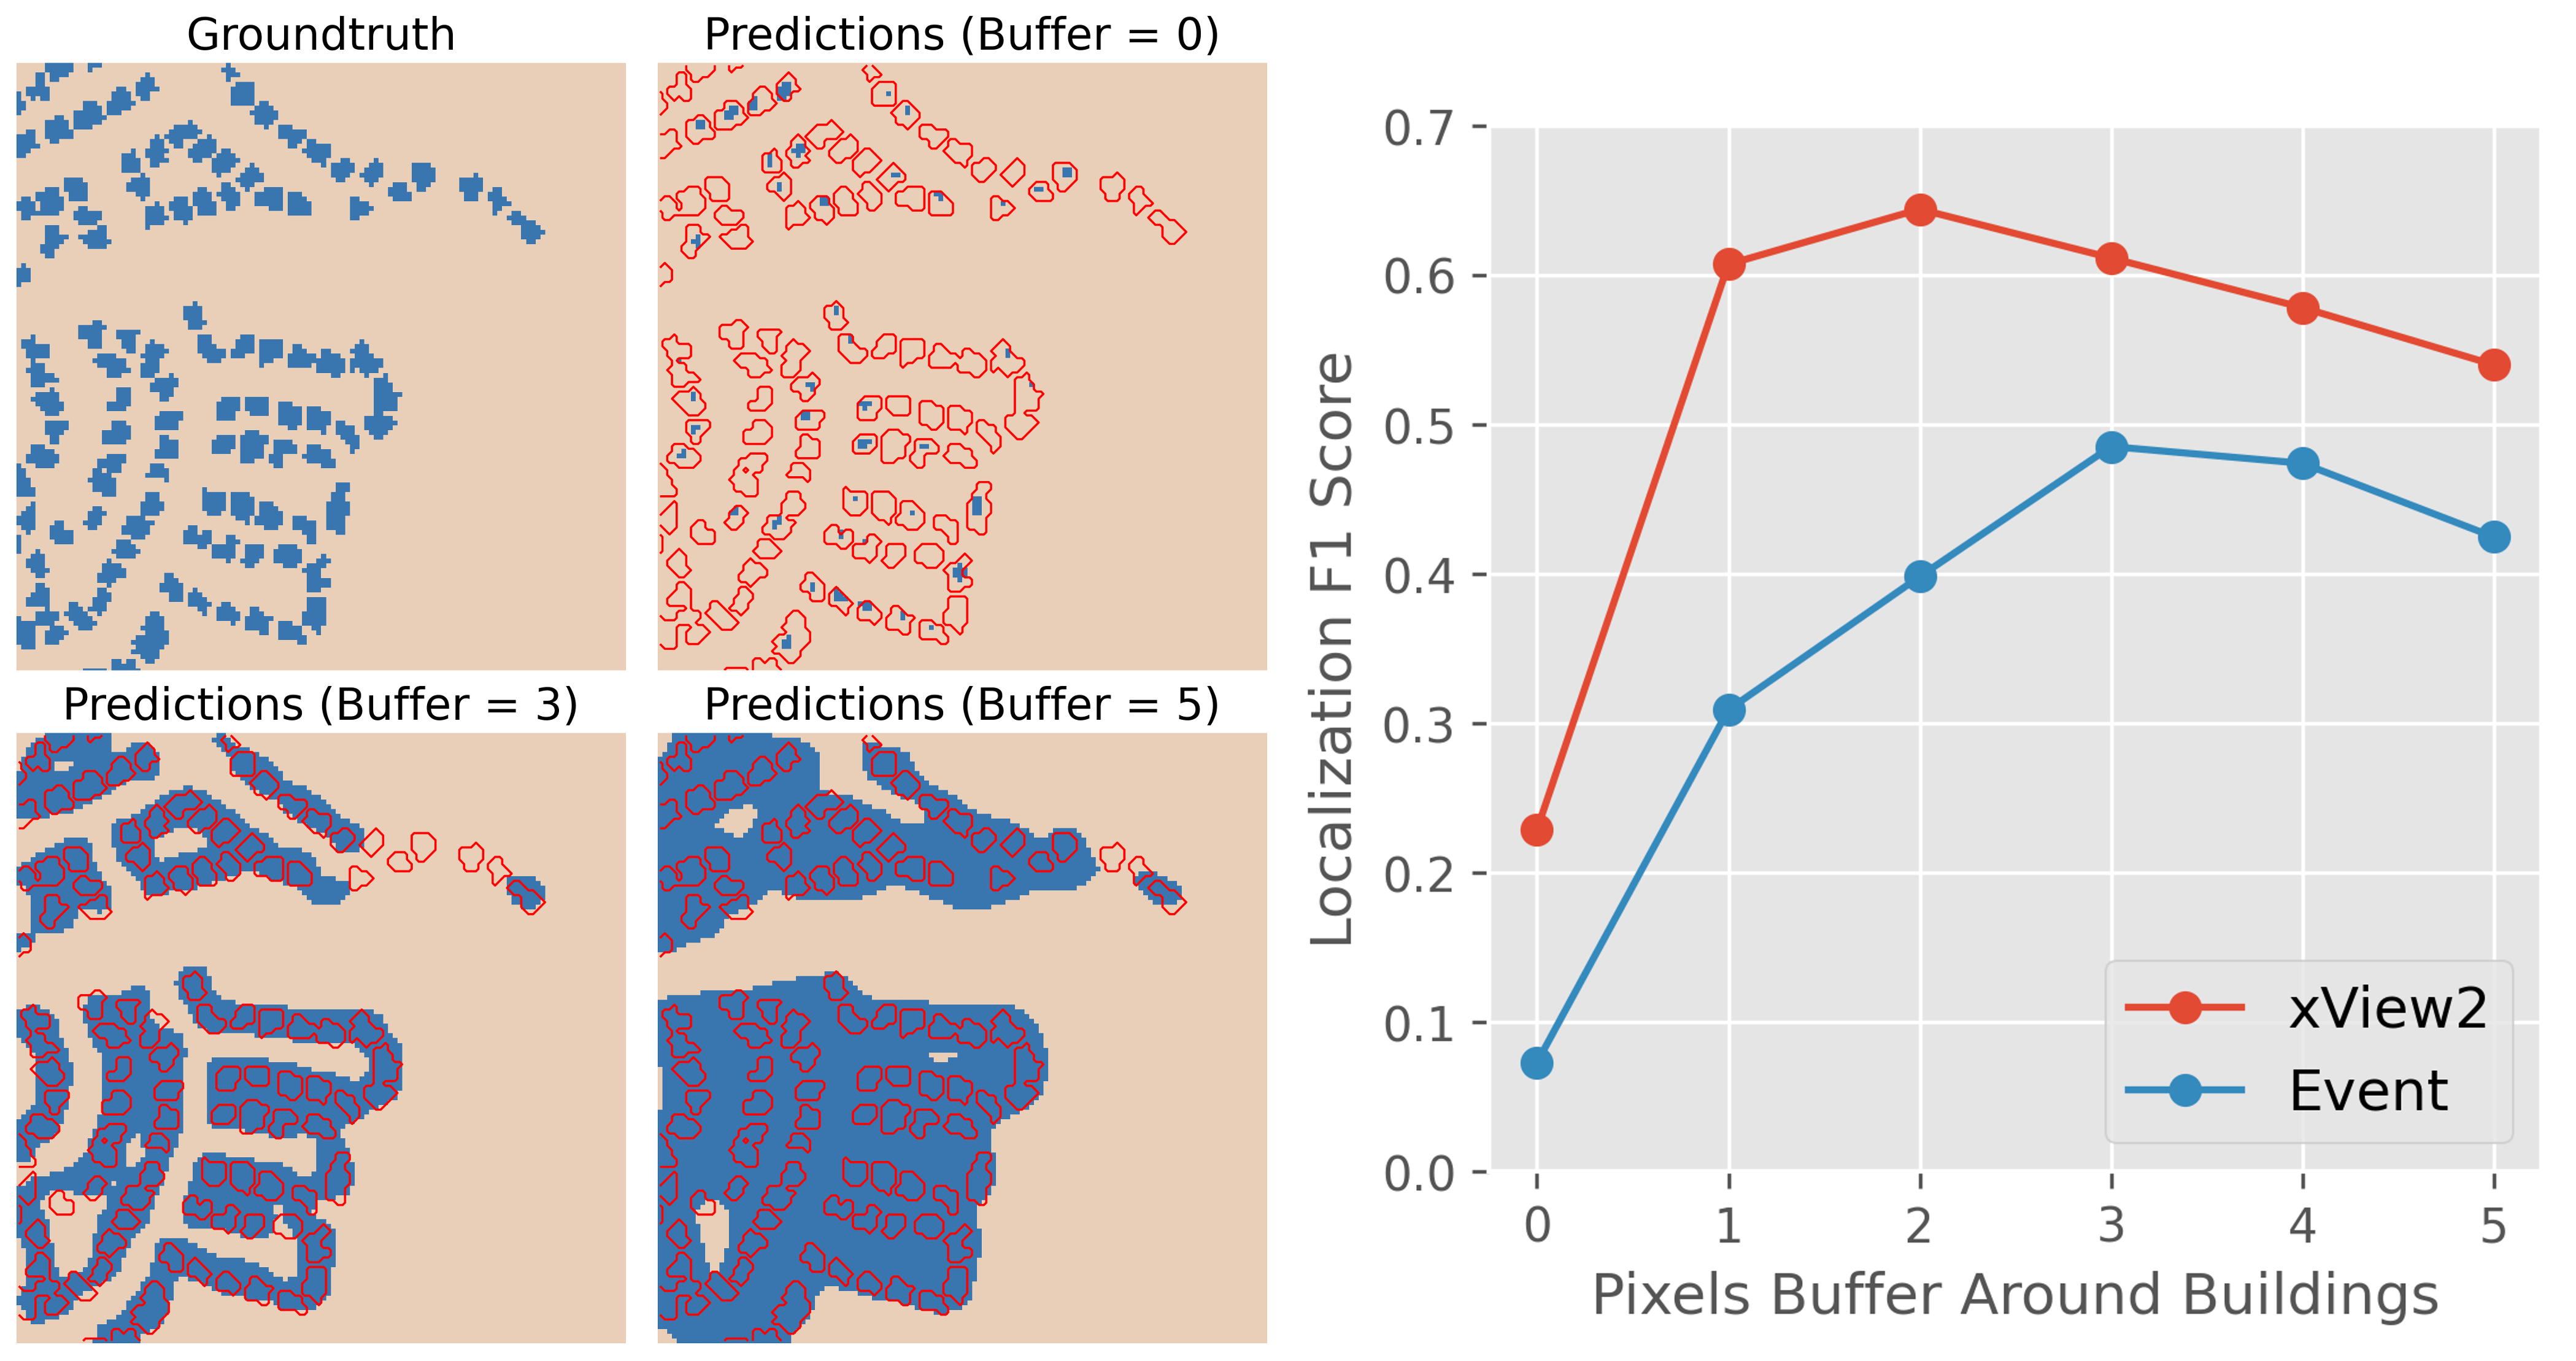
To handle fuzziness at 10 m resolution, they allowed a small “soft border” around building outlines during training, so the model wouldn’t be punished for slightly over- or under-shooting edges. This is like grading with a bit of tolerance around the edges because buildings are only a few pixels wide.
What did they find, and why does it matter?
Here are the main takeaways:
- It works surprisingly well for many disasters:
- Wildfires and floods: very good performance. These disasters change large areas in clear ways (burn scars, floodwater), which are easy to see at 10 m resolution.
- Tsunamis: also promising where damage is widespread.
- Hurricanes: mixed results—damage can be scattered and harder to spot.
- Small earthquakes in dense cities: poor results—small, isolated building damages are too tiny to see reliably at this resolution.
- Simpler models often generalize better:
- Complex, advanced AI models did great on disasters similar to what they were trained on, but they struggled on new, unseen disasters.
- The simpler two-step approach (find buildings, then find damaged ones) usually held up better when applied to new places/events.
- Big “foundation models” didn’t help much here:
- These huge pre-trained models didn’t provide clear advantages for this task, especially when the goal is fine-grained building mapping at 10 m resolution.
- They did okay at broad changes (like burned areas), but not at precisely locating buildings or damage.
- Using both “before” and “after” images helps:
- Feeding both time points (multi-time) improved building detection, especially in new regions where lighting and weather differ.
- A small “fuzzy edge” around buildings improves recall:
- Allowing a buffer during training led the model to slightly “overdraw” buildings—this is acceptable in emergencies because it reduces the chance of missing truly damaged buildings.
- Real-world check:
- They tested their model on a recent California wildfire outside the dataset. The damage map matched very well with official assessments, suggesting this approach can work in the real world.
Why this matters:
- Copernicus (Sentinel-1/2) data are free, global, and frequent. This makes it possible to produce fast, large-area damage maps soon after a disaster—especially when very-high-resolution imagery (the super-detailed kind) isn’t available yet.
What’s the impact? What could this change?
- Faster responses: Emergency teams could quickly get a “big picture” of where damage is concentrated, helping them prioritize areas for rescue and aid.
- Complements high-detail images: Sentinel-1/2 won’t replace sharper satellites, but they’re great for early, wide-area screening. High-detail images can then be used for detailed counting and confirmation.
- Practical tools and data: The authors released their dataset (xBD-S12), code, and trained models so others can build on this.
What’s next:
- Adding more time steps (longer “before and after” history) could improve accuracy.
- Using special radar products (like InSAR coherence) might help detect structural changes better.
- When building maps (footprints) already exist (for example from national databases), it’s better to use those and focus just on classifying damage, since finding buildings is the weakest step at 10 m resolution.
- Foundation models may improve in the future, but right now they bring limited benefits to this specific problem.
In short: Free Copernicus satellites can already help map disaster damage quickly across large areas. They are best for big, obvious changes (fires, floods) and less suited to tiny, scattered damage (like small earthquake impacts in dense cities). Used together with higher-resolution images and existing building maps, they can make disaster response faster and smarter.
Knowledge Gaps
Knowledge gaps, limitations, and open questions
Below is a concise list of unresolved issues and concrete research directions arising from the paper.
- Dataset coverage and representativeness
- The xBD-S12 dataset covers 16 disasters (excludes tornadoes and many geographies/building typologies); it is unclear how well models generalize across broader hazard types, regions, construction materials, and urban morphologies.
- Hurricanes and earthquakes remain underrepresented for robust training and evaluation; targeted curation of additional events is needed.
- Lack of explicit VHR–Copernicus performance trade-off
- No direct, quantitative comparison to VHR-based baselines on the same events to characterize the accuracy gap, conditions where 10 m imagery suffices, and where it fails.
- Modality ablation and sensor-specific effects are untested
- No systematic ablation of Sentinel-1 vs Sentinel-2 contributions per hazard; the marginal utility of each modality remains unknown.
- The impact of Sentinel-1 orbit direction (ascending vs descending), incidence angle differences, and polarization choices (VV vs VH) on performance and generalization is not quantified.
- No robustness analysis for scenarios where one modality is missing (e.g., cloudy S2 or absent S1).
- SAR interferometric and advanced SAR features are not leveraged
- The study uses only GRD amplitudes; the potential gains from InSAR coherence/phase, polarimetric features, or damage proxy maps remain unexplored.
- Temporal dimension underutilization
- Models rely on single pre/post pairs; it is unknown how longer multi-temporal series (pre- and post-event) affect robustness, latency, and accuracy across hazards.
- Optimal temporal windows per hazard (e.g., for floods vs fires) are not characterized.
- Building footprint dependency and isolation of classification ability
- Damage classification is not evaluated under an “oracle footprint” setting to isolate classification from localization errors.
- The operational scenario with externally available footprints (e.g., national cadastres/Overture) is not quantified; the potential performance jump when supplying footprints is unknown.
- Coregistration uncertainty and sensitivity
- While xBD georeferencing was corrected, residual misregistration between Sentinel pre/post, between S1 and S2, and with labels is not measured; model sensitivity to misalignment (and to the proposed buffer) is not quantified.
- Label quality and class definition limitations
- Merging four xBD damage levels into a binary damaged/intact label avoids ambiguity but leaves open whether finer-grained severity mapping is feasible at 10 m with auxiliary signals (e.g., SAR coherence).
- No analysis of annotation noise, inter-annotator variability, or label transfer errors from VHR to 10 m and their impact on learning.
- Evaluation metrics and decision support
- Pixel-level F1 and the xView2 competition score are reported, but per-building, per-parcel, or aggregated (neighborhood/admin-unit) metrics relevant for operations are missing.
- No uncertainty quantification, calibration, or risk-aware thresholds are provided for actionable decision-making.
- Foundation model usage is limited
- Only frozen-backbone GeoFMs (Prithvi, DOFA) are tested; the benefits of full or parameter-efficient fine-tuning (e.g., LoRA/adapters), multi-task pretraining for change detection, or task-specific prompts remain unknown.
- No exploration of vision-LLMs (VLMs) to integrate textual disaster context or analyst feedback.
- Domain shift handling and augmentation
- No explicit domain adaptation or harmonization across seasons, atmospheric conditions, sensors, and urban forms; augmentation is minimal and not tailored to SAR/optical domain shifts.
- Failure modes across land-cover types, urban density, roof materials, and cultural building styles are not analyzed.
- Preprocessing choices not ablated
- The effects of SAR speckle filtering, incidence-angle normalization, and alternative terrain/topographic corrections (beyond GEE defaults) are not evaluated.
- Radiometric standardization choices for S2 and S1 across scenes are not compared.
- Input resolution and multi-scale context
- Patches are upsampled to an effective ~4 m without a systematic study of spatial scale; the utility of learned super-resolution, multi-scale encoders, or context windows larger than 128×128 is unknown.
- Operational and computational considerations
- Inference speed, memory/compute footprint, and end-to-end latency (tasking-to-map) are not reported; scalability to continental/global mapping remains unquantified.
- No strategies for gap-filling (e.g., cloudy S2) or confidence-aware outputs under partial data availability.
- Integration of auxiliary geospatial data
- DEM/terrain, land cover, road graphs, nightlights, and prior building inventories are not used; their potential to stabilize building localization at 10 m is untested.
- Hazard-aware modeling
- FiLM-based conditioning was ineffective in this setup; alternative hazard-aware strategies (meta-learning, minimal descriptors, meteorological/impact footprints) and when to use them remain open.
- Buffer strategy calibration
- A fixed 3-pixel buffer improves F1_loc but inflates footprints; adaptive buffer policies based on urban density/building size, and per-building recall/precision trade-offs are not quantified.
- External validation breadth
- Only one qualitative external case (Palisades fire) is shown; broader, quantitative validations with independent agency datasets across regions/hazards are needed.
- Risk and human-in-the-loop considerations
- The paper does not address risk management for false negatives/positives in operational workflows or propose human-in-the-loop triage and verification protocols.
Glossary
- Affine transformation: A linear mapping that preserves points, straight lines, and planes, used to correct spatial misalignments between datasets. "We correct the coregistration, using the building footprints as ground control to fit an affine transformation."
- AnySAT: A geospatial foundation model trained on large-scale satellite data to learn generalizable image representations. "Large, pre-trained models like Clay, DOFA, Prithvi, or AnySAT promise generalizable representations, learned from vast amounts of unlabeled satellite data."
- Ascending/descending orbits: Satellite pass directions; ascending moves northward, descending southward, affecting viewing geometry. "We also require the pre- and post-event Sentinel-1 images to share the same orbit direction, since ascending and descending orbits lead to very different viewing geometries of the same area."
- Bi-temporal acquisitions: Using paired images from two time points (pre- and post-event) for change analysis. "Our approach deliberately prioritizes simplicity and accessibility, using only standard GRD products from Sentinel-1 and bi-temporal acquisitions."
- Building footprints: Polygonal outlines of buildings used for localization and damage annotation. "From the original tiles, the authors selected the relevant patches and contracted a commercial service to manually annotate building footprints and corresponding damage levels."
- Change detection: Identifying differences between multi-temporal images to infer changes (e.g., damage). "ChangeOS: A deep object-based semantic change detection framework using a partial Siamese encoder with task-aware encoders and decoders."
- ChangeMamba: A change detection architecture based on the Mamba deep state-space model. "ChangeMamba: Change detection based on the Mamba deep state space architecture, designed to enable the global receptive field of Transformers with a lower memory footprint."
- ChangeOS: An object-based semantic change detection framework for building damage assessment. "ChangeOS: A deep object-based semantic change detection framework using a partial Siamese encoder with task-aware encoders and decoders."
- CloudScore+: A cloud coverage metric precomputed for Sentinel-2 imagery, accessible via Google Earth Engine. "We rely on Google’s CloudScore+ for cloud coverage, which has been precomputed for the entire Sentinel-2 archive and is accessible through Google Earth Engine (GEE)."
- Coherence maps: InSAR-derived products measuring phase stability between radar acquisitions, useful for structural change detection. "Future work could... incorporate InSAR products such as coherence maps or damage proxy maps..."
- Competition score: A weighted combination of localization and damage F1 scores used for overall evaluation. "Again following xView2, the localization and damage scores are linearly combined into an overall 'competition score': F1_comp = 0.3·F1_loc + 0.7·F1_dmg."
- Copernicus missions: EU Earth observation program providing global, free satellite data (e.g., Sentinel-1/2). "Specifically, we explore the potential of the Copernicus missions, namely the multispectral imagery from Sentinel-2 and synthetic aperture radar (SAR) data from Sentinel-1, which both offer global coverage with sub-weekly revisits."
- Coregistration: Aligning multiple images so corresponding pixels refer to the same ground location. "We correct the coregistration, using the building footprints as ground control to fit an affine transformation."
- DisasterAdaptiveNet: A damage assessment model that conditions predictions on disaster type using FiLM. "DisasterAdaptiveNet: An extension of the strong baseline that adds a FiLM module to modulate the predictions according to the disaster type."
- DOFA: A geospatial foundation model with a ViT-Base backbone for satellite imagery tasks. "We also test two recent geospatial foundation models: Prithvi-EO-2.0 with 300M parameters, as available in Terratorch, and DOFA with ViT-Base backbone, as implemented in TorchGeo."
- FiLM (Feature-wise Linear Modulation): A conditioning mechanism that modulates features based on auxiliary inputs (e.g., disaster type). "DisasterAdaptiveNet: An extension of the strong baseline that adds a FiLM module to modulate the predictions according to the disaster type."
- Georeferencing errors: Spatial misalignments due to incorrect transformations or metadata, affecting alignment with other data. "Finally, the images in the xBD dataset suffer from georeferencing errors, likely due to an erroneous transformation."
- Geospatial foundation models (GeoFMs): Large pre-trained models for Earth observation tasks, aiming for generalizable features. "In parallel, the broader remote sensing community has embraced geospatial foundation models (GeoFMs)."
- Google Earth Engine (GEE): A cloud platform for planetary-scale geospatial data analysis and access to satellite archives. "We rely on Google’s CloudScore+ for cloud coverage... accessible through Google Earth Engine (GEE)."
- Ground control: Trusted reference data used to anchor and correct spatial alignment. "We correct the coregistration, using the building footprints as ground control to fit an affine transformation."
- Ground Range Detected (GRD): A SAR product with amplitude images projected to ground range and terrain-corrected. "We use the Ground Range Detected (GRD) product available on GEE, which provides log-amplitudes in the VV and VH polarizations, resampled to 10 m."
- Ground sampling distance (GSD): The spatial resolution indicating ground distance represented by each pixel. "Copernicus satellites are surprisingly effective at mapping building damage, despite the moderate GSD of 10 m."
- HRNet (High-Resolution Network): A neural architecture maintaining high-resolution representations throughout the network. "More recently, the field has witnessed the integration of advanced architectures... including high-resolution networks (HRNet)..."
- InSAR (Interferometric Synthetic Aperture Radar): Technique using phase differences between SAR images to measure ground changes. "Future work could... incorporate InSAR products such as coherence maps or damage proxy maps..."
- Lanczos interpolation: A high-quality resampling method using sinc-based kernels for image resizing. "We resample all Sentinel patches to a fixed size of 128×128 pixels with Lanczos interpolation..."
- Late fusion: Combining features after separate encoding of inputs (e.g., pre- and post-event images). "In the late fusion, we use a Siamese design to encode separately the pre- and post-event images through a shared U-Net..."
- Level-2A (Sentinel-2): Surface reflectance products with atmospheric correction and multiple spectral bands. "The level-2A product consists of 12 multispectral bands with native ground sampling distances (GSDs) ranging from 10 m to 60 m."
- Log-amplitudes (SAR): SAR intensity values stored on a logarithmic scale to compress dynamic range. "We use the Ground Range Detected (GRD) product available on GEE, which provides log-amplitudes in the VV and VH polarizations..."
- Mamba (deep state-space model): A sequence modeling architecture enabling global context with efficient memory usage. "ChangeMamba: Change detection based on the Mamba deep state space architecture, designed to enable the global receptive field of Transformers with a lower memory footprint."
- Morphological dilation: An image processing operation expanding regions (e.g., building masks) by adding neighboring pixels. "We apply a morphological dilation to obtain a 3-pixel buffer around the ground truth building footprints..."
- Multispectral bands: Multiple spectral channels (e.g., visible, NIR, SWIR) used to characterize surface properties. "The level-2A product consists of 12 multispectral bands with native ground sampling distances (GSDs) ranging from 10 m to 60 m."
- Φ-down (Phi-down): A tool for downloading original Sentinel-2 .SAFE Level-2A files. "To facilitate access to True Color Image (TCI) products, we download the original .SAFE Sentinel-2 Level-2A files using Φ-down."
- Prithvi: A geospatial foundation model (Prithvi-EO-2.0) pretrained on Earth observation data. "We also test two recent geospatial foundation models: Prithvi-EO-2.0 with 300M parameters..."
- Radiometric calibration: Adjusting sensor measurements to physically meaningful units, correcting instrument effects. "GEE automatically performs standard preprocessing for each tile, namely thermal noise removal, radiometric calibration, and terrain correction."
- SAR (Synthetic Aperture Radar): Active microwave imaging technique capturing backscatter independent of daylight and weather. "Notable examples include... VHR synthetic aperture radar (SAR) imagery..."
- Sentinel-1: Copernicus SAR mission providing global coverage with frequent revisits. "We identify the closest Sentinel-1 acquisitions, again with respect to both the VHR images and the disaster dates."
- Sentinel-2: Copernicus multispectral mission offering 10–60 m bands and global coverage. "To facilitate access to True Color Image (TCI) products, we download the original .SAFE Sentinel-2 Level-2A files..."
- Siamese U-Net: A paired-branch U-Net architecture processing pre- and post-event images for change-based tasks. "The competition's winning solution employed a Siamese U-Net architecture with multiple encoder backbones..."
- Strong baseline: A simplified reference approach used for comparative evaluation in damage mapping. "Strong baseline: A simplified version of the xView2 winning solution, framed as multiple independent binary semantic segmentations."
- Terratorch: A library providing implementations and utilities for geospatial foundation models. "We also test two recent geospatial foundation models: Prithvi-EO-2.0 with 300M parameters, as available in Terratorch..."
- Terrain correction: Geometric correction of SAR data accounting for terrain-induced distortions. "GEE automatically performs standard preprocessing for each tile, namely thermal noise removal, radiometric calibration, and terrain correction."
- Thermal noise removal: Filtering out sensor noise present in SAR data to improve image quality. "GEE automatically performs standard preprocessing for each tile, namely thermal noise removal, radiometric calibration, and terrain correction."
- TorchGeo: A PyTorch library for geospatial deep learning with datasets and models. "and DOFA with ViT-Base backbone, as implemented in TorchGeo."
- True Color Image (TCI): Sentinel-2 visualization product approximating human-visible color composite. "To facilitate access to True Color Image (TCI) products, we download the original .SAFE Sentinel-2 Level-2A files..."
- UperNet: A segmentation decoder architecture used to convert features into pixel-wise labels. "we keep the backbone frozen and only finetune a UperNet to decode the features into segmentation masks."
- Vision-LLMs (VLMs): Models jointly processing images and text to enable natural language interaction with EO data. "Vision-LLMs (VLMs) are another emerging frontier that could change how we interact with Earth observation data."
- Very-high resolution (VHR): Imagery with ≤2 m GSD enabling fine object-level analysis (e.g., buildings). "Beyond rapidly providing an overview of the affected region, very-high resolution (VHR) images with ground sampling distances ≤2 m have been shown to enable the identification of damaged assets..."
- VV/VH polarizations: SAR transmit/receive polarization channels (vertical-vertical, vertical-horizontal) influencing backscatter characteristics. "We use the Ground Range Detected (GRD) product available on GEE, which provides log-amplitudes in the VV and VH polarizations..."
- xBD-S12: A dataset aligning xBD with Sentinel-1/2 pre/post-event pairs for medium-resolution damage mapping. "We introduce xBD-S12, a dataset of 10,315 pre- and post-disaster image pairs from both Sentinel-1 and Sentinel-2, spatially and temporally aligned with the established xBD benchmark."
- xView2 split: The original training/testing partitioning protocol of the xView2 challenge used for benchmarking. "Henceforth, we refer to the original split as xView2, using the combined train and tier3 sets for training and the test set for evaluation."
Practical Applications
Immediate Applications
The following applications leverage the paper’s released dataset (xBD‑S12), code, and trained models, as well as the demonstrated performance characteristics (strong for floods and wildfires; moderate for storms; limited for sparse earthquake damages). They can be implemented with current tools (Google Earth Engine, Sentinel‑1/2 archives, the GitHub repo, standard GIS).
- Rapid, wide-area disaster triage and situational awareness
- Sectors: emergency management, humanitarian response, public safety, policy
- What to do: Generate coarse damage maps within hours to days using Sentinel‑1/2 pre/post imagery to guide field deployments, prioritize areas, and inform initial resource allocation when VHR imagery is delayed or unavailable.
- Tools/workflow: Use xBD‑S12 codebase with Sentinel‑1 GRD (VV/VH) and Sentinel‑2 L2A via GEE/Φ‑down; run the recommended 2‑step U‑Net (late fusion) pipeline; publish outputs to ArcGIS/QGIS/Mapbox dashboards; overlay with known building footprints (e.g., Overture Maps or national cadastre) for building‑only damage classification.
- Assumptions/dependencies: Works best for disasters with contiguous, spectrally distinct damage (wildfires, floods, tsunamis); adequate post‑event acquisitions and limited cloud cover (mitigated via Sentinel‑1 SAR).
- Insurance and reinsurance rapid impact screening
- Sectors: finance/insurance, risk analytics
- What to do: Produce preliminary damage density layers to estimate exposure, triage claims, and identify zones likely to be affected immediately after an event.
- Tools/workflow: Integrate model outputs with portfolio geocoding; create a “rapid impact index” per postal sector/tract; use ensembles for robustness; route adjusters accordingly.
- Assumptions/dependencies: Medium-resolution limits house‑level accuracy; best for flooding/wildfire footprints and aggregated zonal analysis; requires accurate portfolio geocoding and building footprint data.
- Utility and infrastructure restoration prioritization
- Sectors: energy (grid operators), telecoms, transportation
- What to do: Overlay damage maps with asset registries to identify corridor segments or substation service areas most affected and prioritize site visits.
- Tools/workflow: GIS integration with asset layers; automated alerts when damage overlap exceeds thresholds; use post‑event S1 (all‑weather) to avoid cloud issues.
- Assumptions/dependencies: Sentinel resolution sufficient for corridor‑scale triage, not for individual components; accurate georegistration of assets needed.
- Public information and media briefings
- Sectors: media, civic tech, NGOs
- What to do: Publish quick, interpretable damage maps to support public updates and volunteer coordination when official assessments are still in progress.
- Tools/workflow: Use TCI composites for context, overlay model outputs; add uncertainty notes (e.g., hurricane regions may be under‑detected).
- Assumptions/dependencies: Clear communication of limitations; ensure ethical use and alignment with official guidance.
- Academic research and teaching with an operationally relevant benchmark
- Sectors: academia, education
- What to do: Use xBD‑S12 for coursework, benchmarking methods, and reproducible experiments on moderate‑resolution damage mapping.
- Tools/workflow: Adopt the released dataset and repo; run ablation studies (early vs late fusion, buffers) and cross‑event generalization assignments.
- Assumptions/dependencies: Access to compute (modest for U‑Net); familiarity with GEE/Sentinel data products.
- NGO mapping campaigns coordination
- Sectors: humanitarian mapping (e.g., HOT), volunteer groups
- What to do: Use coarse damage footprints to focus community mapping on priority areas (e.g., tracing roads/settlements near affected zones).
- Tools/workflow: Export grid cells with high predicted damage; task groups in those tiles; update OSM rapidly.
- Assumptions/dependencies: Damage maps guide where to map, not precise building damage states.
- Local government planning updates after major events
- Sectors: urban planning, resilience policy
- What to do: Compile post‑event damage extents to update risk maps and inform zoning adjustments, buy‑outs, or mitigation investments.
- Tools/workflow: Aggregate damage layers over administrative units; cross‑check with observed inundation/burn perimeters; maintain event libraries.
- Assumptions/dependencies: Robustness higher for floods/wildfires; complement with field surveys and VHR confirmation.
- UAV/ground team tasking based on satellite triage
- Sectors: robotics, field ops
- What to do: Use Sentinel‑derived hotspots to plan drone paths and staging locations for detailed inspections.
- Tools/workflow: Convert damage density to candidate waypoints; integrate with flight planning; update routes as new Sentinel data arrives.
- Assumptions/dependencies: Coarse triage layer; drones provide fine‑scale validation.
- Platform integration for “Copernicus Rapid Damage Layer”
- Sectors: geospatial software, SaaS
- What to do: Package the released pipeline as a turnkey module/API in EO platforms for event‑driven runs.
- Tools/workflow: Serverless jobs pulling Sentinel pre/post; run ensemble inference; return tiled map services with uncertainty metadata.
- Assumptions/dependencies: Service reliability; credentialed access to data; clear SLAs on latency.
- Historical event libraries for resilience analytics
- Sectors: policy, climate risk, academia
- What to do: Build catalogs of past damage footprints to support hazard models and community risk profiling.
- Tools/workflow: Batch‑process past events for floods/wildfires; standardize outputs; link to socioeconomic layers.
- Assumptions/dependencies: Event date accuracy and suitable post‑event imagery; consistent processing.
Long-Term Applications
These applications require further research, scaling, or integration with additional data sources (e.g., InSAR, longer time series) and/or improved models (better cross-event generalization, stronger building localization at moderate resolution).
- Operational fusion of Sentinel triage with tasking of VHR and aerial assets
- Sectors: emergency management, government, commercial EO
- What to build: A tiered pipeline that uses Sentinel for immediate triage and automatically requests VHR tasking over hotspots for detailed building‑level assessment.
- Dependencies: Data sharing agreements, automated tasking workflows, orchestration across providers; SOP integration.
- InSAR coherence and damage proxy integration for structural change detection
- Sectors: disaster response, geophysics, infrastructure monitoring
- What to build: Combine SAR interferometric products (coherence, damage proxy maps) with existing pipeline to detect structural changes more robustly in urban areas and for earthquakes/hurricanes.
- Dependencies: Interferometric processing expertise, DEMs, orbital alignment, cloud compute; validation datasets.
- Multi-temporal time series for impact and recovery monitoring
- Sectors: policy, humanitarian aid, development
- What to build: Longitudinal analytics that track damage evolution and recovery (e.g., debris removal, vegetation regrowth, reoccupation) using weeks-to-months of Sentinel imagery.
- Dependencies: Stable time series processing, seasonality control, domain definitions of “recovery,” ground truth.
- Geospatial foundation models tailored to damage assessment
- Sectors: software/AI, academia
- What to build: Pretrain or adapt GeoFMs with task-specific objectives and finetune both encoder and decoder for damage mapping; improve building localization and cross‑event generalization.
- Dependencies: Large-scale curated training corpora, compute budgets, careful evaluation against simple baselines; domain-specific pretraining tasks.
- Vision–language interfaces for incident command centers
- Sectors: emergency ops software
- What to build: VLMs that let operators query “Where are likely damaged residential clusters within 10 km of X?” and receive map outputs and confidence summaries.
- Dependencies: Mature remote sensing VLMs, high-quality paired text–image data, guardrails for uncertainty and misinterpretation.
- Regulatory adoption and standard operating procedures (SOPs)
- Sectors: public policy, civil protection
- What to build: Incorporate Copernicus‑based rapid mapping into national/municipal SOPs, with guidance on which hazard types and thresholds justify usage and how to communicate limitations.
- Dependencies: Training, capacity building, governance for data use, alignment with Copernicus EMS and local agencies.
- Catastrophe model calibration and vulnerability curve refinement
- Sectors: insurance, catastrophe modeling
- What to build: Use consistent damage footprints across events to refine model parameters and validate hazard extent; quantify biases by hazard type.
- Dependencies: Harmonized, long‑term datasets; linkage to loss data; methodical uncertainty quantification.
- Global “damage-as-a-service” APIs
- Sectors: EO platform providers, enterprises
- What to build: Scalable services that automatically ingest event feeds (e.g., GDACS), pull Sentinel data, run models, and deliver tiled damage layers and metrics via REST APIs.
- Dependencies: Event detection triggers, robust MLOps, global coverage guarantees, legal/ethical policies for public release.
- Urban digital twins with damage layers
- Sectors: smart cities, planning
- What to build: Integrate post‑event damage layers into 3D city models to simulate resilience interventions and emergency logistics.
- Dependencies: High-quality base twins, integration with building inventories and transport networks; improved building localization at moderate resolution.
- Improved hurricane and earthquake damage detection
- Sectors: emergency management, research
- What to build: Specialized models/data for hurricanes and weak earthquakes (e.g., texture, coherence, ancillary wind/fault data) to overcome limitations of 10 m imagery for sparse or small structures.
- Dependencies: Hazard-specific data fusion, refined labels, better proxies (roof material, elevation, wind fields), additional sensors (e.g., commercial SAR, aerial).
Cross-cutting assumptions and dependencies
- Performance varies by hazard type: strong for floods and wildfires; moderate for storms; limited for sparse earthquake damages at 10 m GSD.
- Building localization is the weakest step at Sentinel resolution; where possible, use external building footprints (national cadastres, Overture Maps) and focus the model on damage classification within known footprints.
- Cloud cover can limit Sentinel‑2 usability; Sentinel‑1 SAR mitigates this, but advanced SAR processing (e.g., InSAR) may be needed for structural changes.
- Accurate georegistration, disaster timing, and model buffer strategies (2–3 pixels) are important for practical outputs.
- The paper’s simpler architectures (2‑step U‑Net, late fusion) generalize better across unseen events than more complex models; consider ensembles for robustness.
- Open-source tools and data (xBD‑S12, code, trained models) reduce barriers but require basic ML/EO expertise and GIS integration to operationalize.
Collections
Sign up for free to add this paper to one or more collections.

