Visualizing Quantum Circuits: State Vector Difference Highlighting and the Half-Matrix
Published 1 Oct 2025 in quant-ph and cs.HC | (2510.00895v1)
Abstract: Existing graphical user interfaces for circuit simulators often show small visual summaries of the reduced state of each qubit, showing the probability, phase, purity, and/or Bloch sphere coordinates associated with each qubit. These necessarily provide an incomplete picture of the quantum state of the qubits, and can sometimes be confusing for students or newcomers to quantum computing. We contribute two novel visual approaches to provide more complete information about small circuits. First, to complement information about each qubit, we show the complete state vector, and illustrate the way that amplitudes change from layer-to-layer under the effect of different gates, by using a small set of colors, arrows, and symbols. We call this state vector difference highlighting'', and show how it elucidates the effect of Hadamard, X, Y, Z, S, T, Phase, and SWAP gates, where each gate may have an arbitrary combination of control and anticontrol qubits. Second, we display pairwise information about qubits (such as concurrence and correlation) in a triangularhalf-matrix'' visualization. Our open source software implementation, called MuqcsCraft, is available as a live online demonstration that runs in a web browser without installing any additional software, allowing a user to define a circuit through drag-and-drop actions, and then simulate and visualize it.
The paper introduces state vector difference highlighting and a triangular half-matrix for improved quantum circuit visualization.
It employs an interactive web-based tool, MuqcsCraft, to reveal detailed amplitude, phase dynamics, and pairwise qubit metrics.
The approach enhances circuit design and debugging by exposing comprehensive state evolution and entanglement analysis for circuits with up to 8 qubits.
Visualizing Quantum Circuits: State Vector Difference Highlighting and the Half-Matrix
Introduction
This paper introduces two novel visualization techniques for quantum circuit simulation: state vector difference highlighting and the triangular half-matrix. These methods are implemented in the open-source MuqcsCraft software, which provides an interactive, web-based environment for circuit design and analysis. The work addresses limitations in existing graphical user interfaces, which typically display only single-qubit reduced states, omitting critical information about entanglement and the full quantum state. By visualizing the complete state vector and pairwise qubit relationships, the proposed techniques facilitate a more comprehensive understanding of quantum circuit dynamics, especially for small circuits (n≤8).
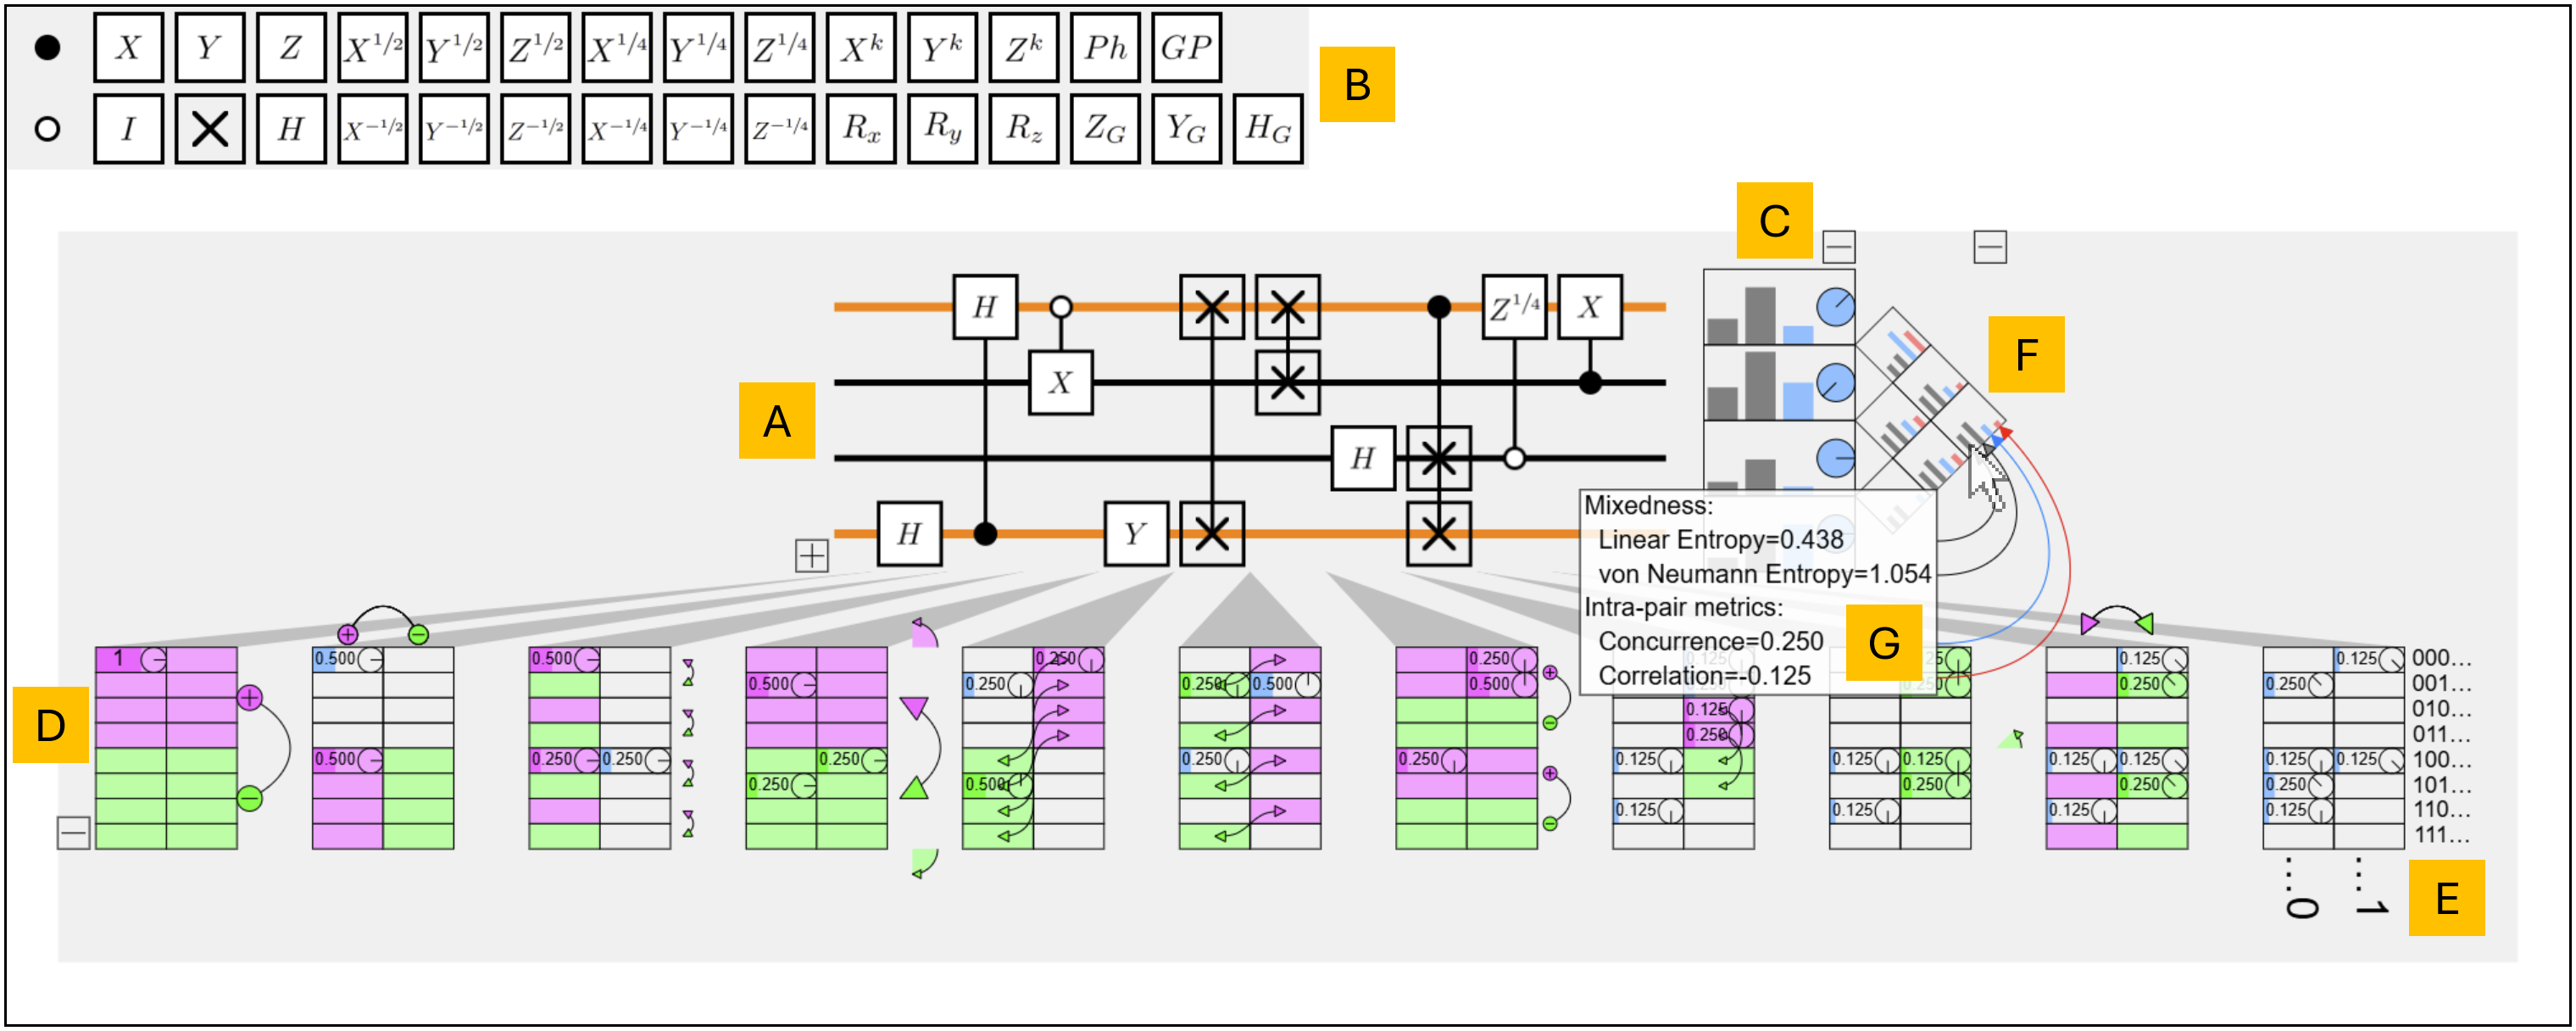
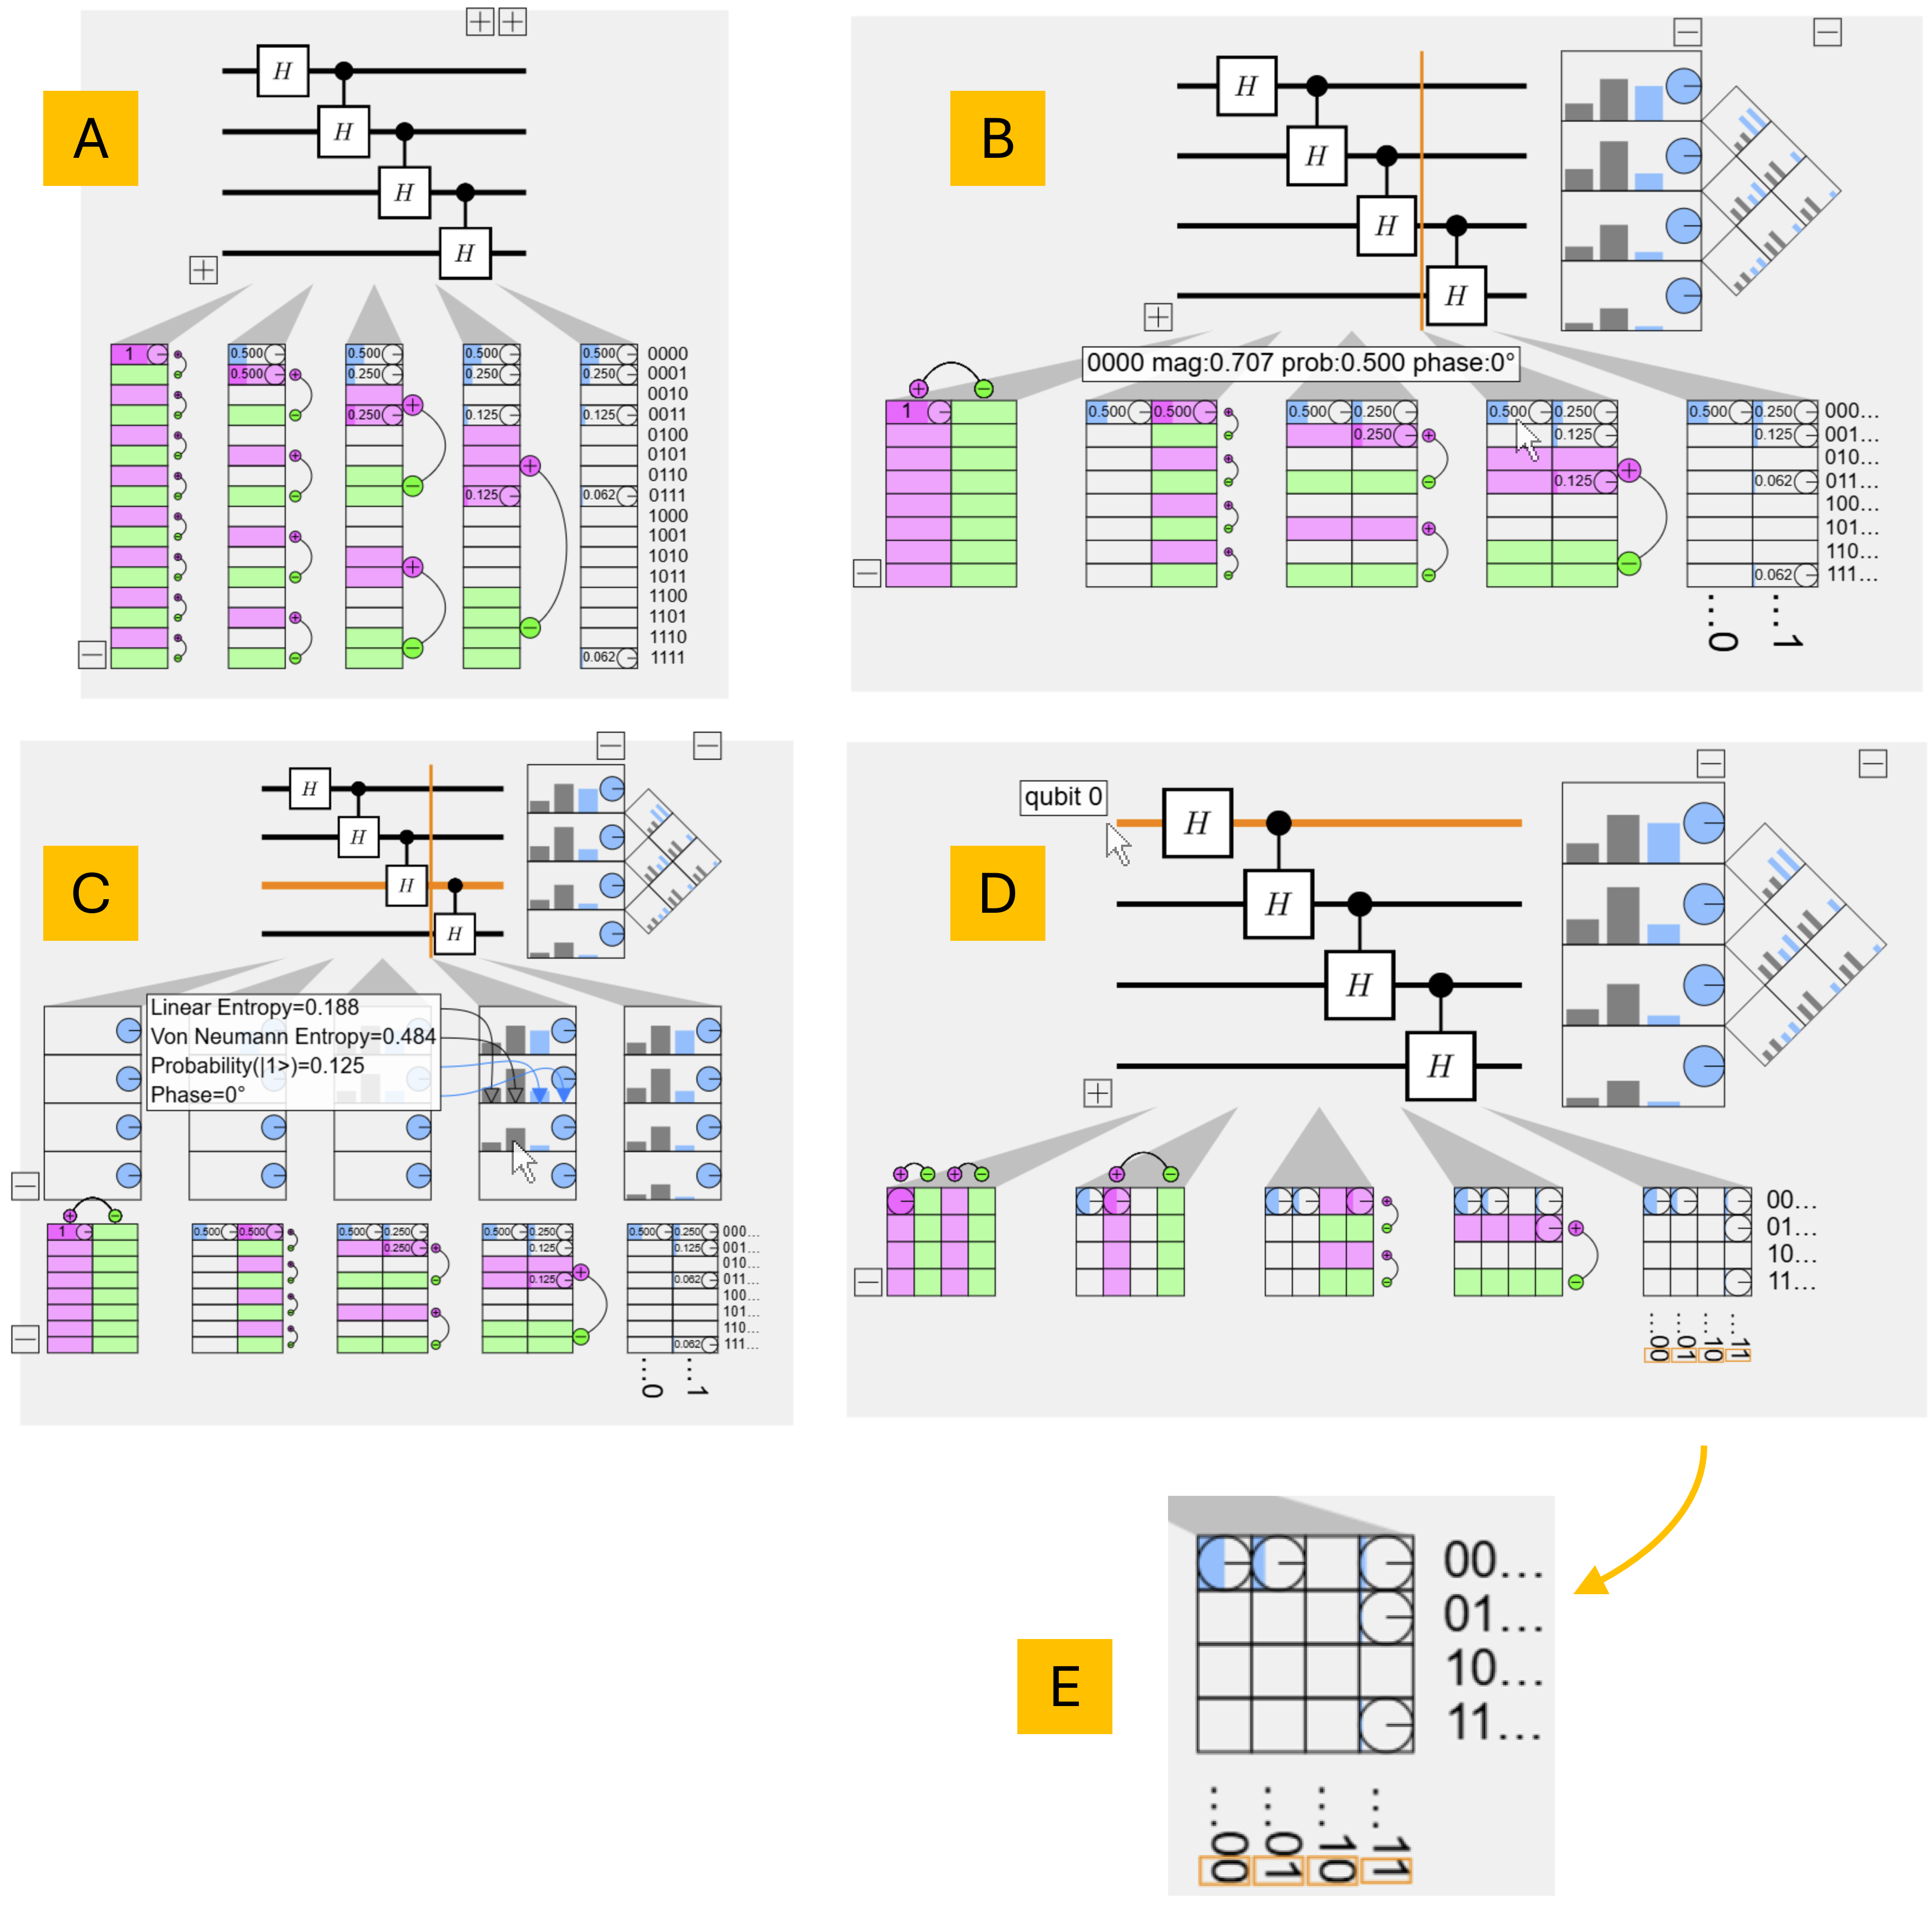
Figure 1: MuqcsCraft's interface showing circuit diagram, drag-and-drop gate toolbar, reduced qubit states, layer-by-layer state vector with difference highlighting, bitstring key, half-matrix for pairwise metrics, and interactive tooltips.
Limitations of Current Visualization Approaches
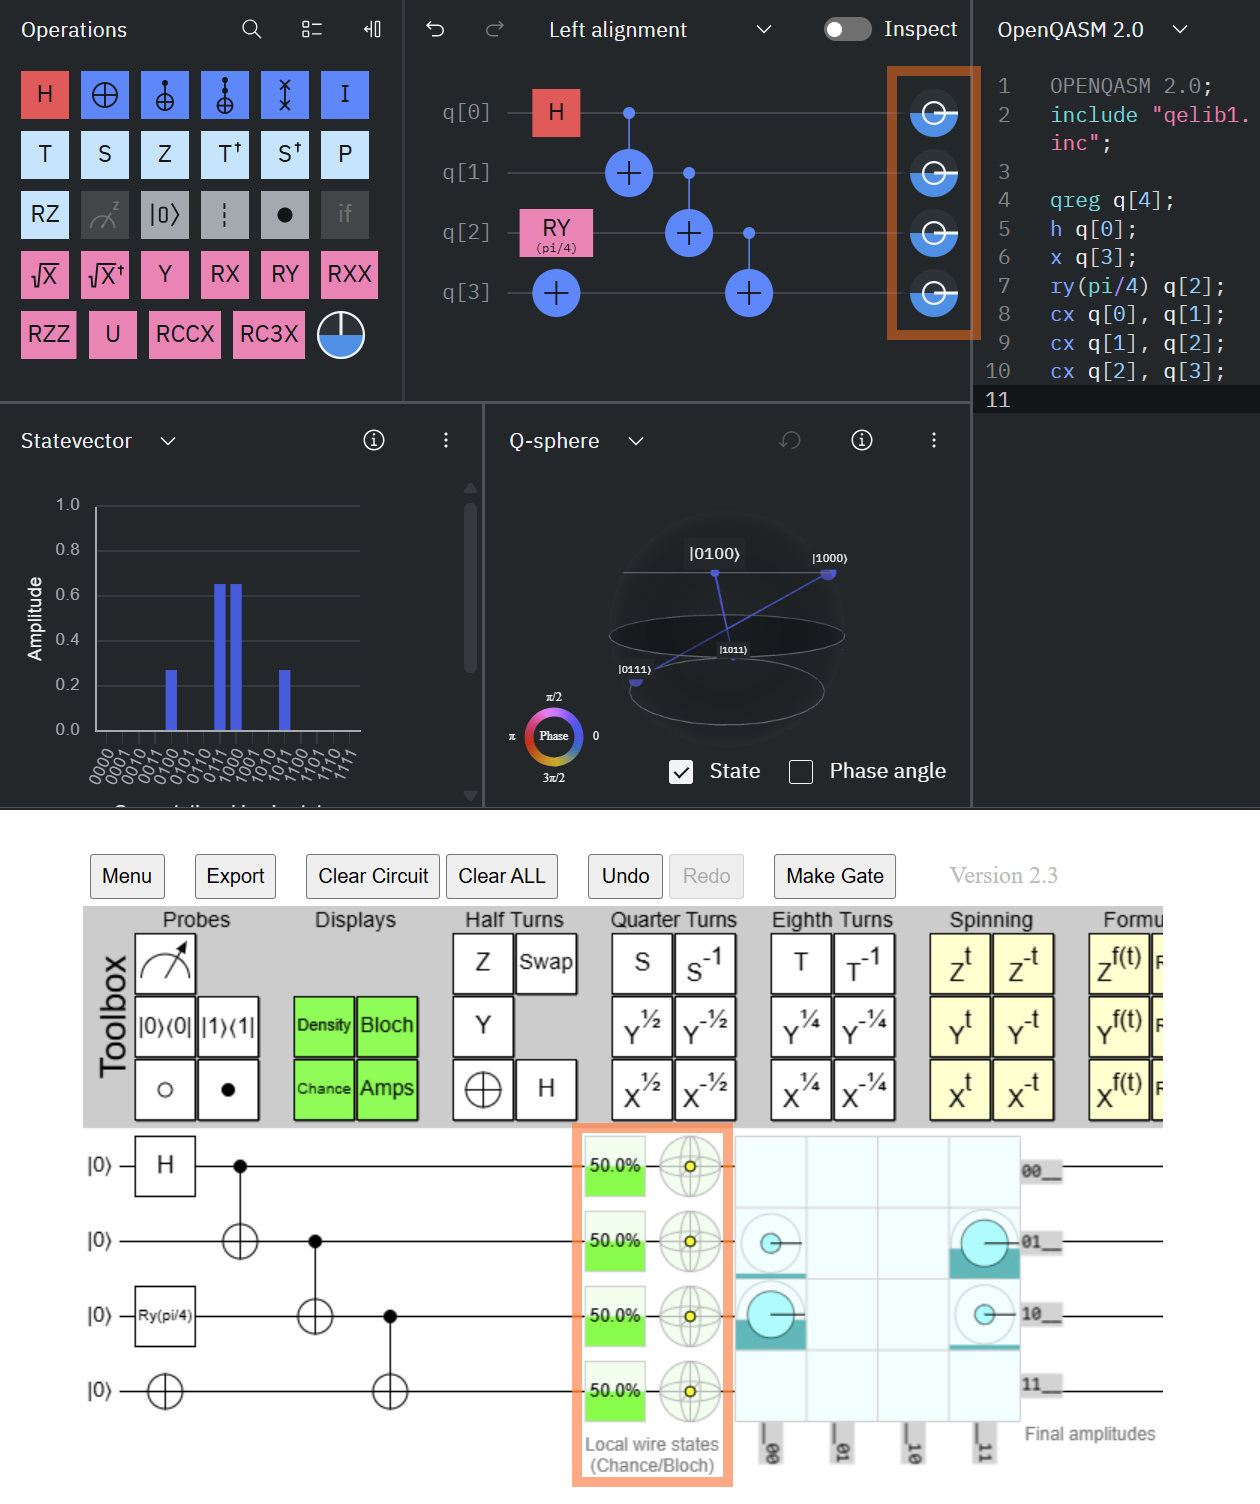
Existing tools such as IBM Quantum Composer and Quirk primarily display single-qubit reduced states, using widgets like phase disks or Bloch spheres. While these summaries provide local information (probability, phase, purity), they fail to capture global properties such as entanglement and correlation. Moreover, the effect of gates on qubit phase can be non-intuitive, especially in the presence of control qubits or phase kickback, leading to confusion even for experienced users.
Figure 2: IBM Quantum Composer and Quirk showing reduced state widgets, which do not reveal entanglement or full state vector information.
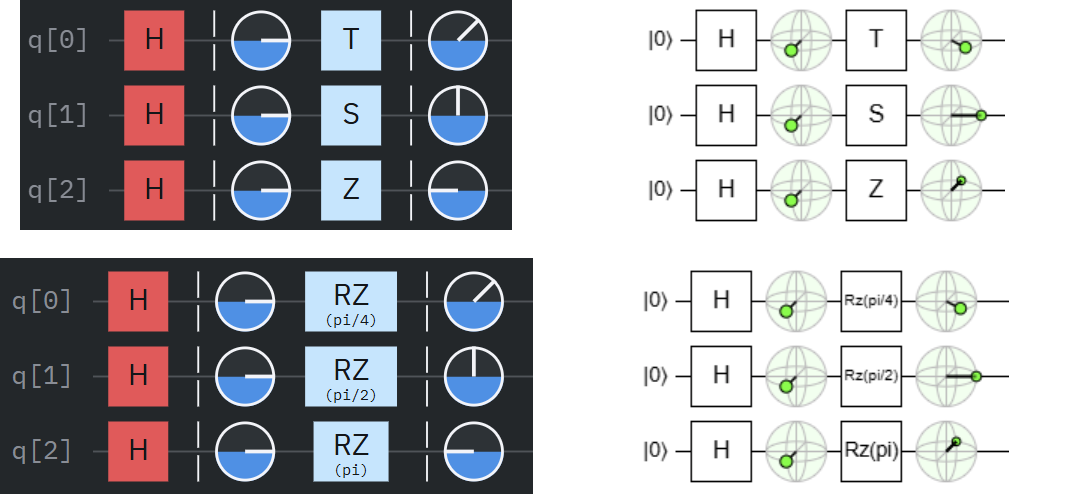
Figure 3: Visual feedback in IBM Quantum Composer and Quirk for gates with simple phase effects.
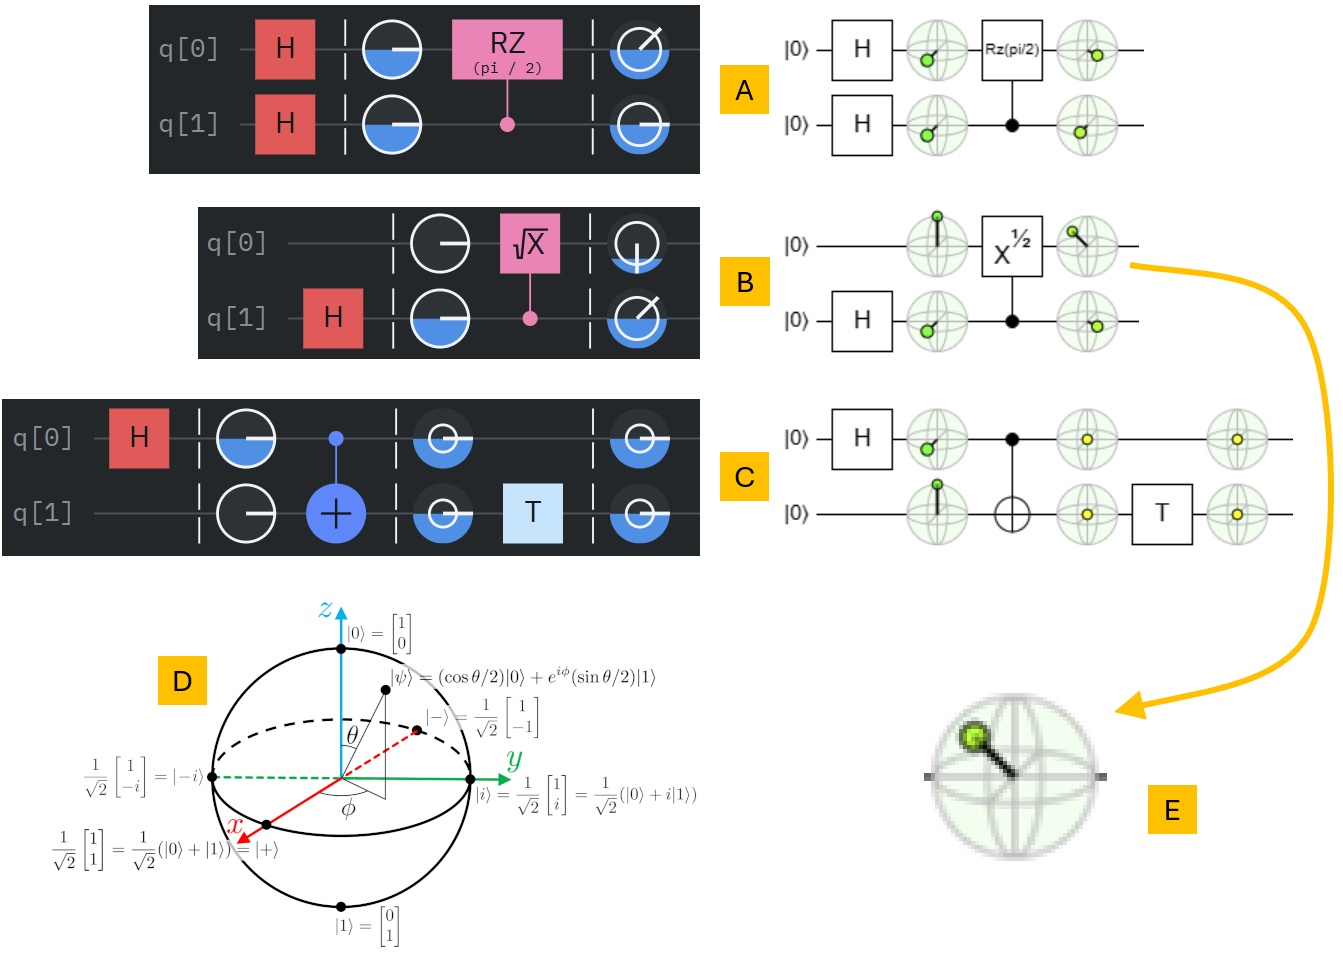
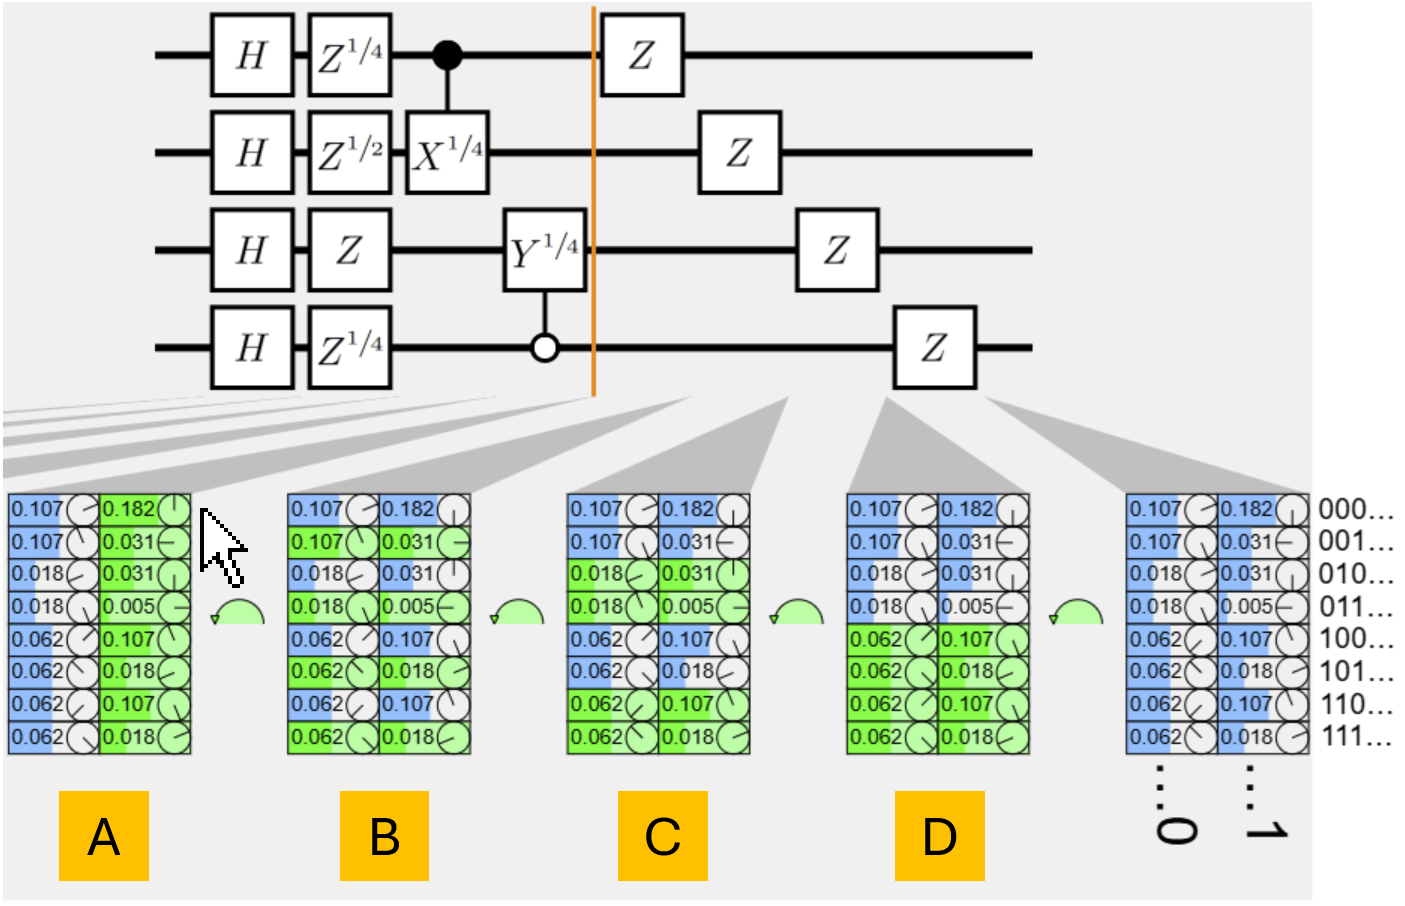
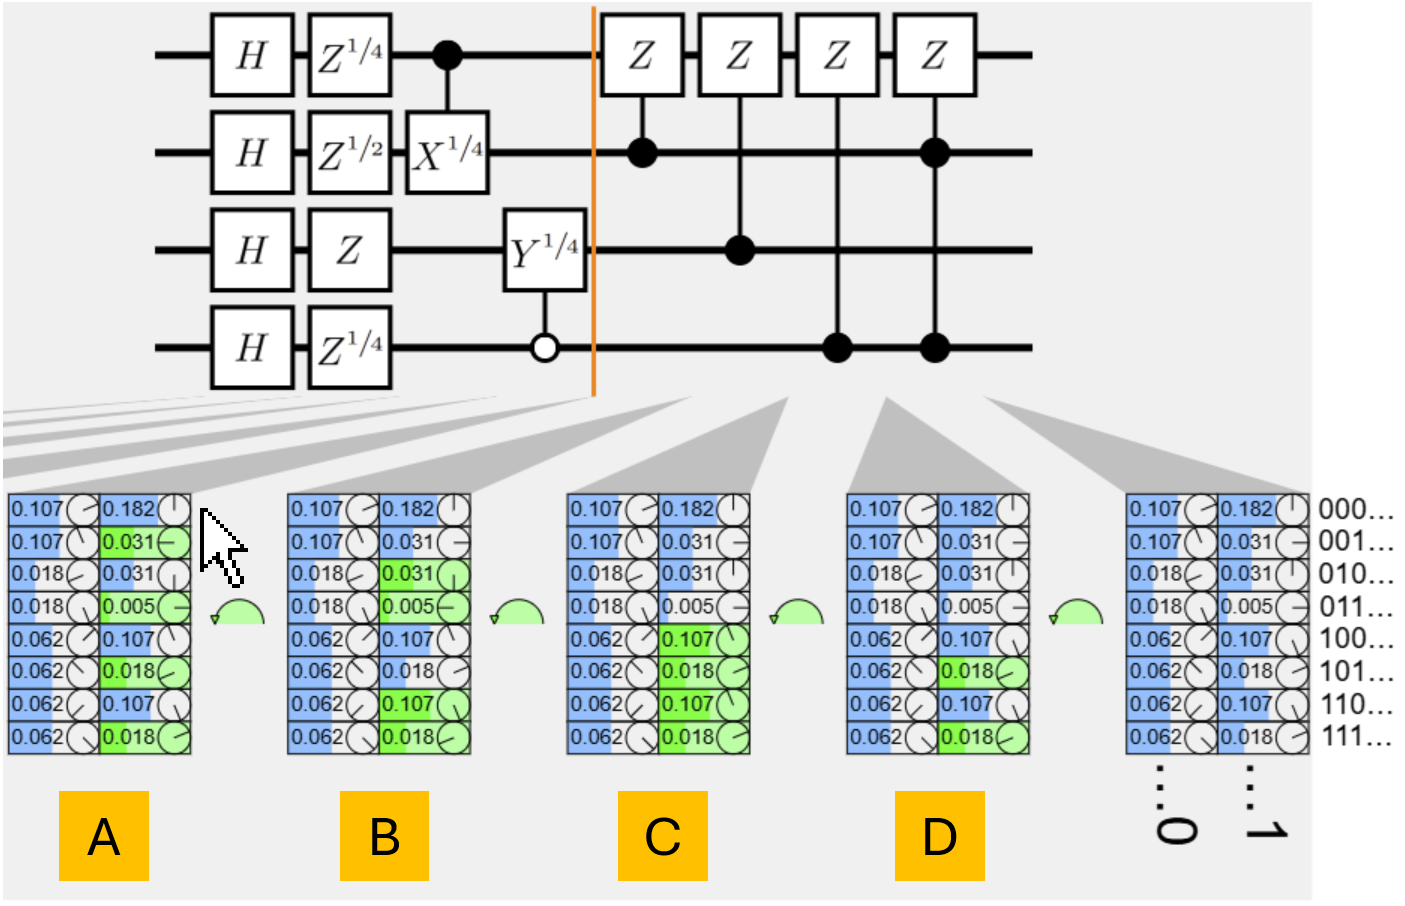
Figure 4: Examples where gates have complex effects on qubit phase, illustrating sources of confusion in standard interfaces.
State Vector Visualization and Difference Highlighting
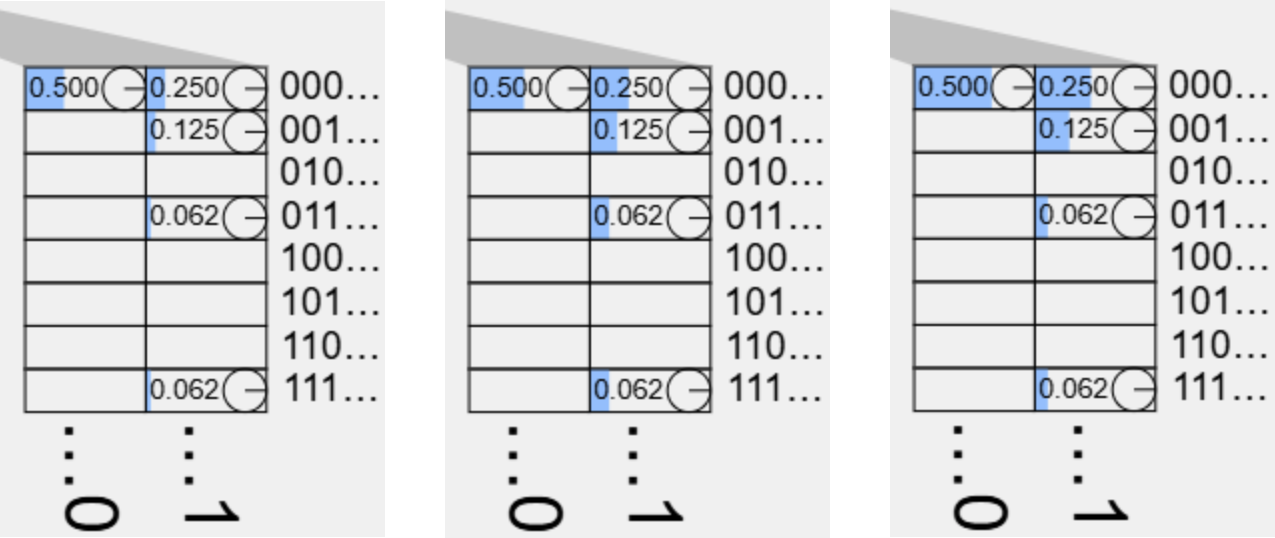
The core contribution is the layer-by-layer visualization of the full state vector, with each amplitude represented by a horizontal bar (for probability or magnitude) and a disc (for phase). The state vector can be wrapped into multiple columns or compressed into squares for space efficiency. Interactive features include tooltips, coordinated highlighting, and bitstring association.
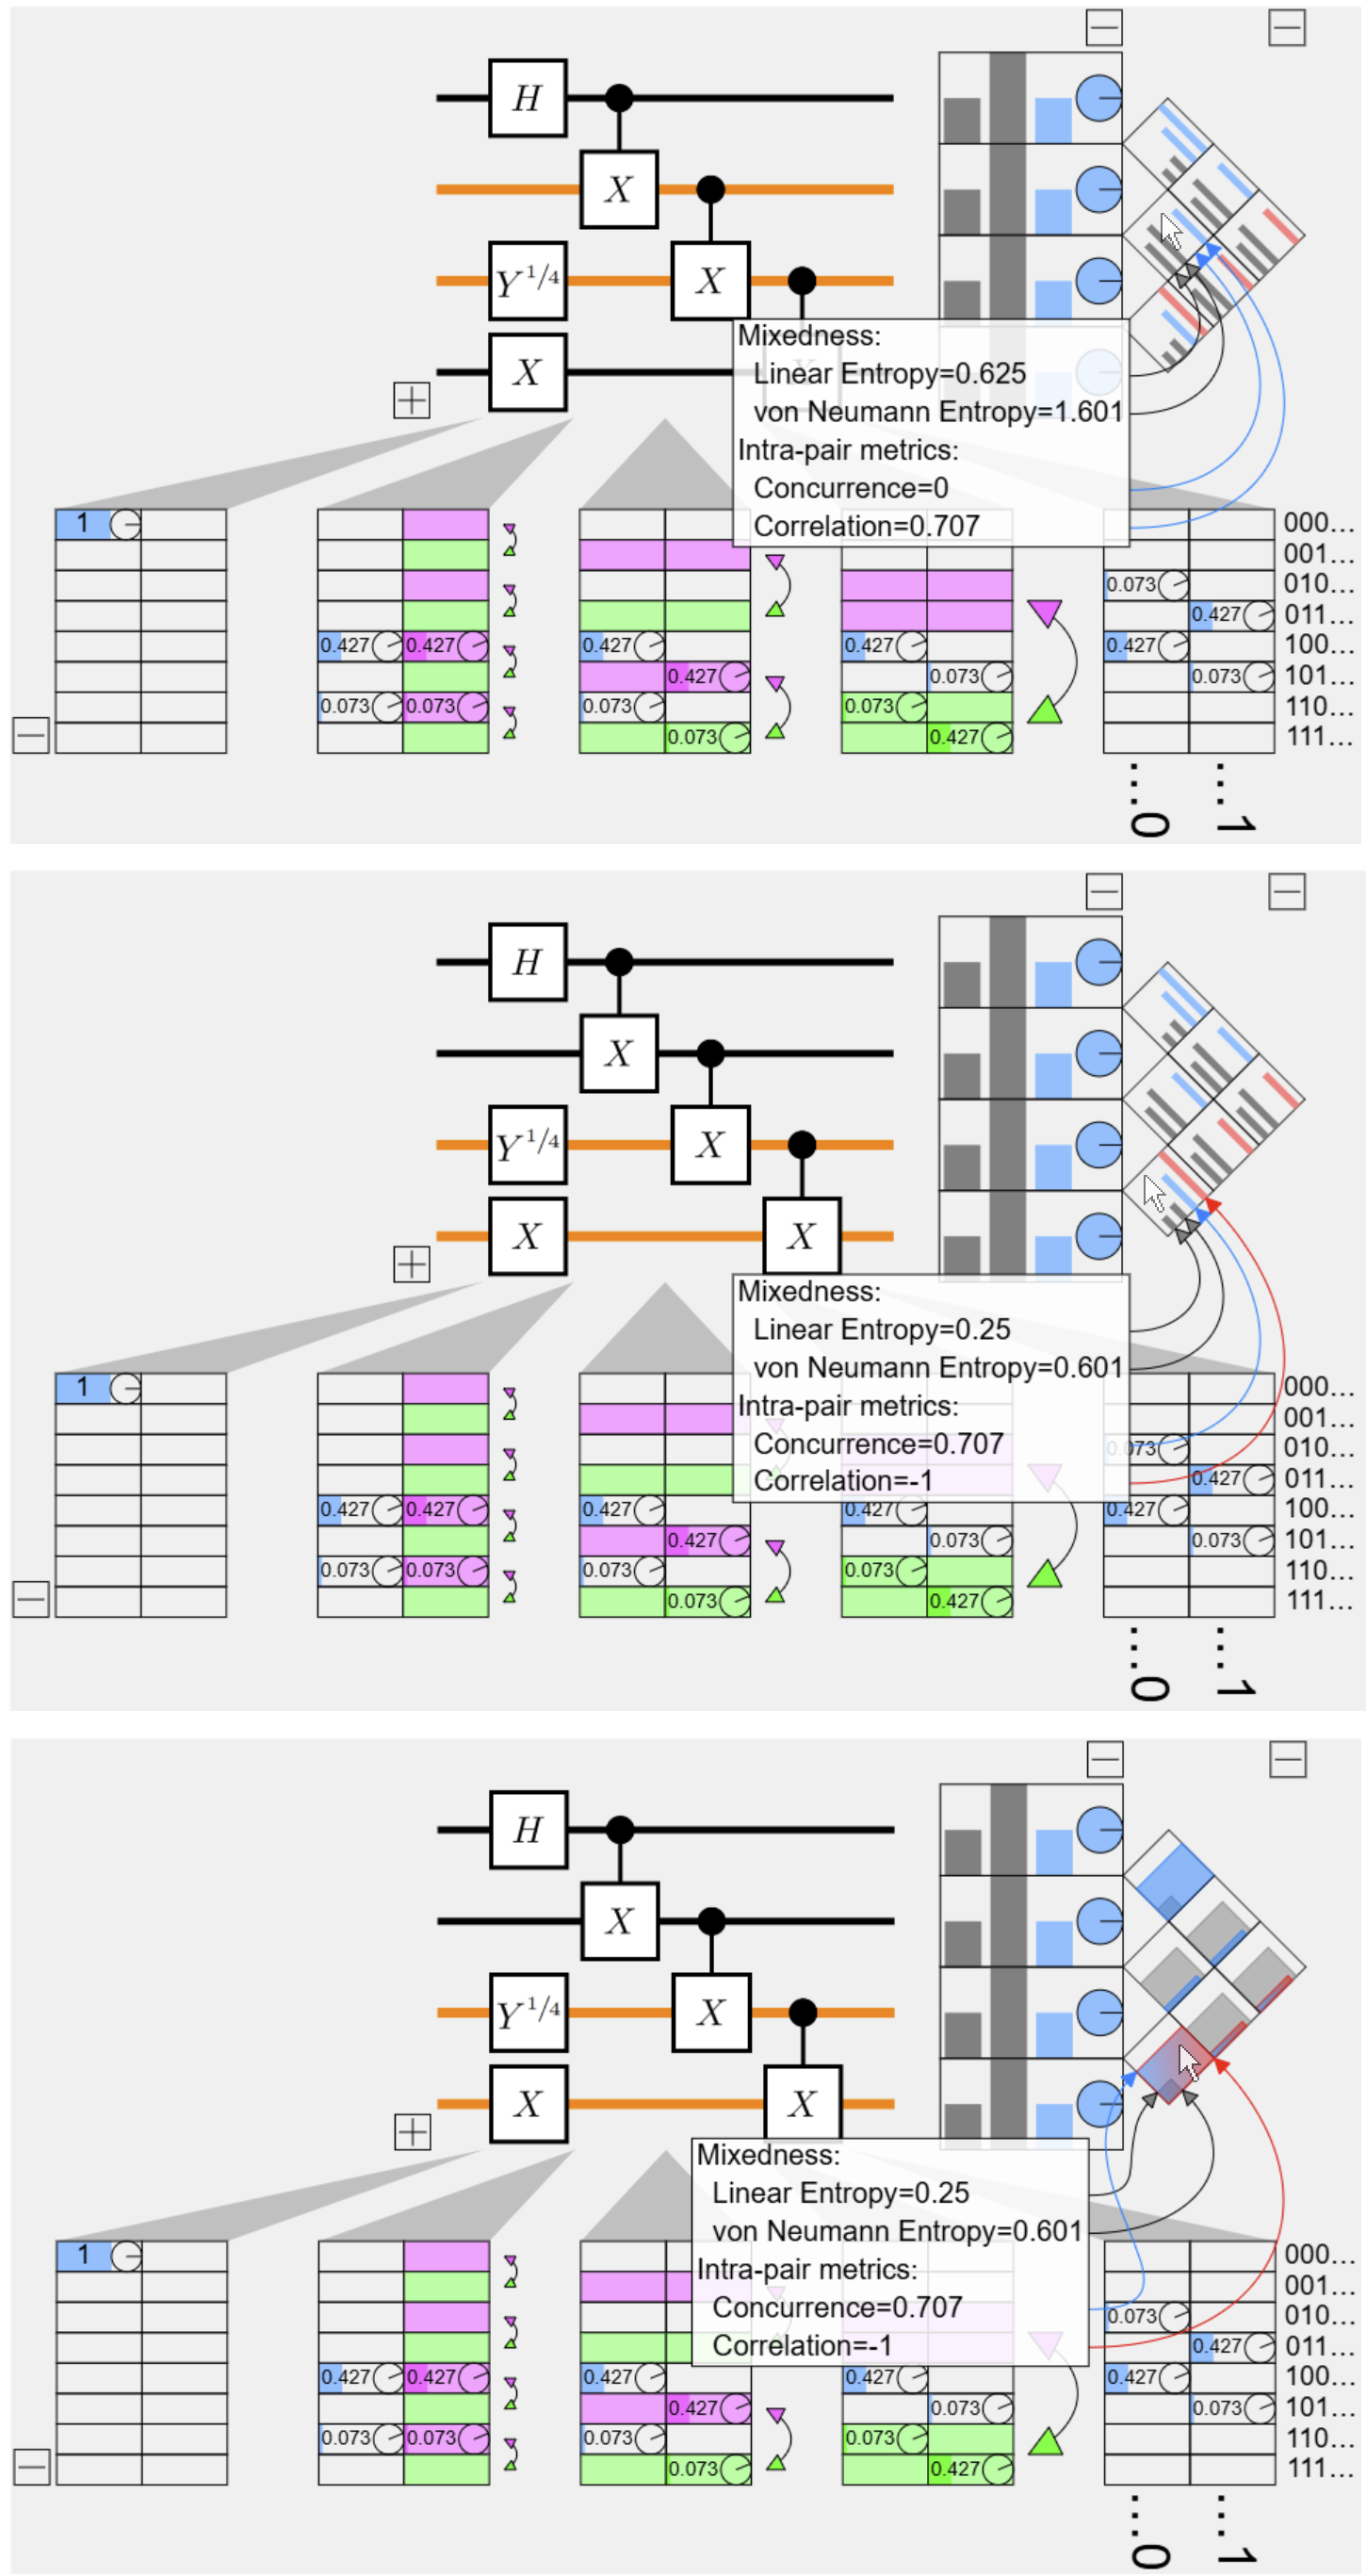
Figure 5: Multiple display options for the state vector, including wrapped arrangements and bitstring highlighting.
Figure 6: Bar length encoding for amplitude probability, magnitude, or log-probability to enhance visibility of small values.
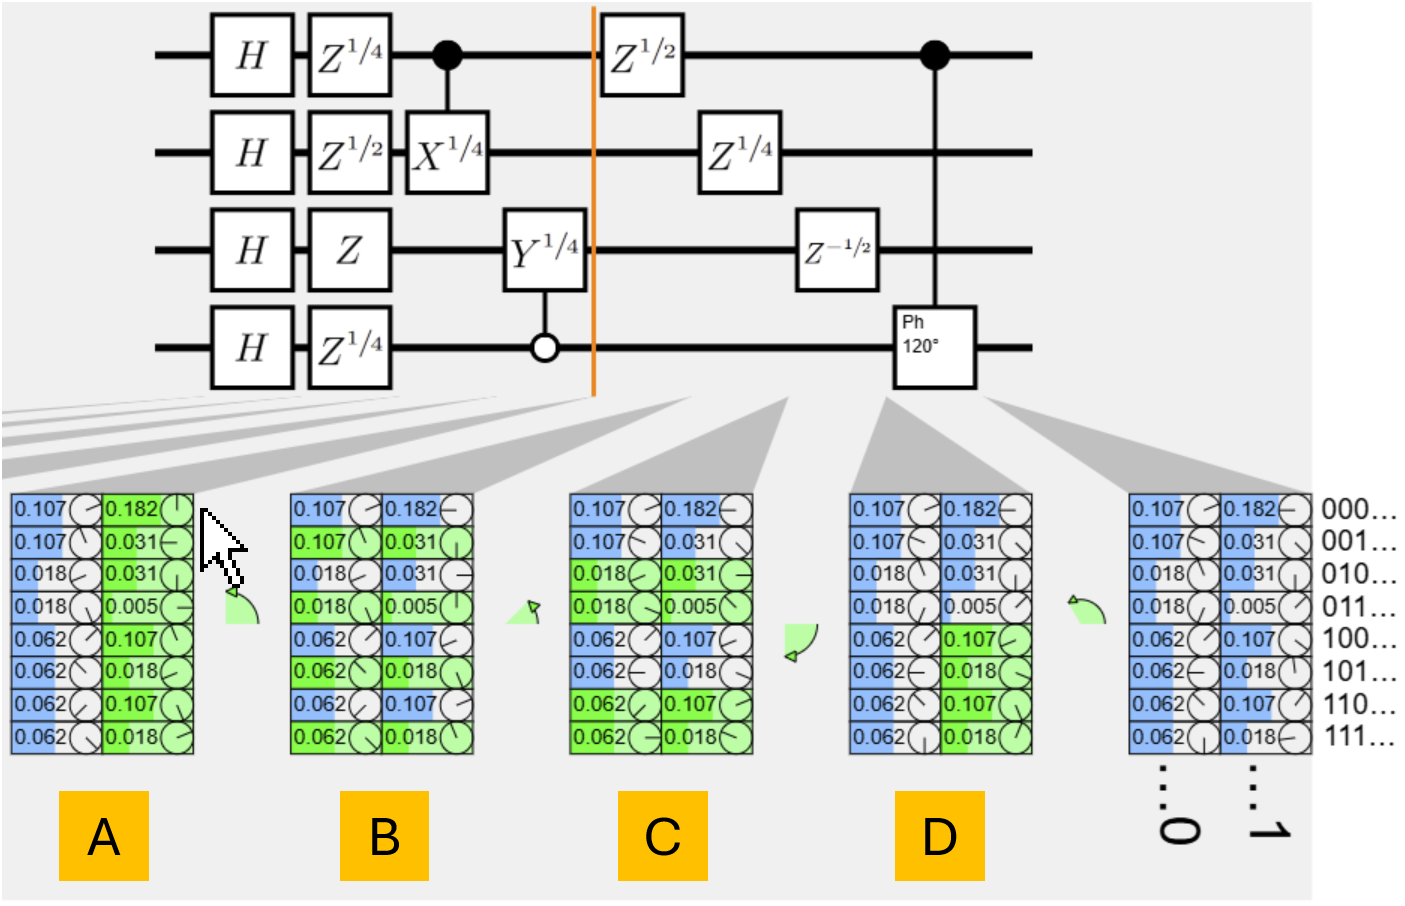
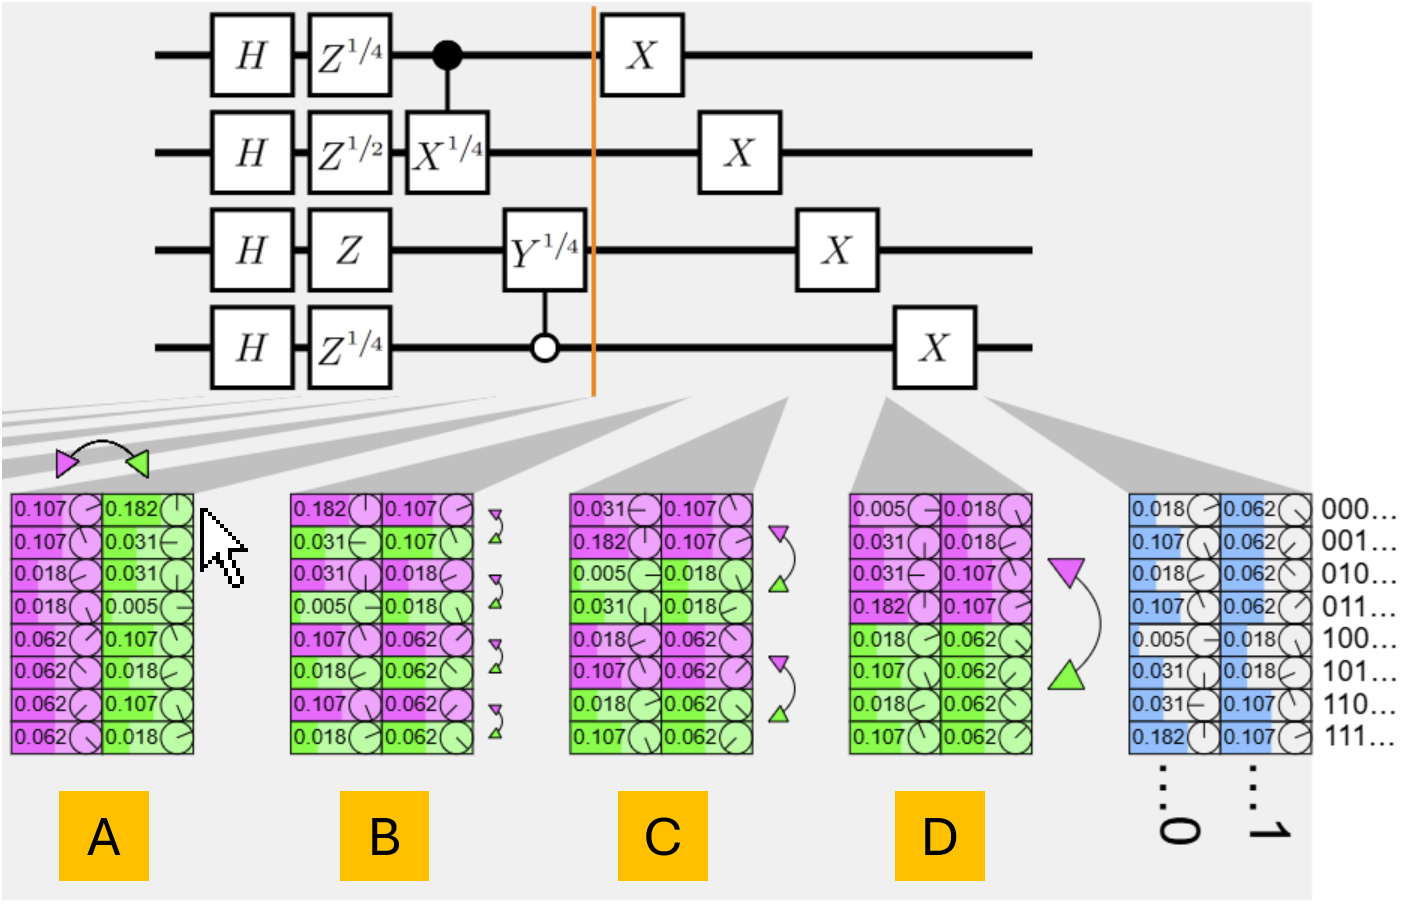
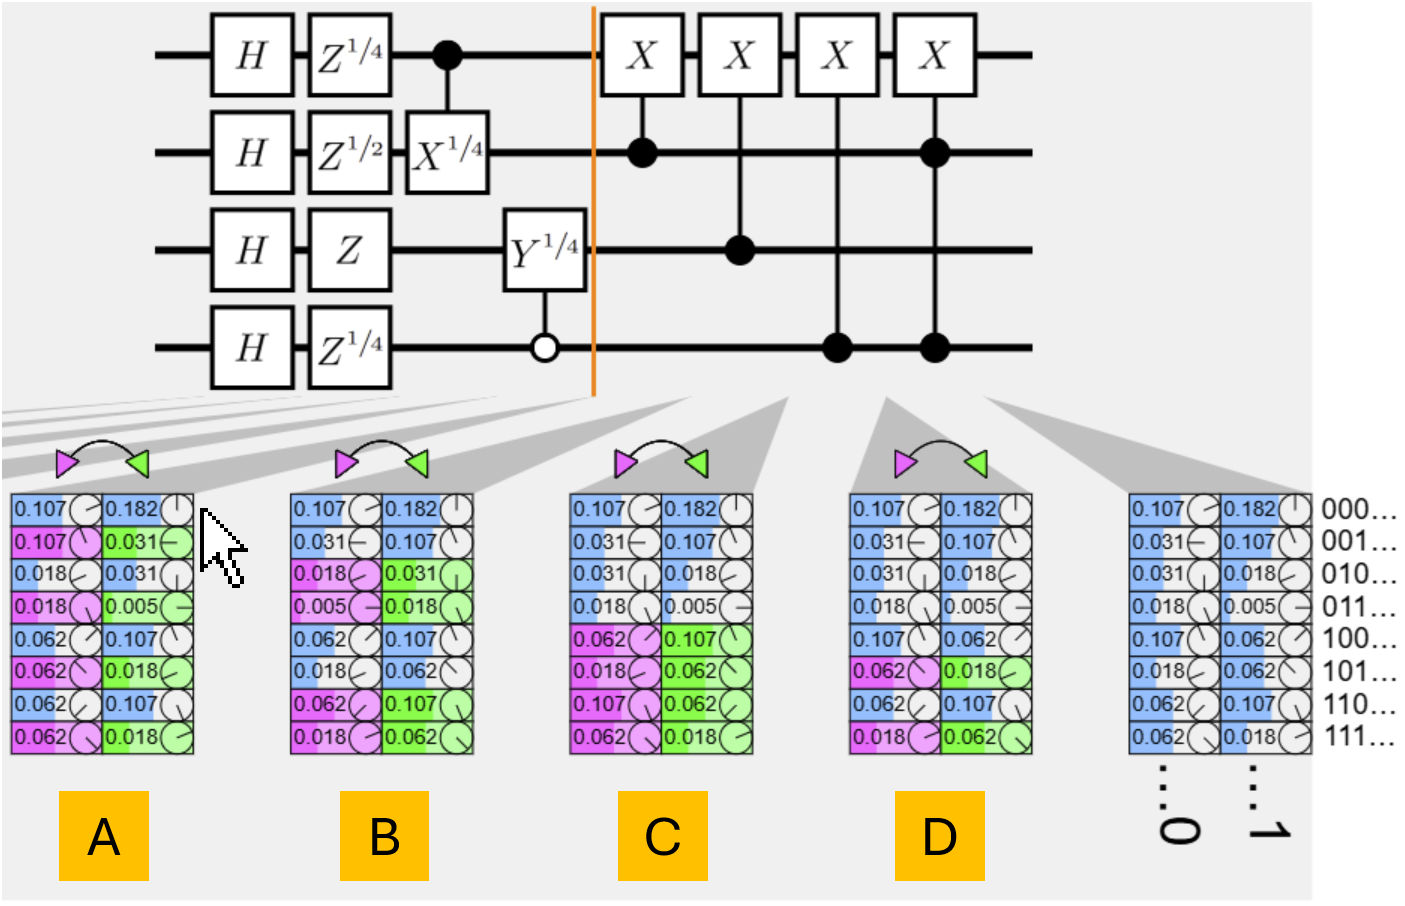
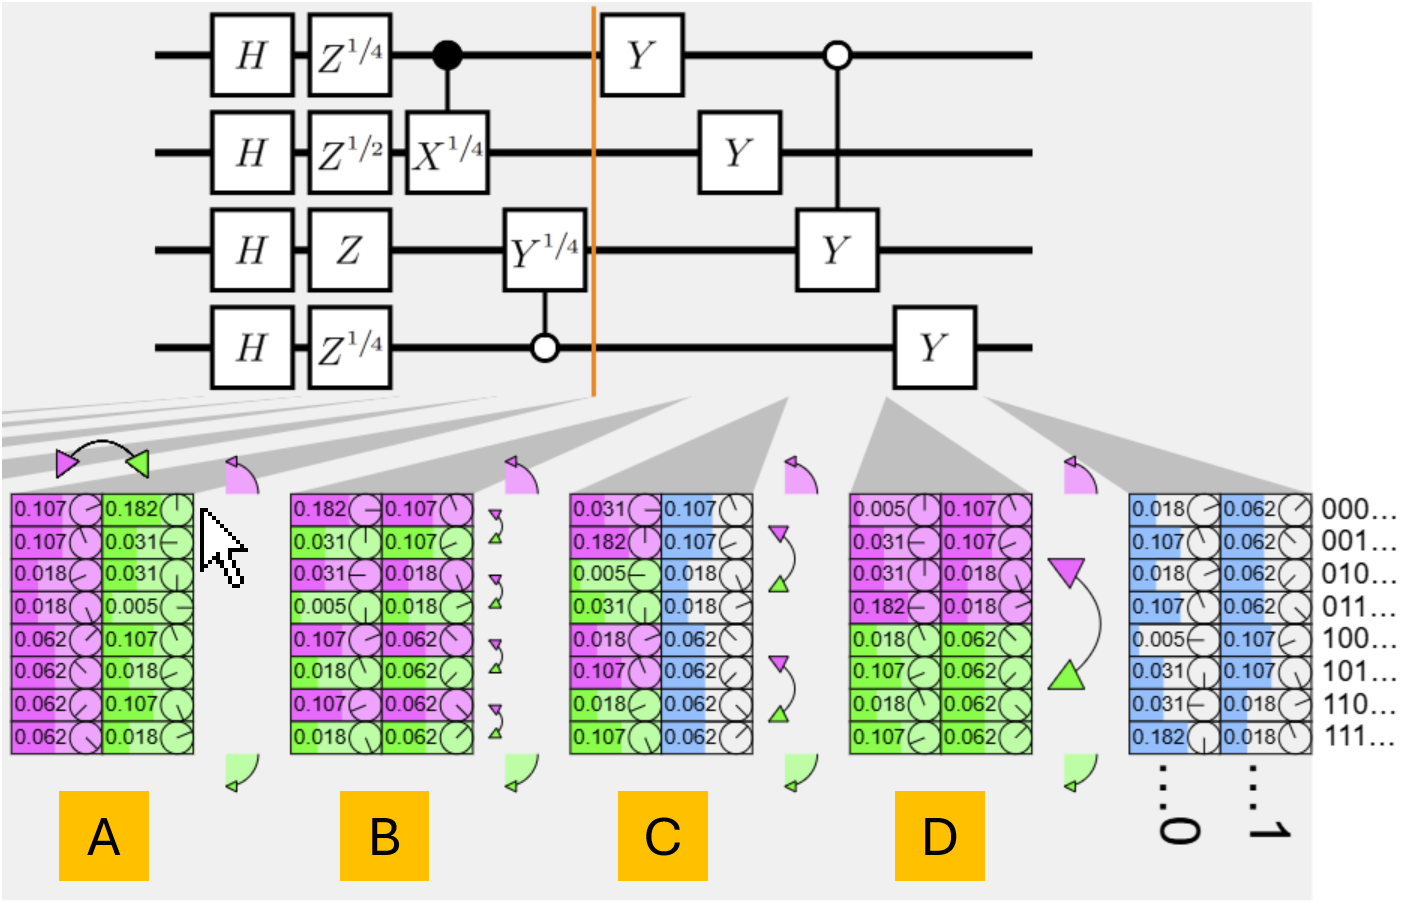
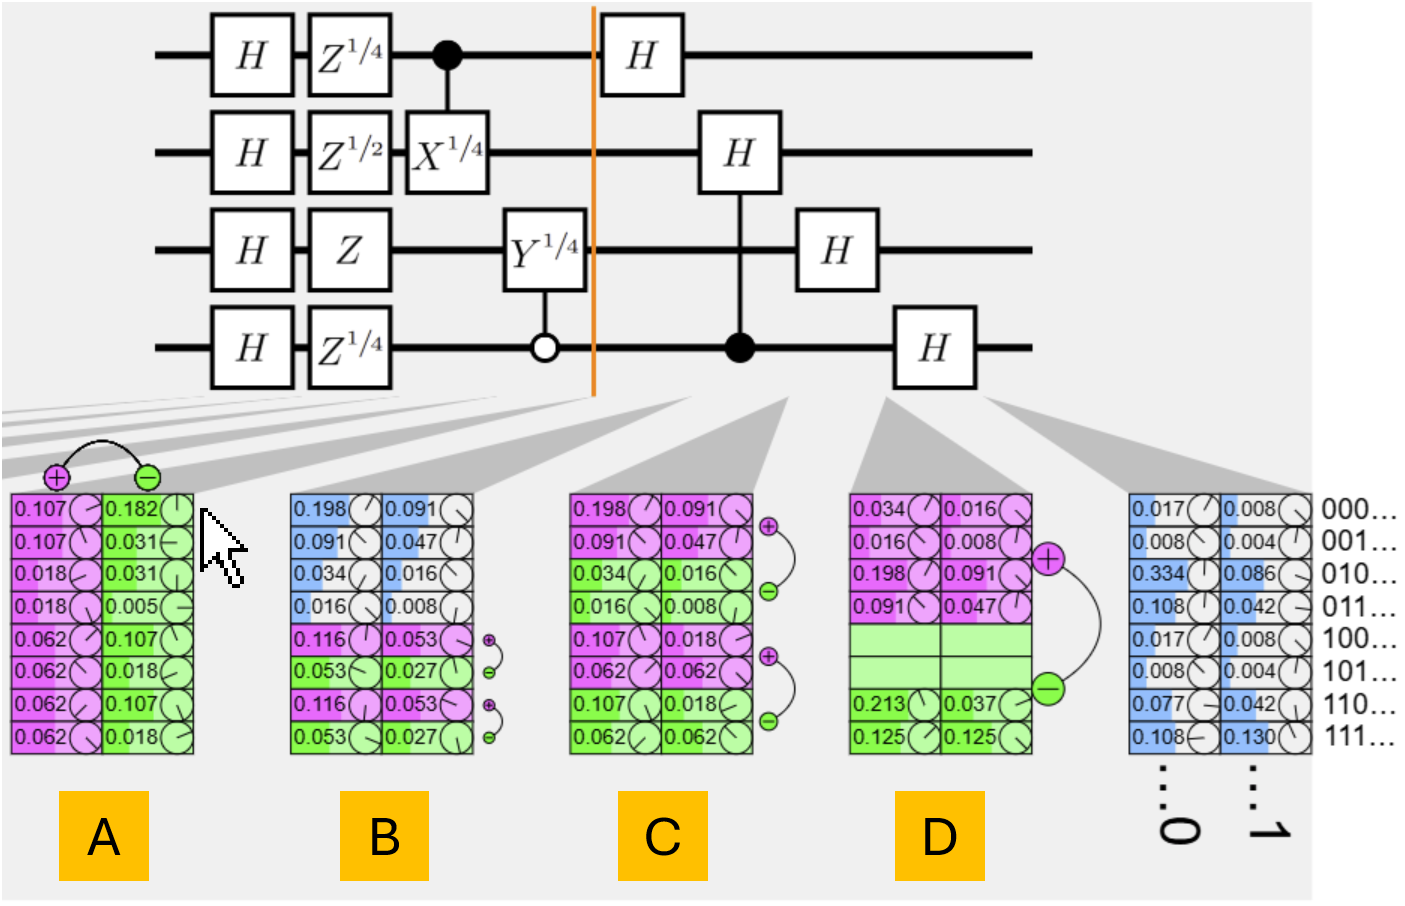
State vector difference highlighting uses a small set of visual primitives—colors (purple/green), arrows, and symbols—to elucidate the effect of gates on the state vector. For each gate type, the affected amplitudes are colored and annotated to show rotation, exchange, addition, or subtraction:
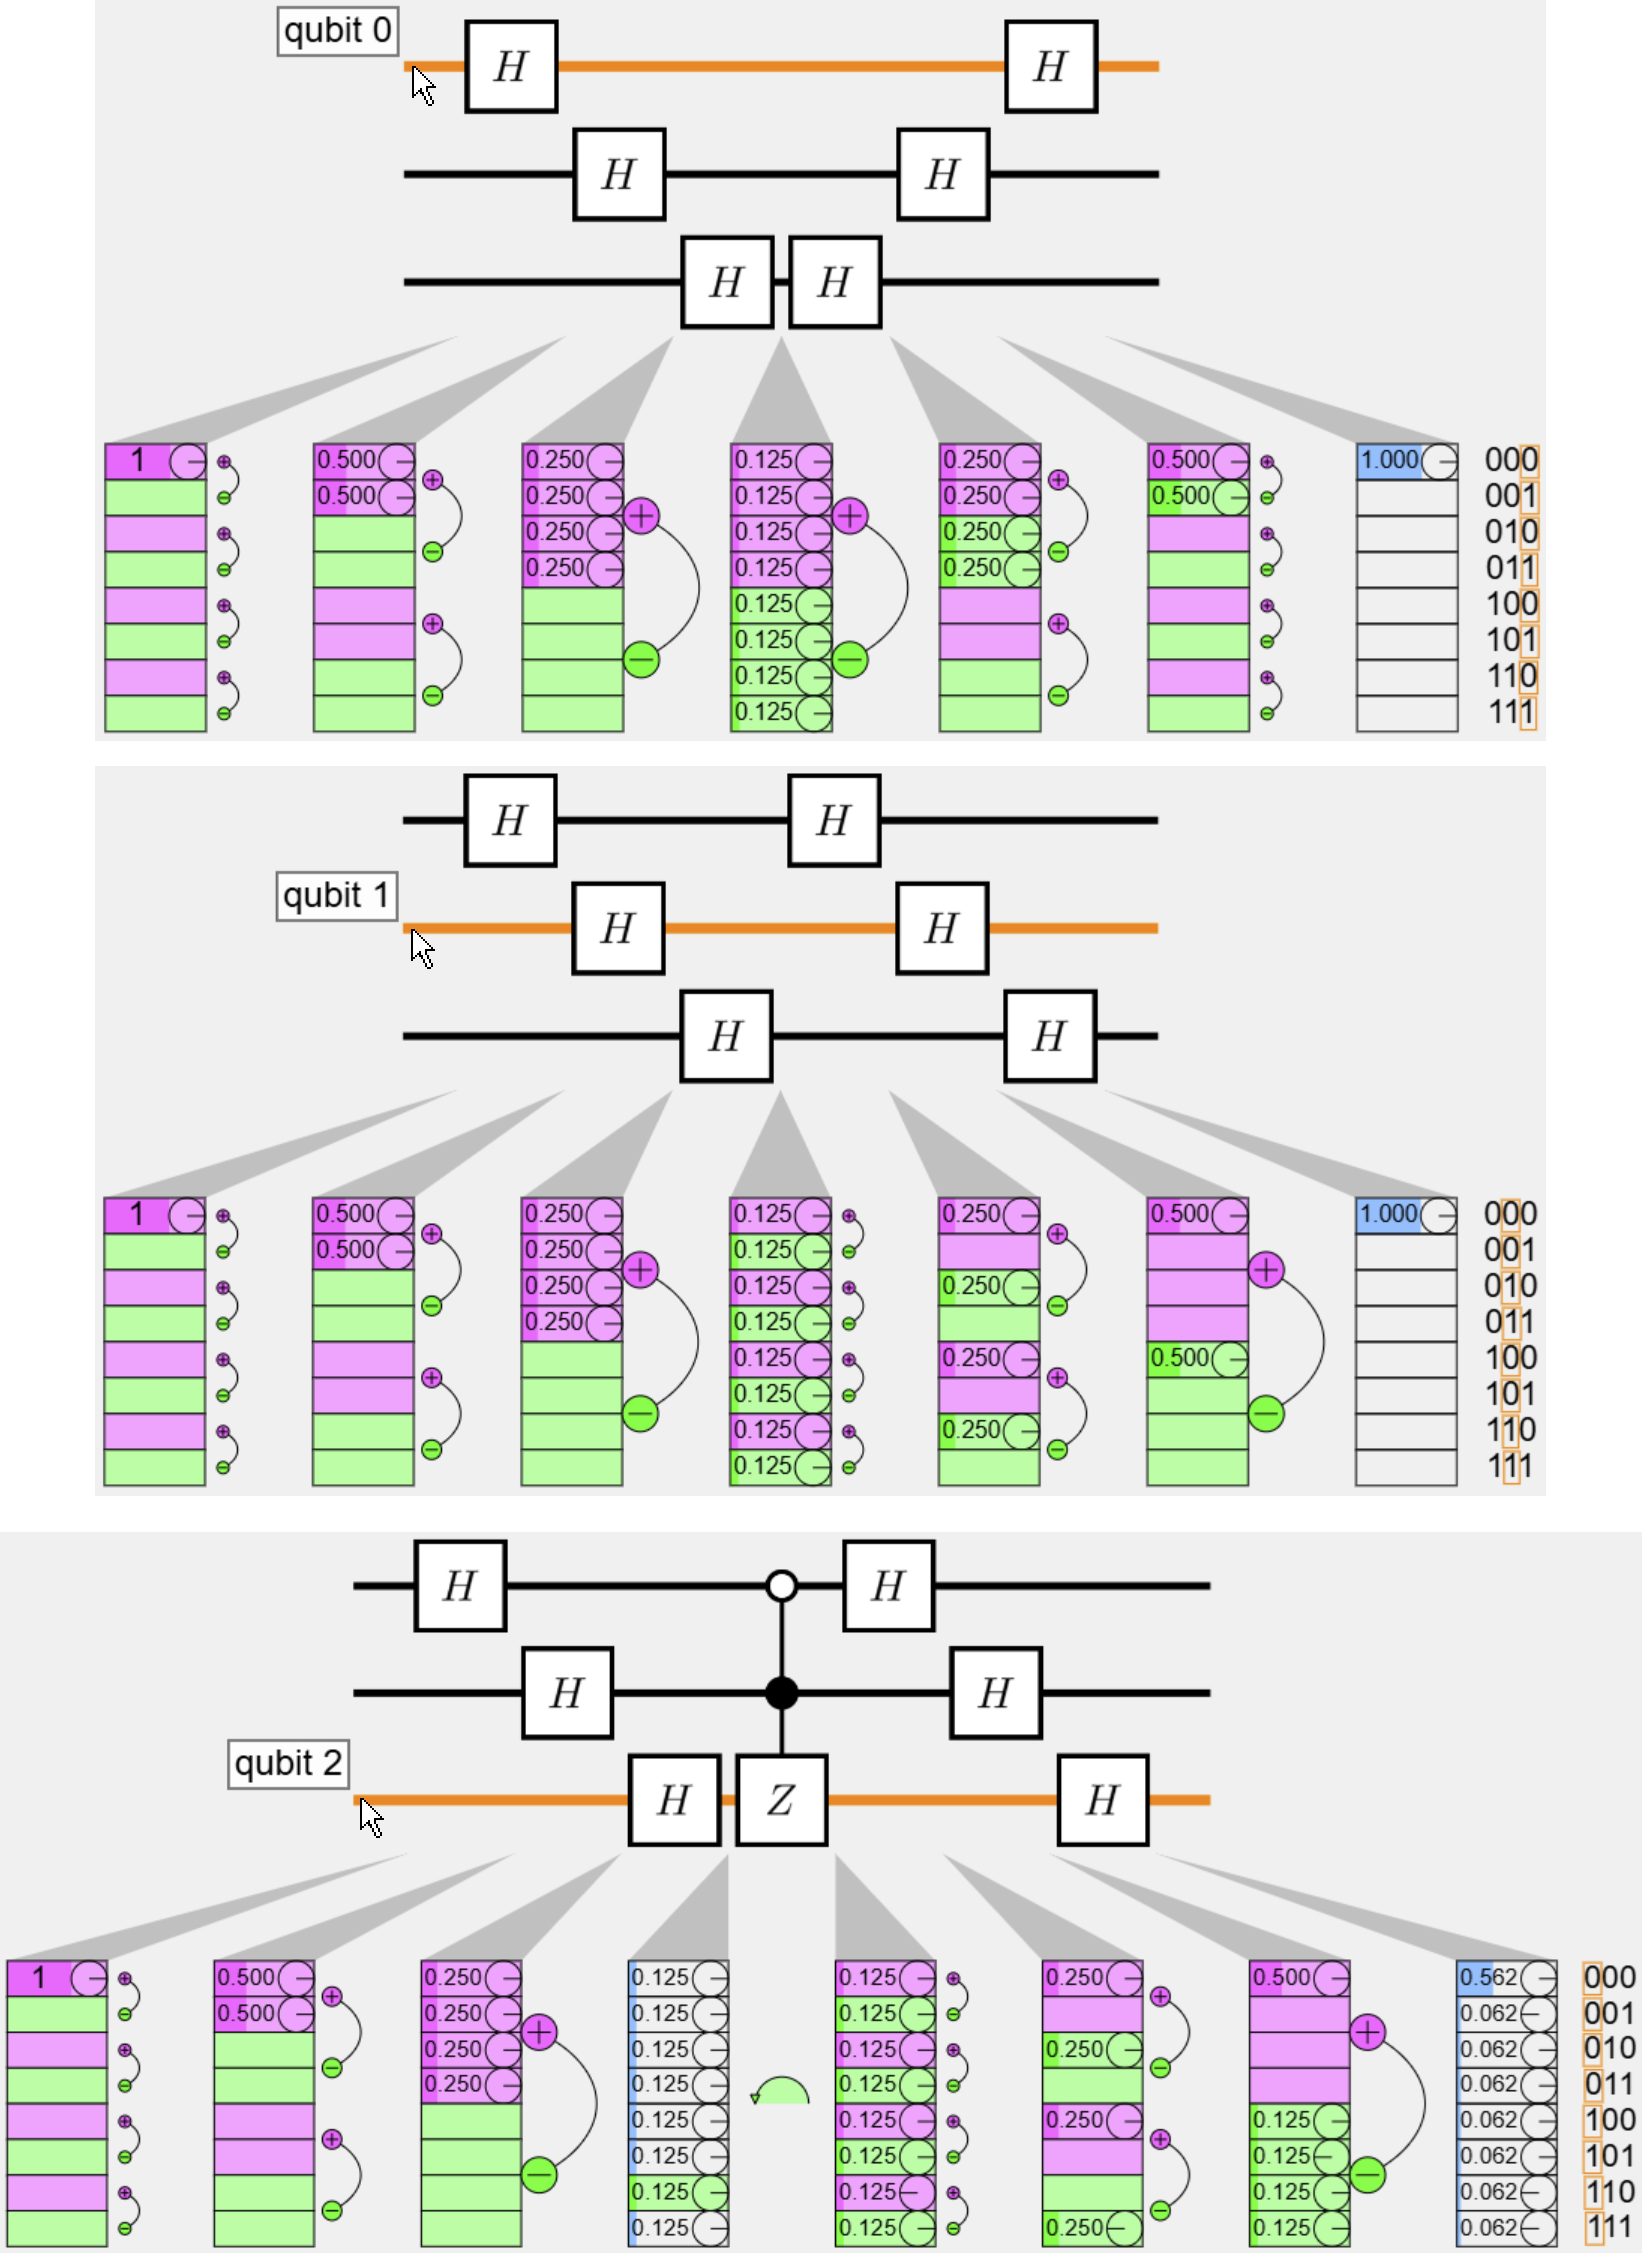
Figure 14: Multiple Hadamard gates distribute and cancel amplitudes across layers.
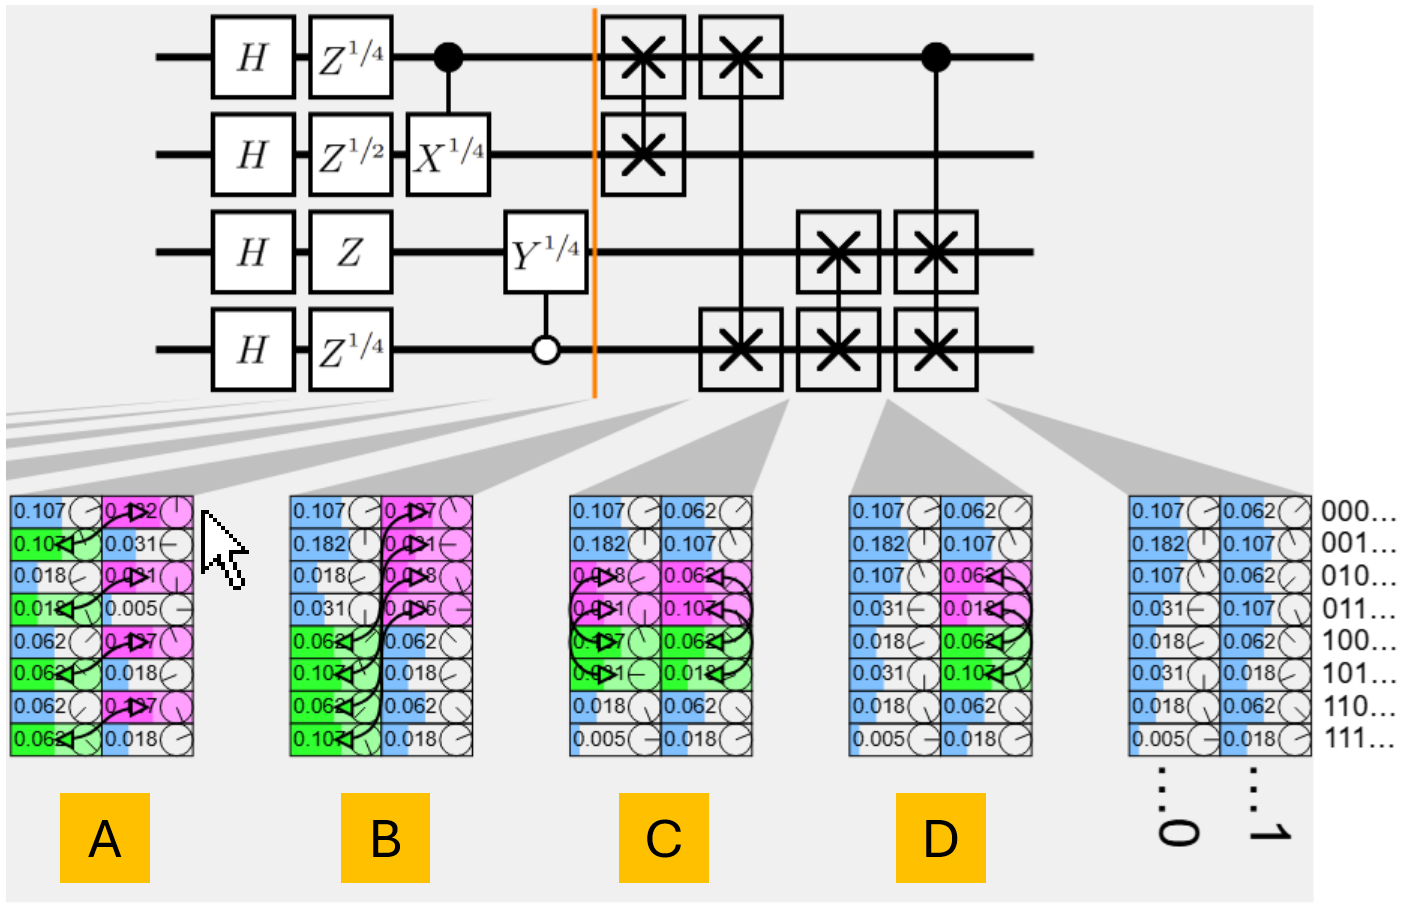
Figure 15: SWAP and controlled-SWAP gates with difference highlighting.
Visual Universality and Generalized Gates
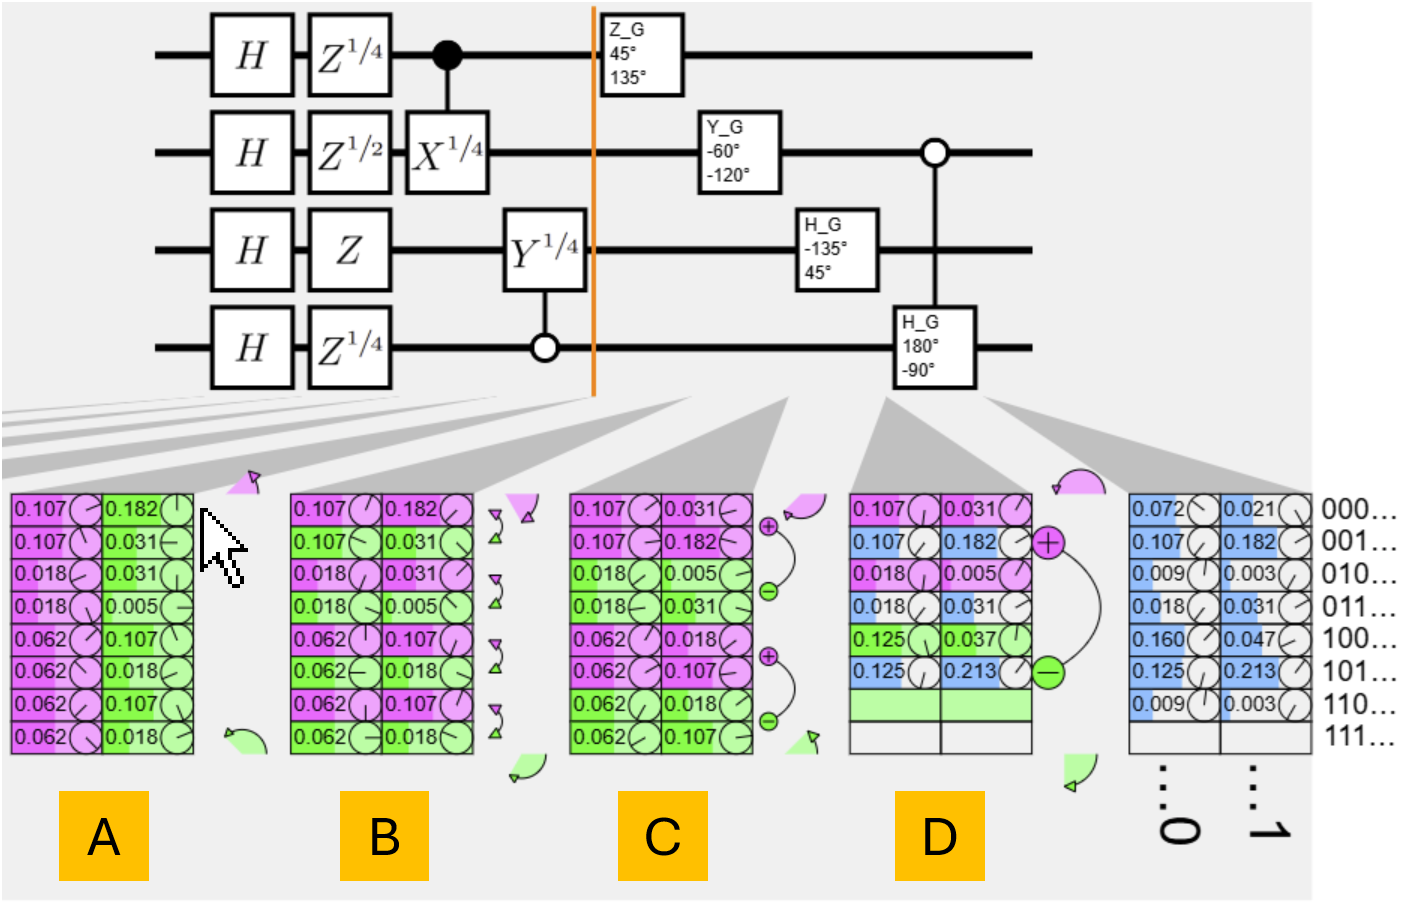
The set of visual primitives is shown to be visually universal for single-qubit gates with arbitrary control/anticontrol qubits. Gates outside the core set can be decomposed into sequences of core gates, enabling their effects to be visualized at the cost of increased circuit depth. The paper introduces generalized Z, Y, and Hadamard gates (ZG, YG, HG) with two angle parameters, allowing more compact expansions and direct visualization of arbitrary single-qubit unitaries.
Figure 16: Difference highlighting for generalized ZG, YG, HG gates, enabling shorter expansions and direct visualization.
Pairwise Qubit Visualization: The Half-Matrix
The triangular half-matrix organizes pairwise metrics (entropy, correlation, concurrence) for all qubit pairs. Each cell corresponds to a pair of qubits, with interactive highlighting and tooltips. The half-matrix reveals entanglement and correlation patterns not visible in single-qubit summaries, supporting analysis of quantum states and circuit behavior.
Figure 17: Half-matrix visualization showing correlation and concurrence for qubit pairs, with bar and glyph encoding.
Case Studies and Examples
The paper presents case studies demonstrating the utility of the proposed visualizations:
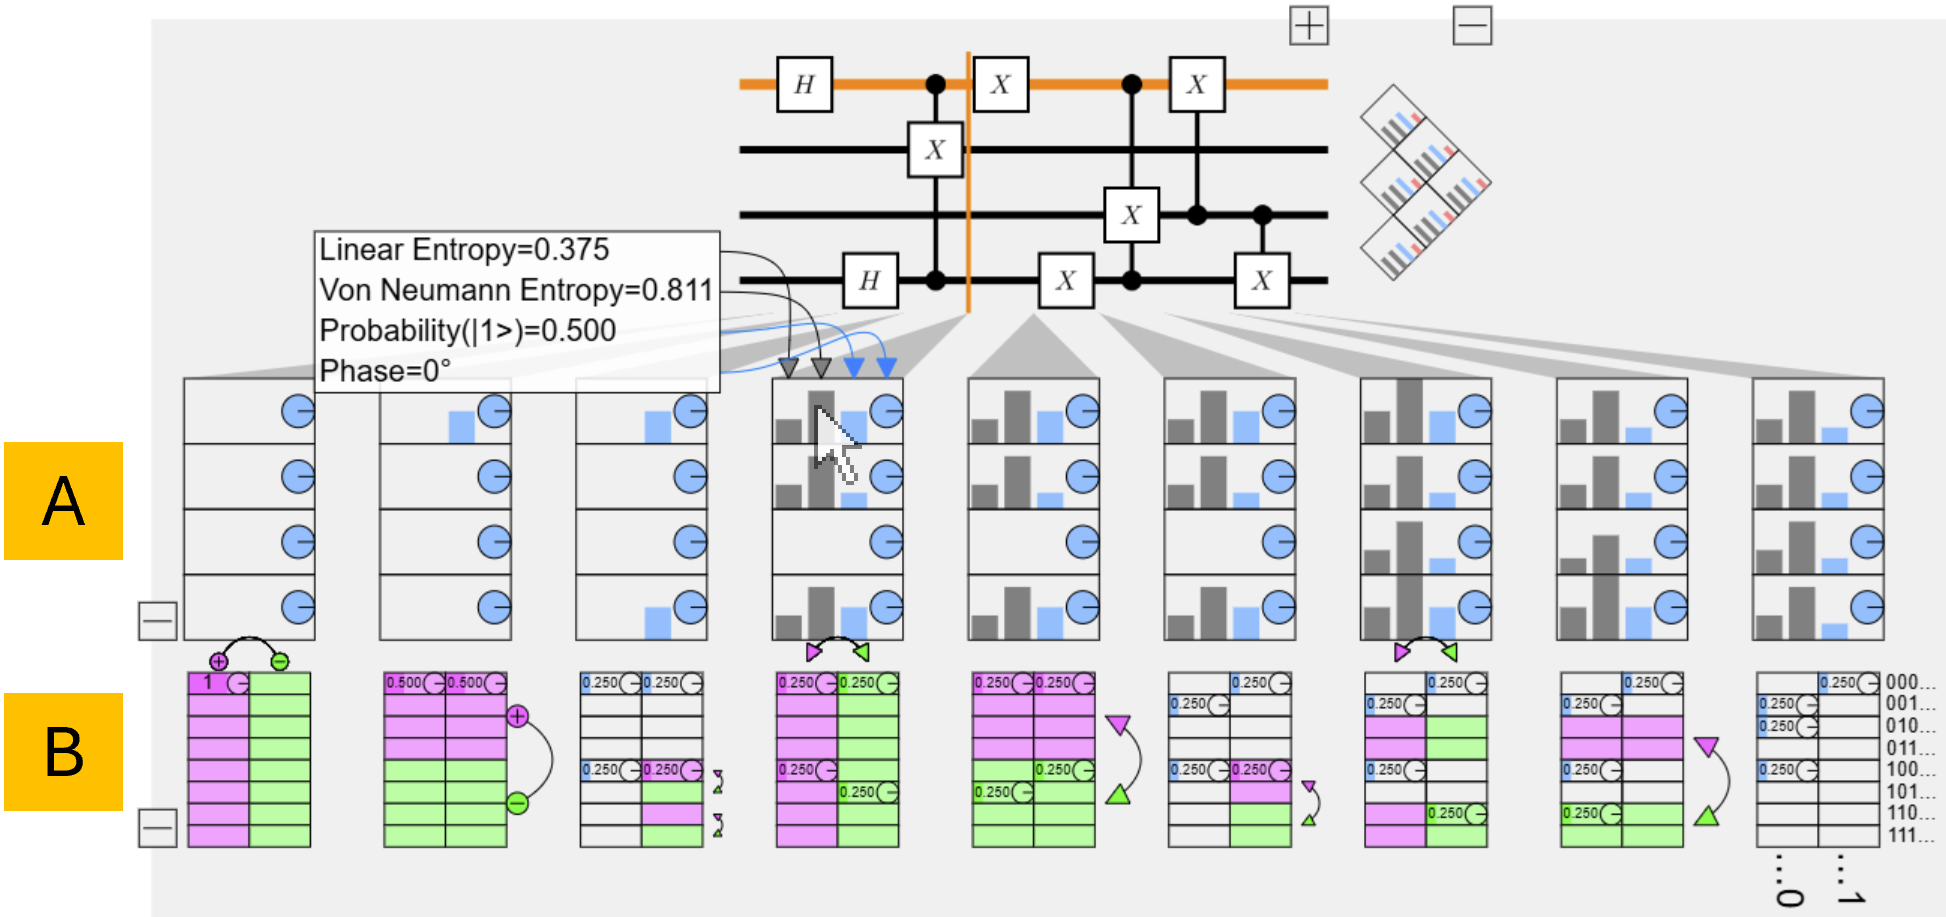
W-4 State Generation: Difference highlighting guides circuit design by showing how gates reposition and rotate amplitudes, facilitating correction of errors and understanding of state evolution.
Figure 18: Circuit generating a W-4 state, comparing reduced state and state vector difference highlighting.
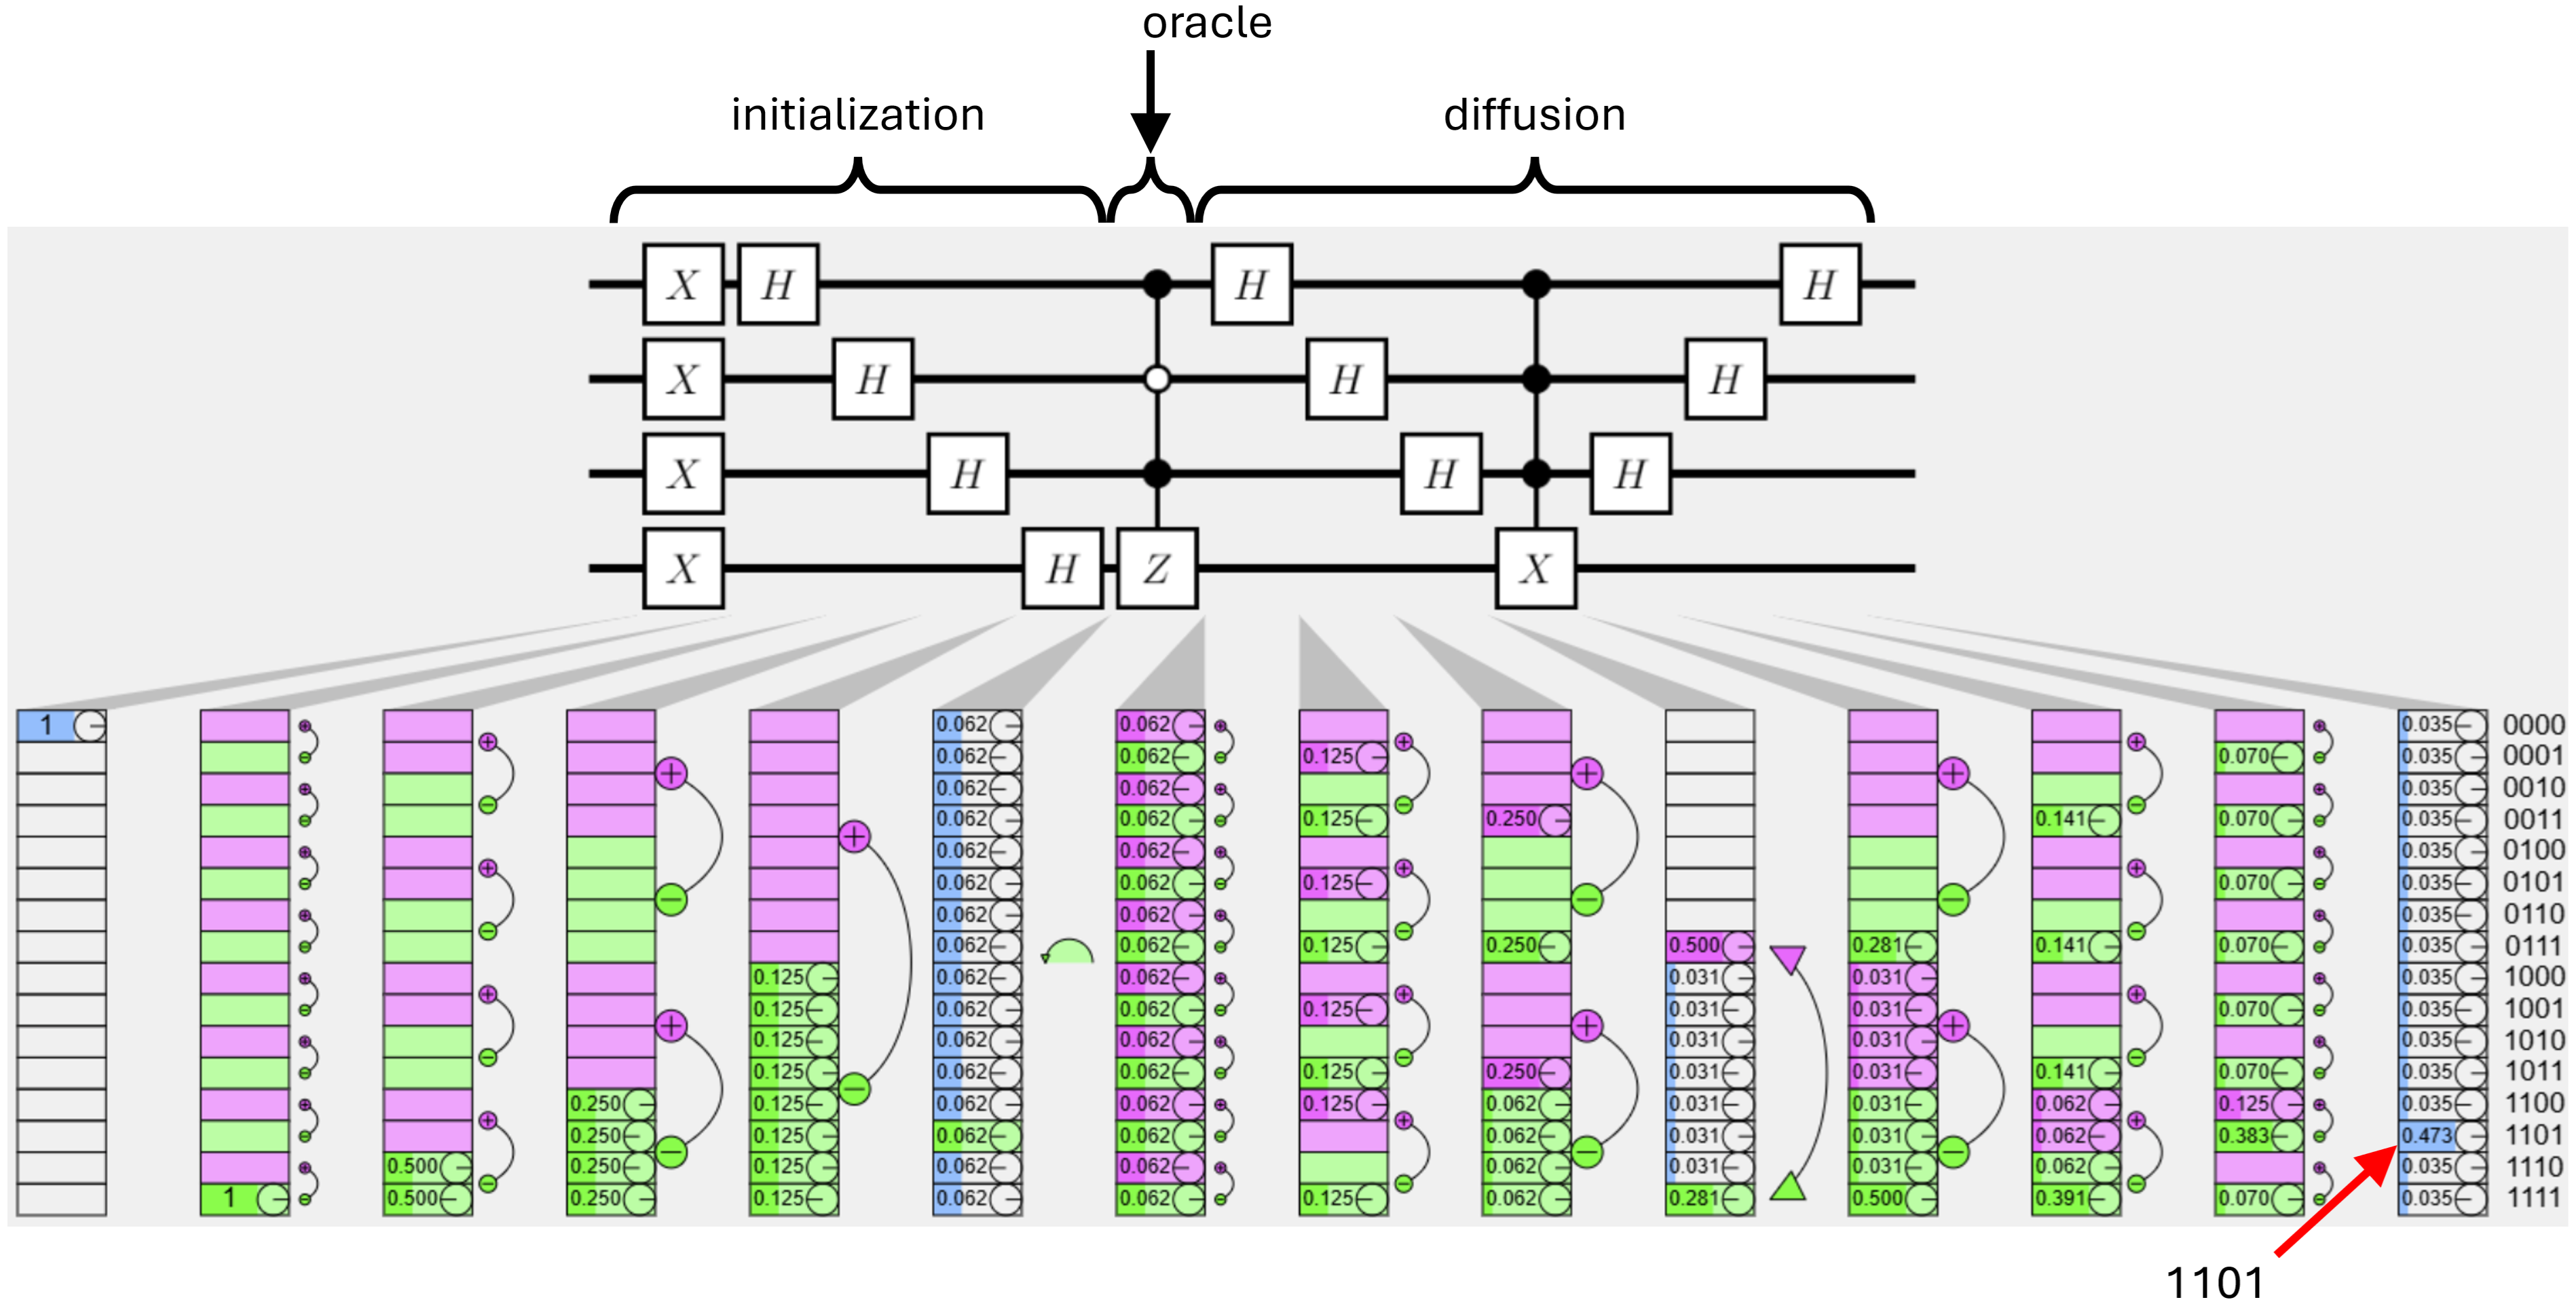
Grover's Algorithm: Visualization of amplitude spreading, oracle marking, and probability concentration illustrates the algorithm's operation.
MuqcsCraft is built atop the Muqcs library, using efficient state vector simulation and partial trace routines for reduced density matrices. The web-based interface encodes circuits in the URL, supporting bookmarking, sharing, and undo via browser navigation. Export features enable interoperability with Quirk and IBM Quantum Composer. The software simulates circuits up to 16 qubits in under 10 ms per gate on commodity hardware, without GPU acceleration.
Limitations
State vector difference highlighting is limited to circuits with ≤8 qubits due to exponential state vector growth. Each gate must occupy its own layer, and only core gates are directly supported; arbitrary gates require expansion into core sequences, which may increase circuit depth and reduce interpretability.
Related Work
The paper situates its contributions within the landscape of quantum circuit visualization, contrasting MuqcsCraft with IBM Quantum Composer, Quirk, and academic systems such as Rainbow boxes, QuFlow, and QuantumEyes. The half-matrix is compared to higher-dimensional Bloch sphere extensions, emphasizing its scalability and 2D simplicity.
Implications and Future Directions
The proposed techniques advance the state of quantum circuit visualization by enabling comprehensive, interpretable feedback on circuit dynamics and entanglement. Practically, these methods support education, debugging, and algorithm design for small-scale quantum circuits. Theoretically, the notion of visual universality provides a framework for extending visualization to arbitrary gate sets.
Future work may focus on scaling difference highlighting to larger circuits via subset visualization, aggregating effects of multi-qubit gates, and exploring alternative basis representations. The half-matrix could be enhanced with wire reordering or selective display of salient qubit pairs.
Conclusion
State vector difference highlighting and the half-matrix visualization provide powerful tools for understanding and designing quantum circuits, overcoming limitations of single-qubit summaries and enabling direct insight into amplitude evolution and entanglement structure. The MuqcsCraft implementation demonstrates the practical feasibility and utility of these techniques, laying groundwork for further advances in quantum circuit visualization and analysis.
“Emergent Mind helps me see which AI papers have caught fire online.”
Philip
Creator, AI Explained on YouTube
Sign up for free to explore the frontiers of research
Discover trending papers, chat with arXiv, and track the latest research shaping the future of science and technology.Discover trending papers, chat with arXiv, and more.