- The paper presents the first complete, high-resolution ultra-low frequency imaging of 173 bright extragalactic radio sources from the 3CRR catalog.
- It employs advanced calibration and imaging techniques, achieving 15″ resolution with 10% flux scale accuracy and robust spectral energy distribution analysis.
- Results reveal critical insights into spectral aging, identification of peaked-spectrum sources, and constraints on synchrotron emission and absorption models.
LOFAR 58 MHz Legacy Survey of the 3CRR Catalog: Technical Summary and Implications
Introduction and Scientific Motivation
The LOFAR 58 MHz Legacy Survey of the 3CRR Catalog presents the first high-resolution, ultra-low-frequency (<100 MHz) imaging of the complete 3CRR sample, targeting 173 of the brightest extragalactic radio sources in the northern hemisphere. The survey leverages the LOFAR Low Band Antenna (LBA) system, achieving 15″ angular resolution at 58 MHz, and provides both total intensity maps and accurate flux density measurements. The primary scientific objectives are to (1) establish a reference dataset for low-frequency radio galaxy studies, (2) enable robust spectral aging analyses, and (3) provide high-fidelity models for calibration of future surveys.
The 3CRR sample is dominated by FR II radio galaxies, with a significant fraction of FR I sources and a subset of giant radio galaxies (GRGs). The survey is motivated by the need to probe synchrotron emission mechanisms, absorption processes (e.g., synchrotron self-absorption, free-free absorption), and the low-energy electron population, which are only accessible at these frequencies and resolutions.
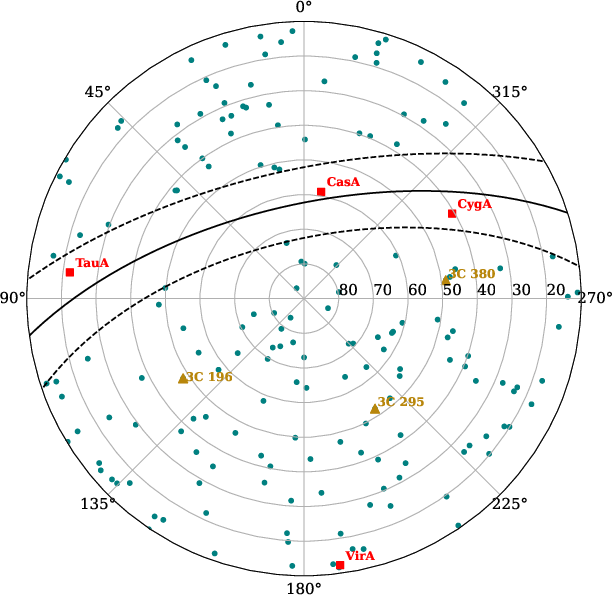
Figure 1: RA/Dec radial plot of the northern hemisphere containing all sources in the catalog, with calibrators and the four brightest sources highlighted.
Observational Strategy and Data Reduction
The survey exploits LOFAR's multi-beam capability, observing 30 directions simultaneously (29 targets + 1 calibrator per session), with each beam allocated a 3.125 MHz bandwidth centered at 57.7 MHz. This approach enables efficient coverage of the entire sample within 46 hours of total observing time, albeit at the cost of limited instantaneous bandwidth per source.
Data reduction employs a tailored calibration pipeline, incorporating:
Imaging Results and Source Characterization
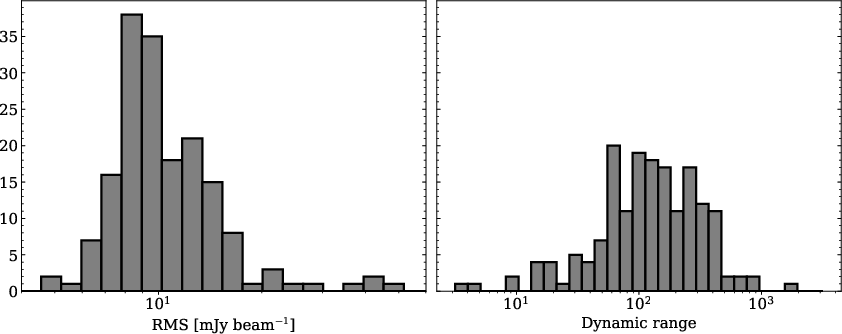
The survey delivers 15″-resolution images for all 3CRR sources, with typical rms noise of 8–16 mJy/beam and dynamic ranges from 20 to 800, depending on source brightness and structure. Extended and low-surface-brightness sources are imaged with additional tapering and multi-scale cleaning to recover diffuse emission, though the limited bandwidth and uv-coverage restrict sensitivity to the faintest structures.
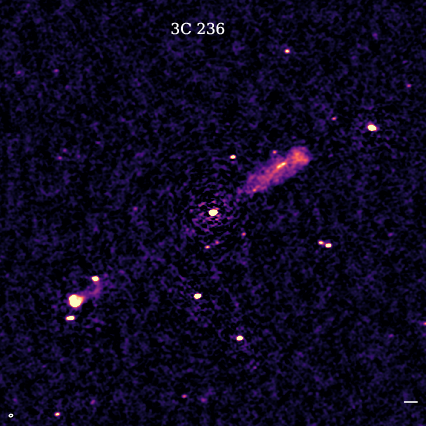
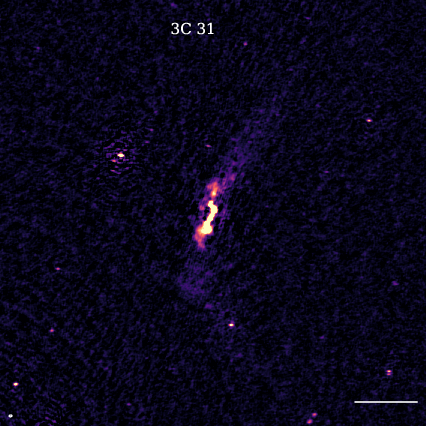
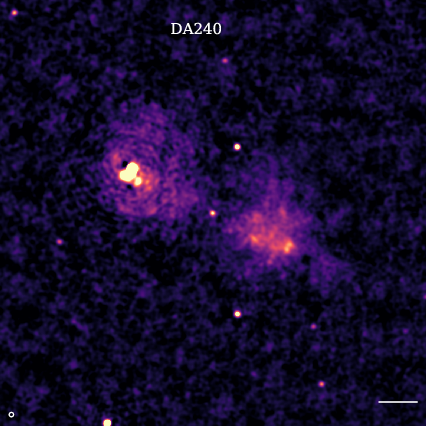
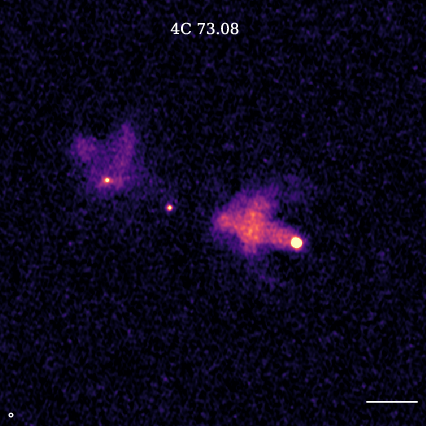
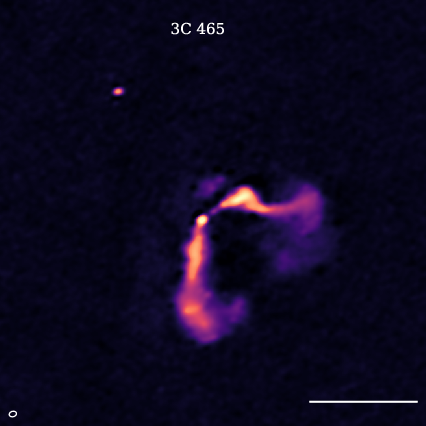
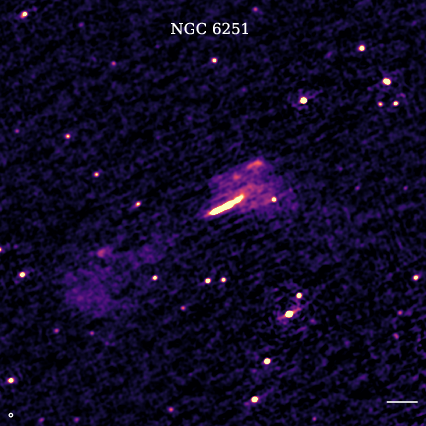
Figure 3: Examples of the most extended sources in the sample, highlighting the recovery of diffuse emission at 58 MHz.
Astrometric accuracy is typically 2–5″, sufficient for cross-matching with higher-frequency surveys. Challenging cases involving close source pairs or strong off-axis contamination are addressed via peeling and joint calibration strategies.
Flux Density Scale and Spectral Energy Distributions
A rigorous validation of the LOFAR LBA flux scale is performed by constructing broadband SEDs for each source, incorporating literature measurements (20 MHz–10 GHz) and correcting for flux scale discrepancies. Polynomial fits (up to 4th order) are used to interpolate/extrapolate the expected 58 MHz flux, against which the LOFAR measurements are compared.
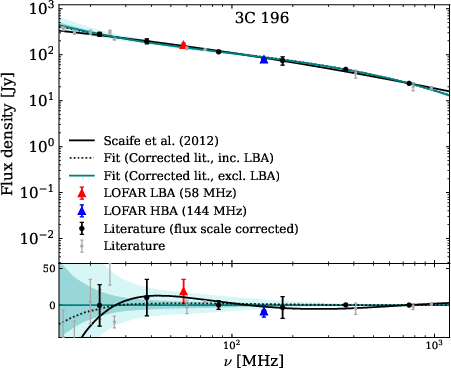
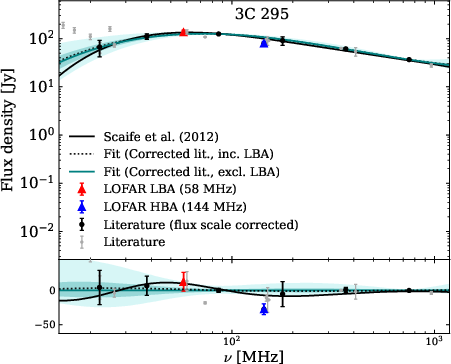
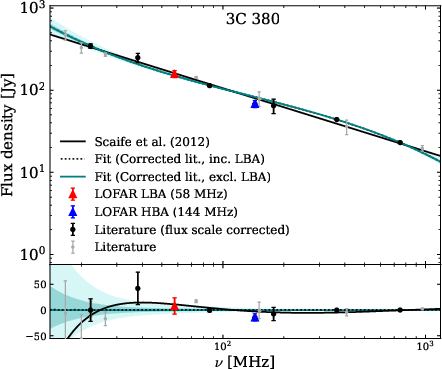
Figure 4: Synchrotron spectra of the calibrators, showing the agreement between LOFAR LBA measurements and literature SEDs.
The analysis demonstrates:
- No systematic offset in the LBA flux scale for high-SNR sources, with a mean ratio SLBA/SSED=1.00±0.09 (excluding variable/compact quasars).
- Adopted calibration error of 10% for LBA fluxes.
- LoTSS (HBA) fluxes show a systematic underestimation of ∼5% relative to SED expectations.
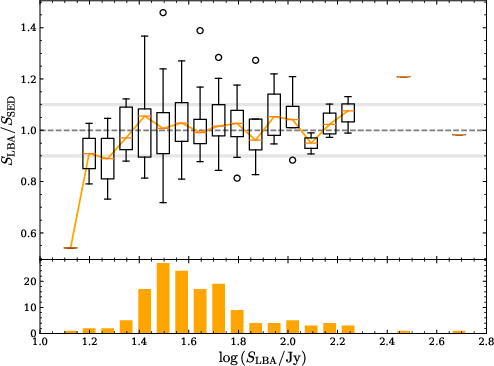
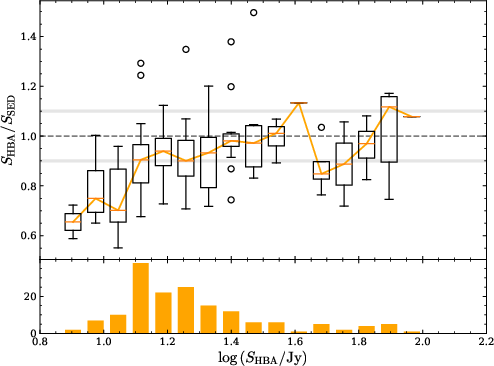
Figure 5: Left: LBA flux accuracy statistics; Right: LoTSS flux accuracy, showing the systematic underestimation.
The survey also provides integrated spectral indices between 58 and 144 MHz, with a median value of 0.88, and identifies sources with anomalous spectral behavior, often attributable to variability or absorption effects.
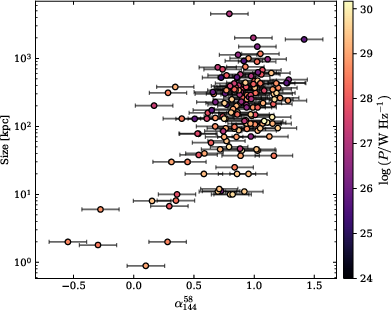
Figure 6: Distribution of low-frequency spectral index as a function of physical size and radio power.
Comparison with AARTFAAC 60 MHz measurements reveals significant discrepancies below 50 Jy, confirming the superior accuracy of the dedicated LOFAR LBA survey for bright sources.
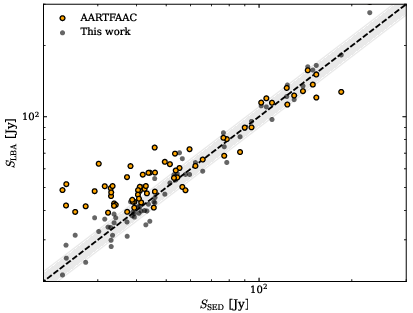
Figure 7: LBA flux comparison for 70 sources as measured by AARTFAAC and this work.
Peaked Spectrum Sources and Synchrotron Self-Absorption
The inclusion of 58 MHz data enables robust identification of peaked-spectrum sources (GPS/CSS), with 55 sources (32% of the sample) exhibiting spectral turnovers between 10–500 MHz. The peak frequency correlates inversely with physical size and directly with radio power, consistent with synchrotron self-absorption in compact, luminous sources.
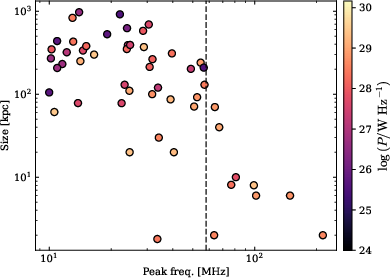
Figure 8: Peak frequency as a function of physical size, with color indicating radio power; the dashed line marks the LBA frequency.
For sources with well-constrained peaks above 58 MHz, magnetic field strengths are estimated under the SSA hypothesis, using the standard relation:
Bssa∝(arcsec2Ωs)2Sν−2νp5
The derived Bssa values are generally consistent with equipartition estimates for most sources, except in cases where free-free absorption is likely dominant (e.g., 3C 295).
Limitations and Future Prospects
The survey's main limitations stem from the narrow instantaneous bandwidth (3 MHz per source), leading to suboptimal uv-coverage and elevated noise for some sources. The dynamic range is further limited by the presence of bright cores and incomplete recovery of diffuse emission in the most extended sources. Despite these constraints, the flux scale is robust for high-SNR sources, and the dataset provides a unique resource for low-frequency radio galaxy studies.
The survey establishes a foundation for:
- Spatially resolved spectral aging analyses at ultra-low frequencies, enabling direct tests of JP/KP models and injection indices.
- Calibration of future wide-field, low-frequency surveys, leveraging the published high-resolution models.
- Magnetic field estimation in compact sources via SSA modeling, with potential for expansion using even lower-frequency (10–30 MHz) observations and VLBI with international LOFAR stations.
Conclusion
The LOFAR 58 MHz Legacy Survey of the 3CRR Catalog constitutes the first complete, high-resolution imaging of the brightest northern radio galaxies at ultra-low frequencies. The survey delivers validated flux densities, spectral indices, and morphological information for 173 sources, with a demonstrated LBA flux scale accuracy of 10%. The dataset enables new constraints on synchrotron emission and absorption processes, identification of peaked-spectrum sources, and magnetic field estimation in compact AGN. The published maps and models will serve as a reference for future low-frequency radio astronomy, calibration, and spectral aging studies, and motivate further development of ultra-low-frequency VLBI and broadband imaging techniques.