Unmasking the Role of Remote Sensors in Comfort, Energy and Demand Response
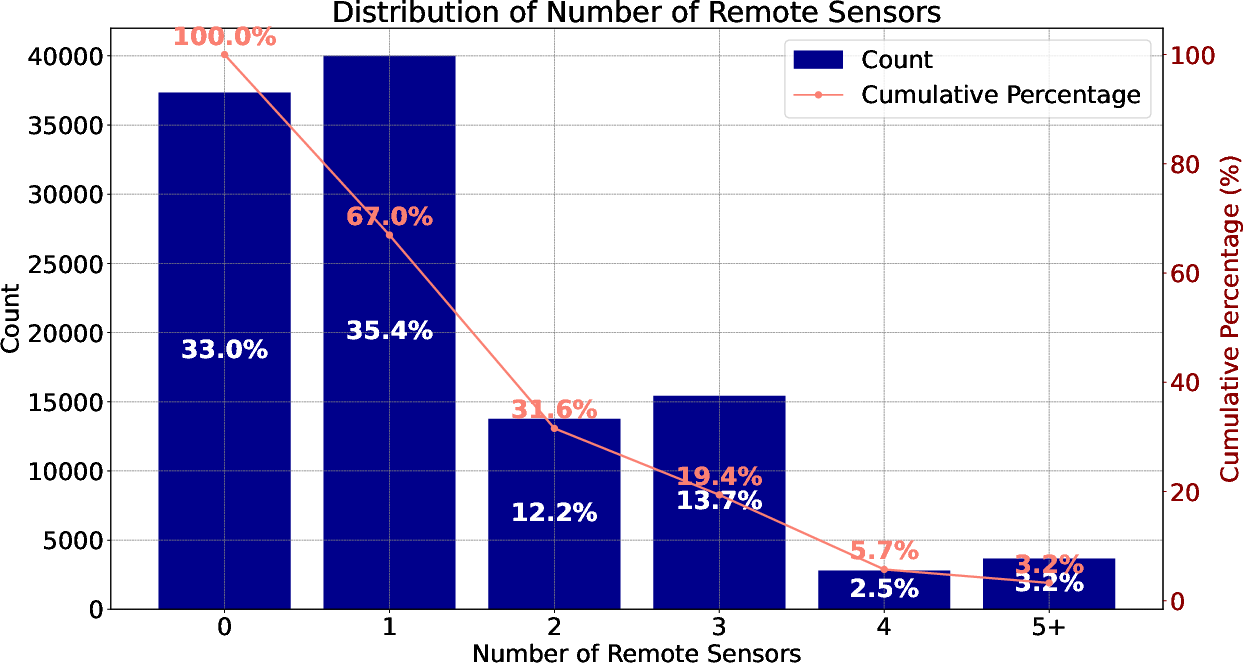
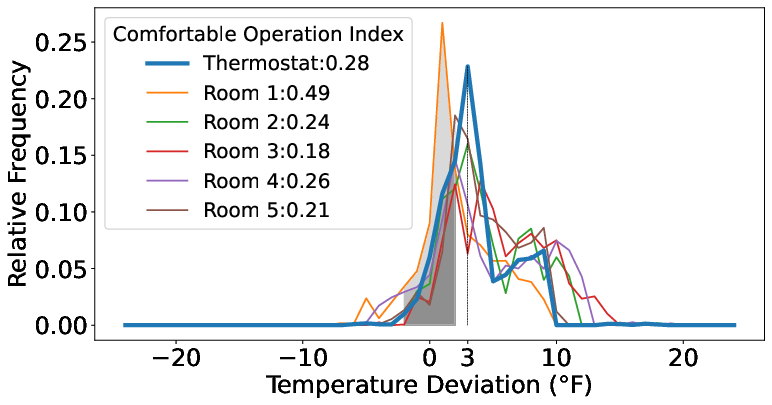
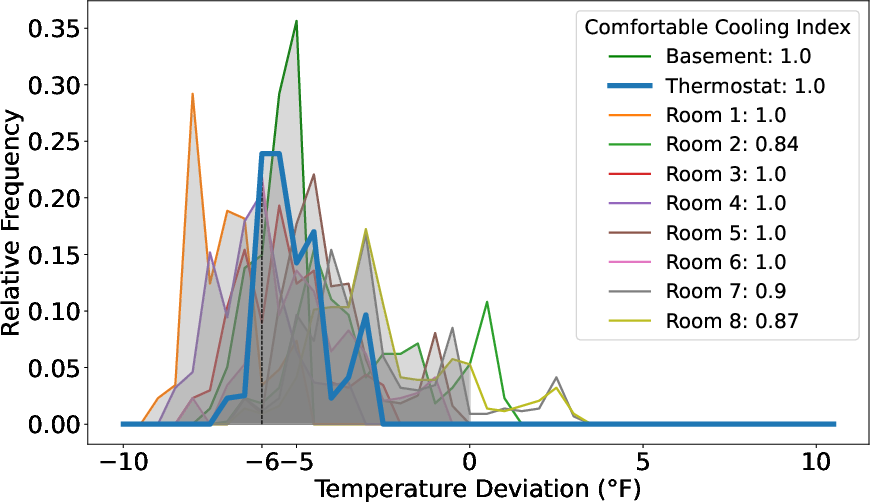
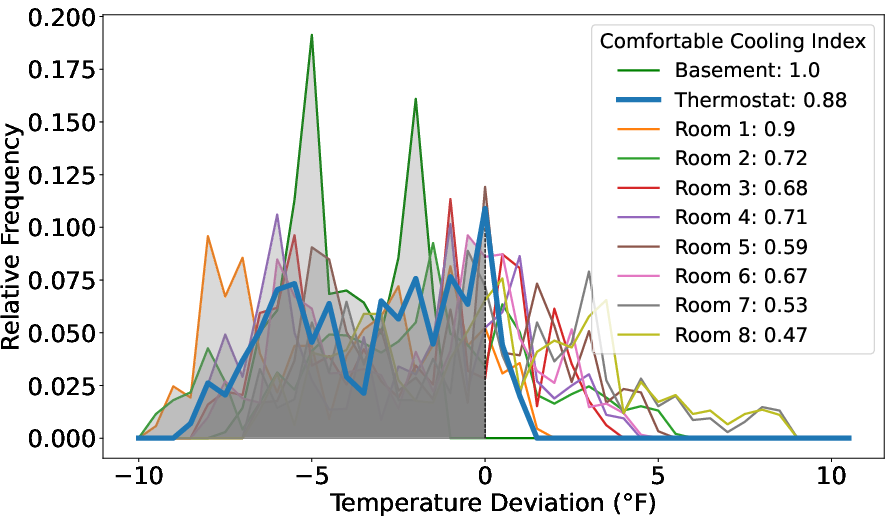
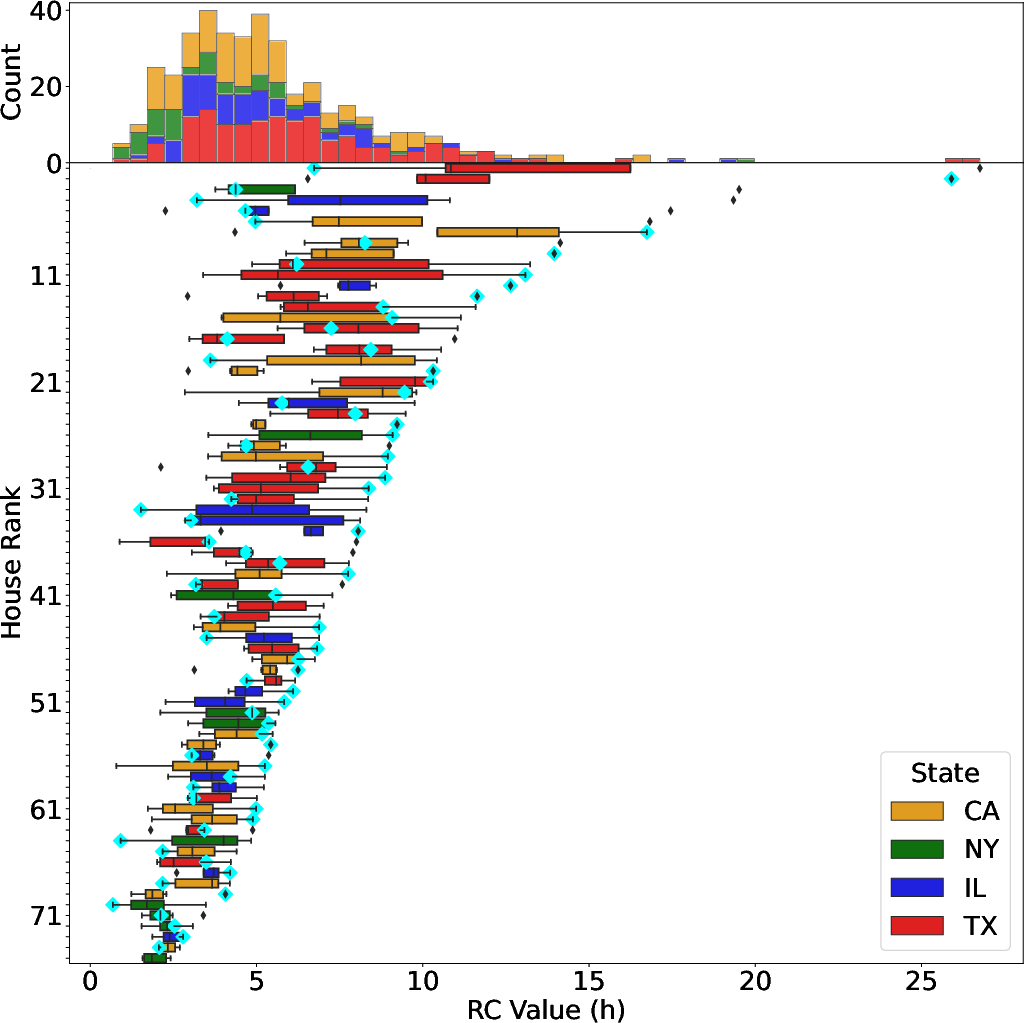
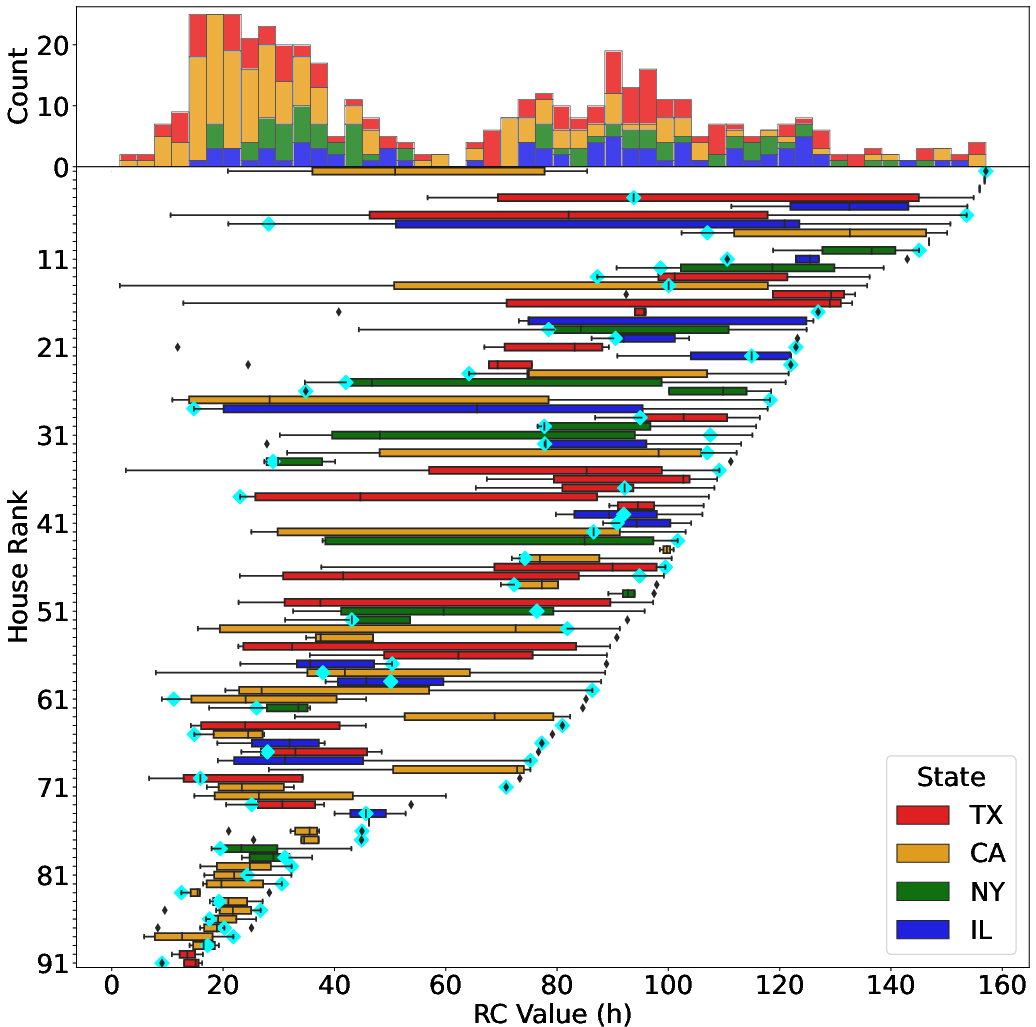
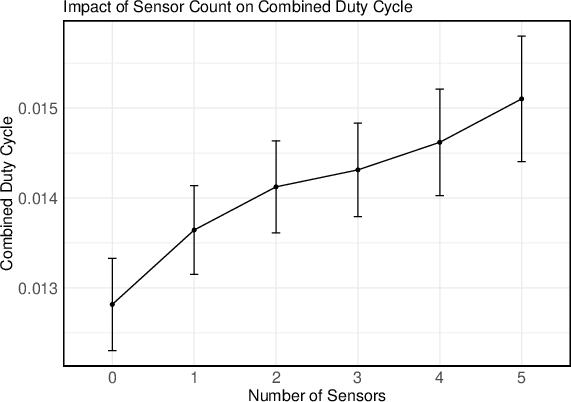
Abstract: In single-zone multi-node systems (SZMRSs), temperature controls rely on a single probe near the thermostat, resulting in temperature discrepancies that cause thermal discomfort and energy waste. Augmenting smart thermostats (STs) with per-room sensors has gained acceptance by major ST manufacturers. This paper leverages additional sensory information to empirically characterize the services provided by buildings, including thermal comfort, energy efficiency, and demand response (DR). Utilizing room-level time-series data from 1,000 houses, metadata from 110,000 houses across the United States, and data from two real-world testbeds, we examine the limitations of SZMNSs and explore the potential of remote sensors. We discovered that comfortable DR durations (CDRDs) for rooms are typically 70% longer or 40% shorter than for the room with the thermostat. When averaging, rooms at the control temperature's bounds are typically deviated around -3{\deg}F to 2.5{\deg}F from the average. Moreover, in 95% of houses, we identified rooms experiencing notably higher solar gains compared to the rest of the rooms, while 85% and 70% of houses demonstrated lower heat input and poor insulation, respectively. Lastly, it became evident that the consumption of cooling energy escalates with the increase in the number of sensors, whereas heating usage experiences fluctuations ranging from -19% to +25%. This study serves as a benchmark for assessing the thermal comfort and DR services in the existing housing stock, while also highlighting the energy efficiency impacts of sensing technologies. Our approach sets the stage for more granular, precise control strategies of SZMNSs.
- Comparing gray box methods to derive building properties from smart thermostat data. In Proceedings of the 6th ACM international conference on systems for energy-efficient buildings, cities, and transportation, pages 223–232, 2019.
- Adapting to climate change: The remarkable decline in the us temperature-mortality relationship over the twentieth century. Journal of Political Economy, 124(1):105–159, 2016.
- Comfort standards and variations in exceedance for mixed-mode buildings. Building Research & Information, 39(2):118–133, 2011.
- A review of indices for the long-term evaluation of the general thermal comfort conditions in buildings. Energy and Buildings, 53:194–205, 2012.
- Ecobee. Donate your data, July 2023a. URL https://www.ecobee.com/en-us/donate-your-data/.
- Ecobee, July 2023b. URL https://www.ecobee.com/en-us/.
- A novel approach in smart ventilation using wirelessly controllable dampers. In 2017 IEEE 30th Canadian Conference on Electrical and Computer Engineering (CCECE), pages 1–5. IEEE, 2017.
- Keen Home, July 2023. URL https://keenhome.io/products/smart-vent.
- Evaluation of data-driven thermal models for multi-hour predictions using residential smart thermostat data. Journal of Building Performance Simulation, 15(4):445–464, 2022.
- ISO 7730:2005. Ergonomics of the thermal environment — Analytical determination and interpretation of thermal comfort using calculation of the PMV and PPD indices and local thermal comfort criteria. Standard, International Organization for Standardization, 2005.
- Analyzing energy usage on a city-scale using utility smart meters. In Proceedings of the 3rd ACM International Conference on Systems for Energy-Efficient Built Environments, pages 51–60, 2016.
- Estimating time constants for over 10,000 residential buildings in north america: Towards a statistical characterization of thermal dynamics. 2018.
- Low-cost conversion of single-zone hvac systems to multi-zone control systems using low-power wireless sensor networks. Sensors, 20(13):3611, 2020.
- Jen King. Energy impacts of smart home technologies. Report A1801, 2018.
- Hot, cold and in between: enabling fine-grained environmental control in homes for efficiency and comfort. In Proceedings of the 5th international conference on Future energy systems, pages 123–132, 2014.
- Alea Labs, July 2023. URL https://alealabs.com/.
- Energy flexibility of residential buildings: A systematic review of characterization and quantification methods and applications. Advances in Applied Energy, 3:100054, 2021.
- Multi-sensor single-actuator control of hvac systems. 2002.
- Na Luo and Tianzhen Hong. Ecobee donate your data 1,000 homes in 2017. Technical report, Pacific Northwest National Lab.(PNNL), Richland, WA (United States …, 2022.
- Unmasking the thermal behavior of single-zone multi-room houses: An empirical study. In Proceedings of the 10th ACM International Conference on Systems for Energy-Efficient Buildings, Cities, and Transportation, pages 21–30, 2023.
- Google Nest, July 2023. URL https://store.google.com/us/product/nest_learning_thermostat_3rd_gen?sku=_nest_learning_thermostat_3rd_gen&hl=en-US.
- Design architecture for multi-zone hvac control systems from existing single-zone systems using wireless sensor networks. In Smart Structures, Devices, and Systems III, volume 6414, pages 239–246. SPIE, 2007.
- Temperature sensing optimization for home thermostat retrofit. Sensors, 21(11):3685, 2021.
- A study on the control of indoor temperature in typical canadian homes. In Scott Walbridge, Mazdak Nik-Bakht, Kelvin Tsun Wai Ng, Manas Shome, M. Shahria Alam, Ashraf El Damatty, and Gordon Lovegrove, editors, Proceedings of the Canadian Society of Civil Engineering Annual Conference 2021, pages 429–441, Singapore, 2023. Springer Nature Singapore. ISBN 978-981-19-1061-6.
- Roomzoner: occupancy-based room-level zoning of a centralized hvac system. In Proceedings of the ACM/IEEE 4th international conference on cyber-physical systems, pages 209–218, 2013.
- Iain S Walker. Register closing effects on forced air heating system performance. Technical report, Lawrence Berkeley National Lab.(LBNL), Berkeley, CA (United States), 2003.
- Alphabuilding rescommunity: A multi-agent virtual testbed for community-level load coordination. Advances in Applied Energy, 4:100061, 2021.
Paper Prompts
Sign up for free to create and run prompts on this paper using GPT-5.
Top Community Prompts
Collections
Sign up for free to add this paper to one or more collections.