- The paper demonstrates that bioclimatic zones shift at a rate of ~12% per +1K warming, employing a streamlined Köppen-Geiger classification.
- It applies CMIP6 ensemble models to quantify spatial redistribution, highlighting major shifts in high-latitude regions with up to 15% land change at 4K warming.
- The findings suggest that maintaining warming at 1.5K can save over 7 million km² of land from significant ecological transitions, informing climate policy.
Quantifying Bioclimatic Response to Global Warming from CMIP6 Climate Projections
Introduction
This study rigorously assesses the sensitivity of terrestrial bioclimatic zones to varying degrees of global warming using the Köppen-Geiger (KG) bioclimate classification applied across an ensemble of CMIP6 Earth System Models (ESMs). It evaluates model performance against observations in the historical period, introduces a streamlined classification for enhanced interpretability, and systematically quantifies the shifting global biome distribution as a function of globally-averaged temperature rise. Unlike previous approaches focused on model-year projections or emissions scenarios, here bioclimatic shifts are analyzed at fixed warming levels (1.5K, 2K, 4K above 1901–1931 baseline), directly aligning with Paris Agreement temperature targets.
Methodology
Climate Classification and Data Processing
The KG scheme, leveraging monthly temperature and precipitation thresholds, is implemented in a form optimized for contemporary climate analysis: C and D climates are demarcated at a 0°C minimum threshold, precipitation seasonality is prioritized in B (dry) climates using a 70% rule, and class mutual exclusivity is enforced for C/D subtypes. To enhance interpretability, a streamlined version reduces the original 30 categories into 13 clusters.
Climate data originate from six CMIP6 models and are regridded to match the 0.5° resolution of CRU TS v.4.05 observations. Anomalies are normalized to a 1901-1931 reference period, and scenario ssp585 is used to ensure all models reach requisite warming milestones. Bioclimate maps and difference matrices are produced at target warming levels by aggregating model outputs.
The models are evaluated on two dimensions: (1) the percentage of global land area whose KG class matches observations annually (classification correctness), and (2) the percentage change in land area classification relative to initial historical period. Rolling 30-year means are used for smoothing. Analytical focus is given to the differentiation between individual model outputs and the ensemble mean.
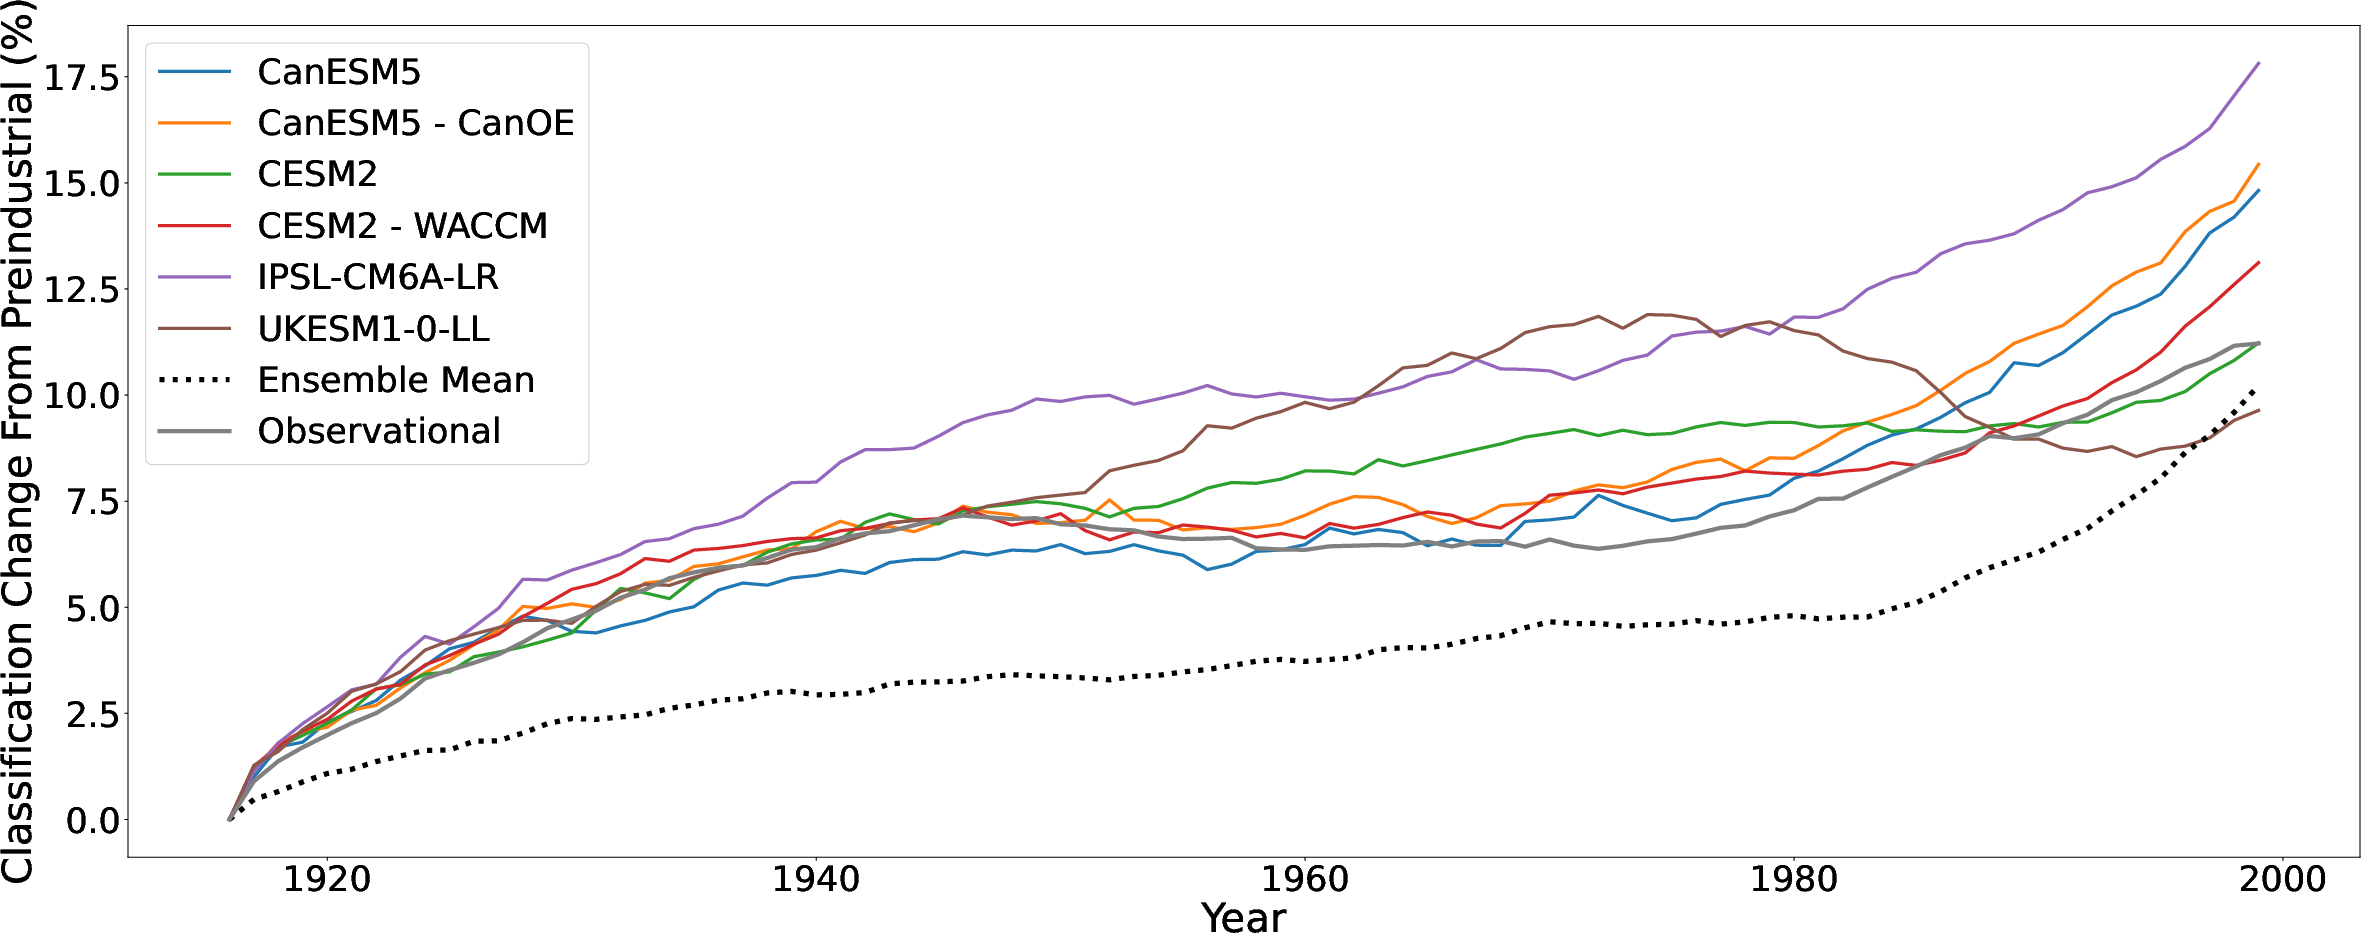
Figure 1: Percentage land area change from initial classifications without anomaly correction. The ensemble mean yields less classification change due to inter-model variation minimization.
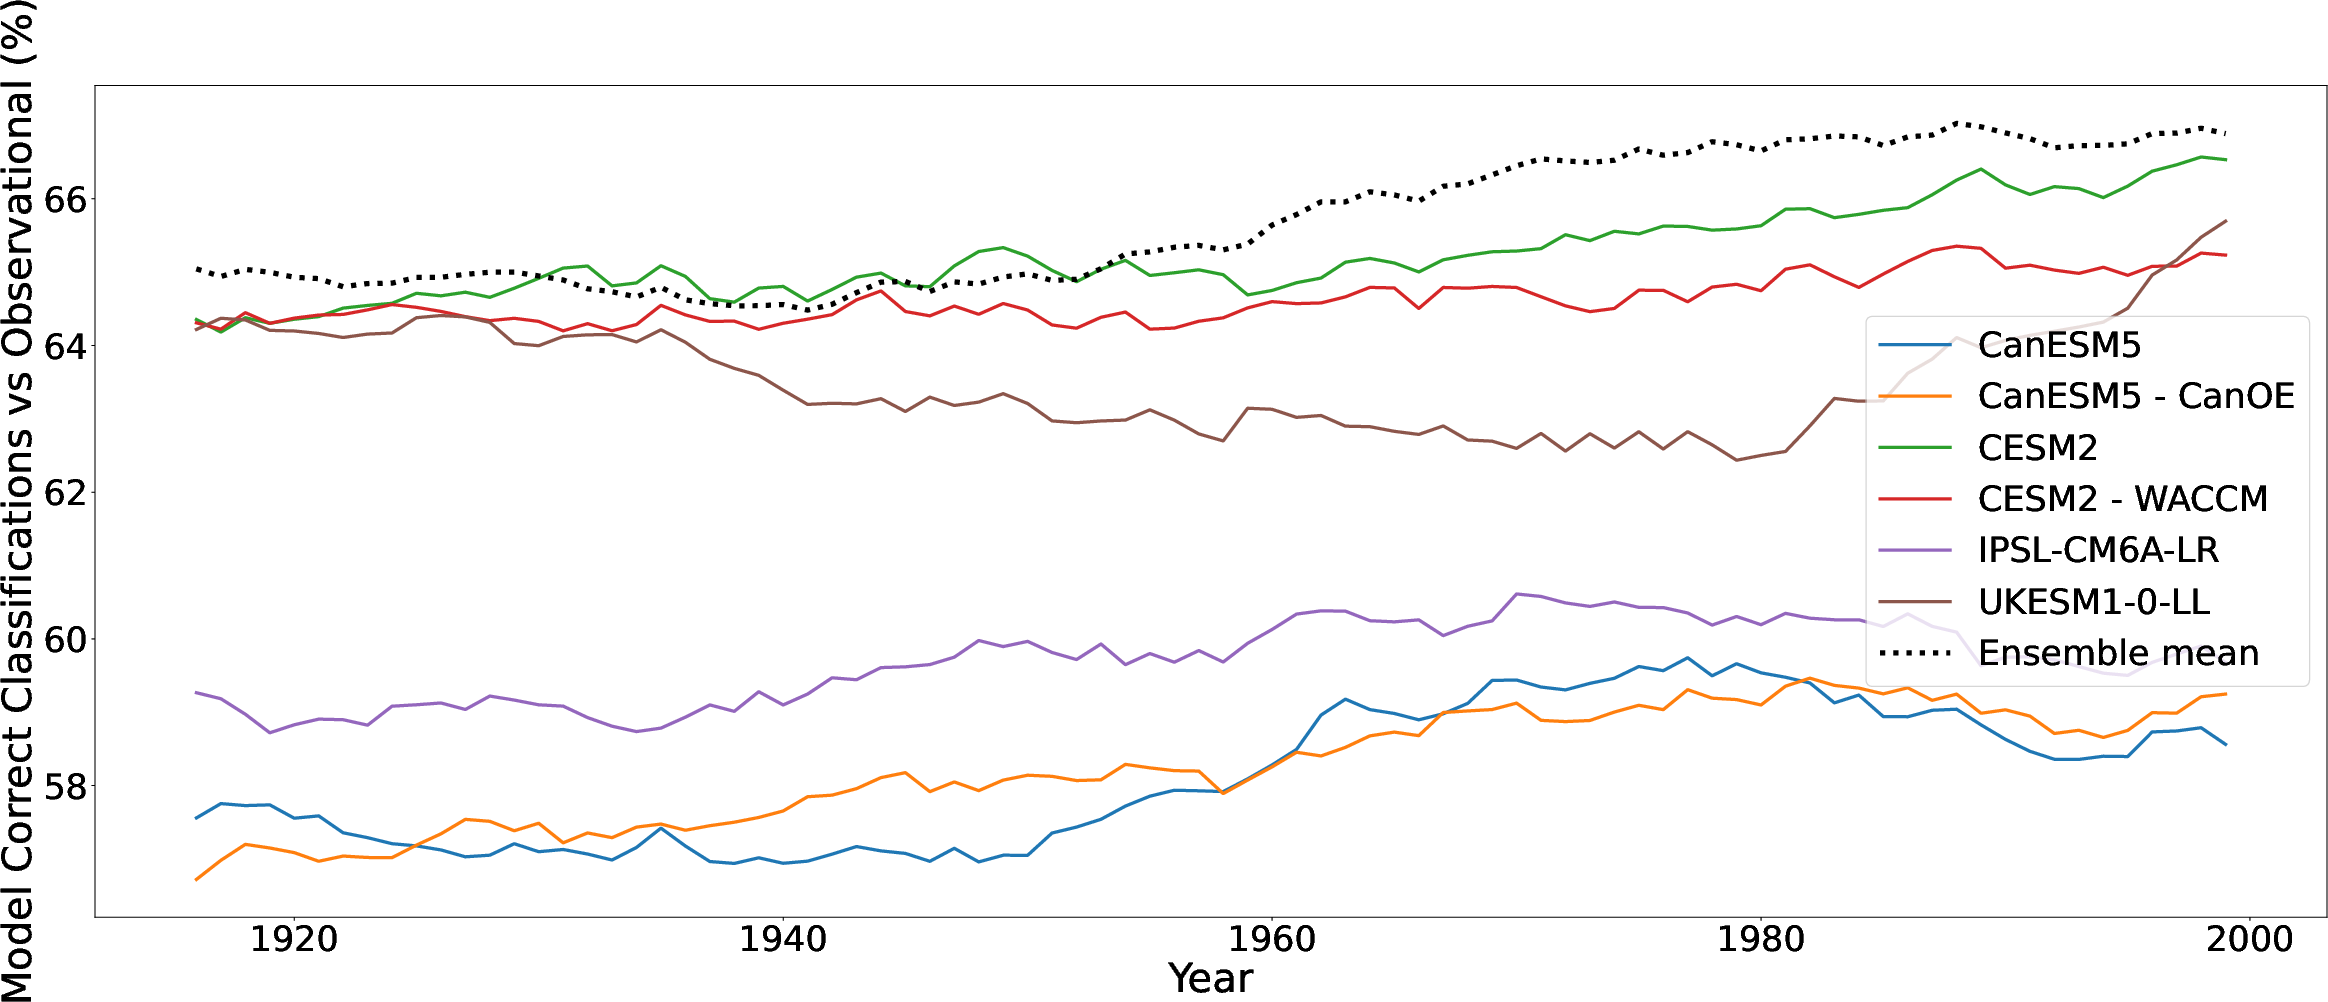
Figure 2: Percentage land area correctly classified without anomaly correction. The ensemble mean delivers the most consistent performance relative to observations.
Results
Individual CMIP6 models display variability in correctly reproducing observed bioclimatic distributions, with notable deviations in aridification tendencies (e.g., Amazon desertification in CanESM5). Despite such biases, the ensemble mean consistently reduces spurious changes, offering stable aggregate performance for annual classifications but underestimating dynamical variability observed in individual models and the real climate (Figures 1 and 2). Thus, the ensemble mean is robust for static classification projections yet less applicable for variability studies.
Projected Bioclimatic Shifts Under Warming
Spatial mapping at graded warming levels reveals progressive and spatially coherent redistribution of bioclimates. High-latitude regions (northern America and Eurasia) exhibit major class transitions, chiefly from cold, wet regimes to warmer/drier biomes.
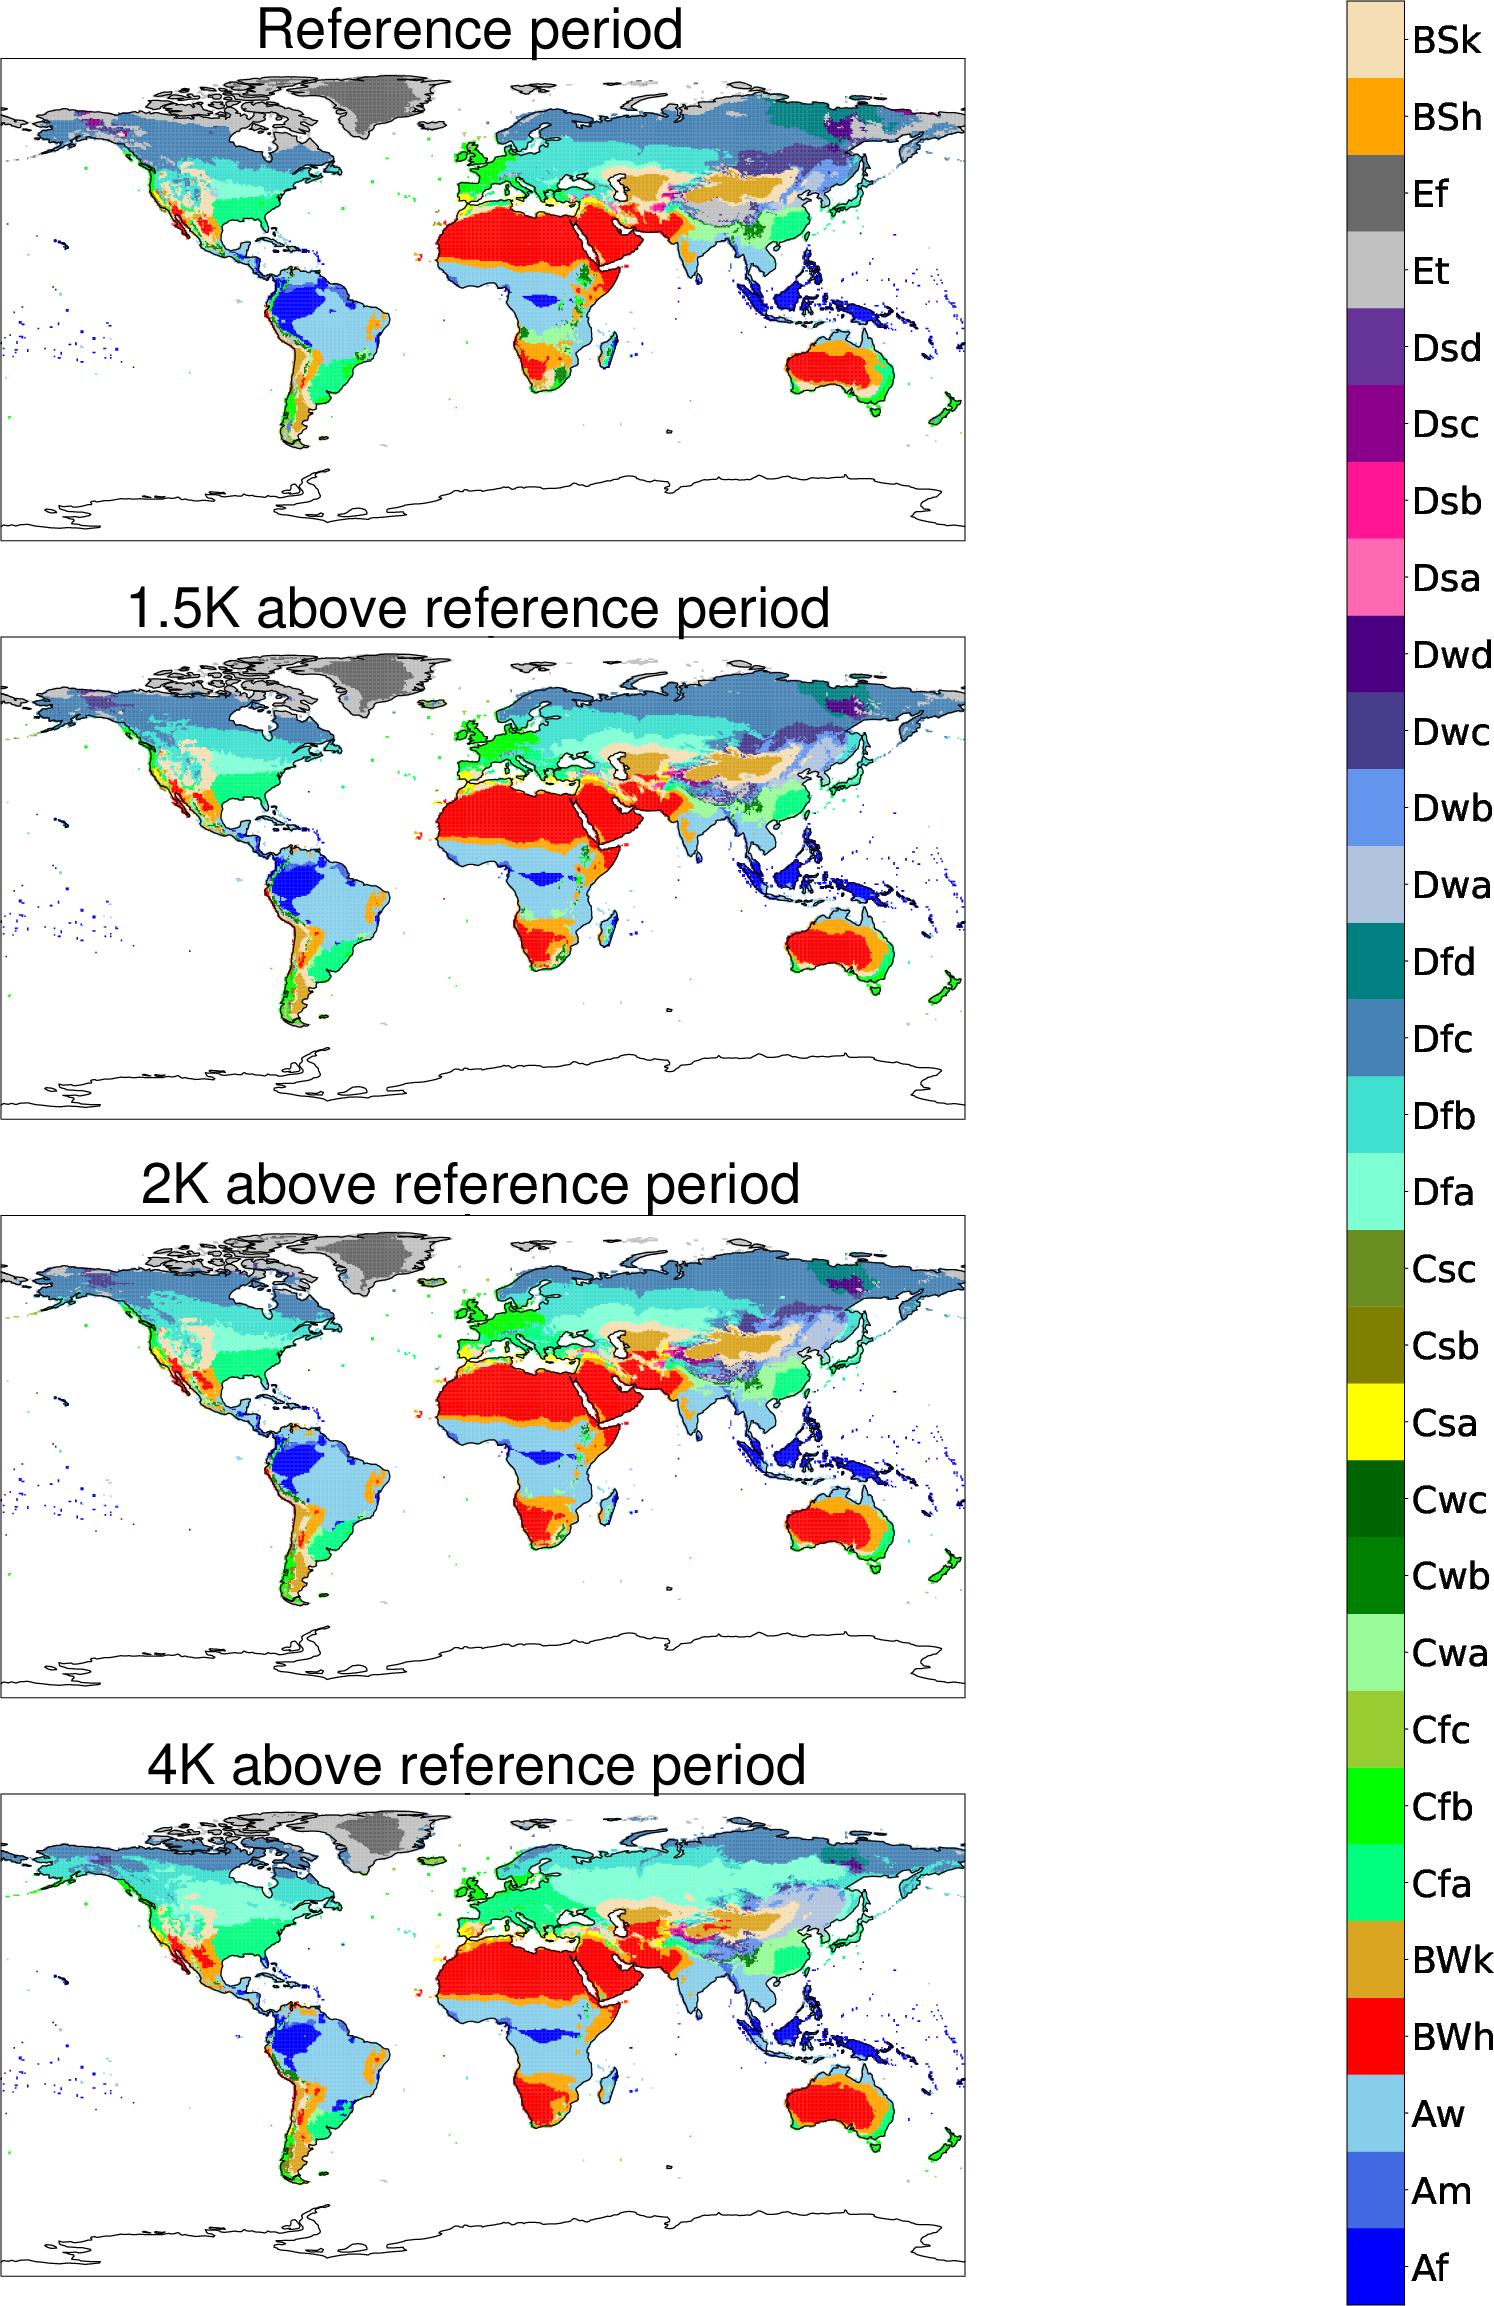
Figure 3: Ensemble mean KG classification anomalies for reference, 1.5K, 2K, and 4K of global warming. Large-scale changes are concentrated in northern America and Eurasia.
A streamlined classification system further accentuates the major transitions, particularly at 4K warming, where the ten largest global bioclimatic shifts are clearly evident.
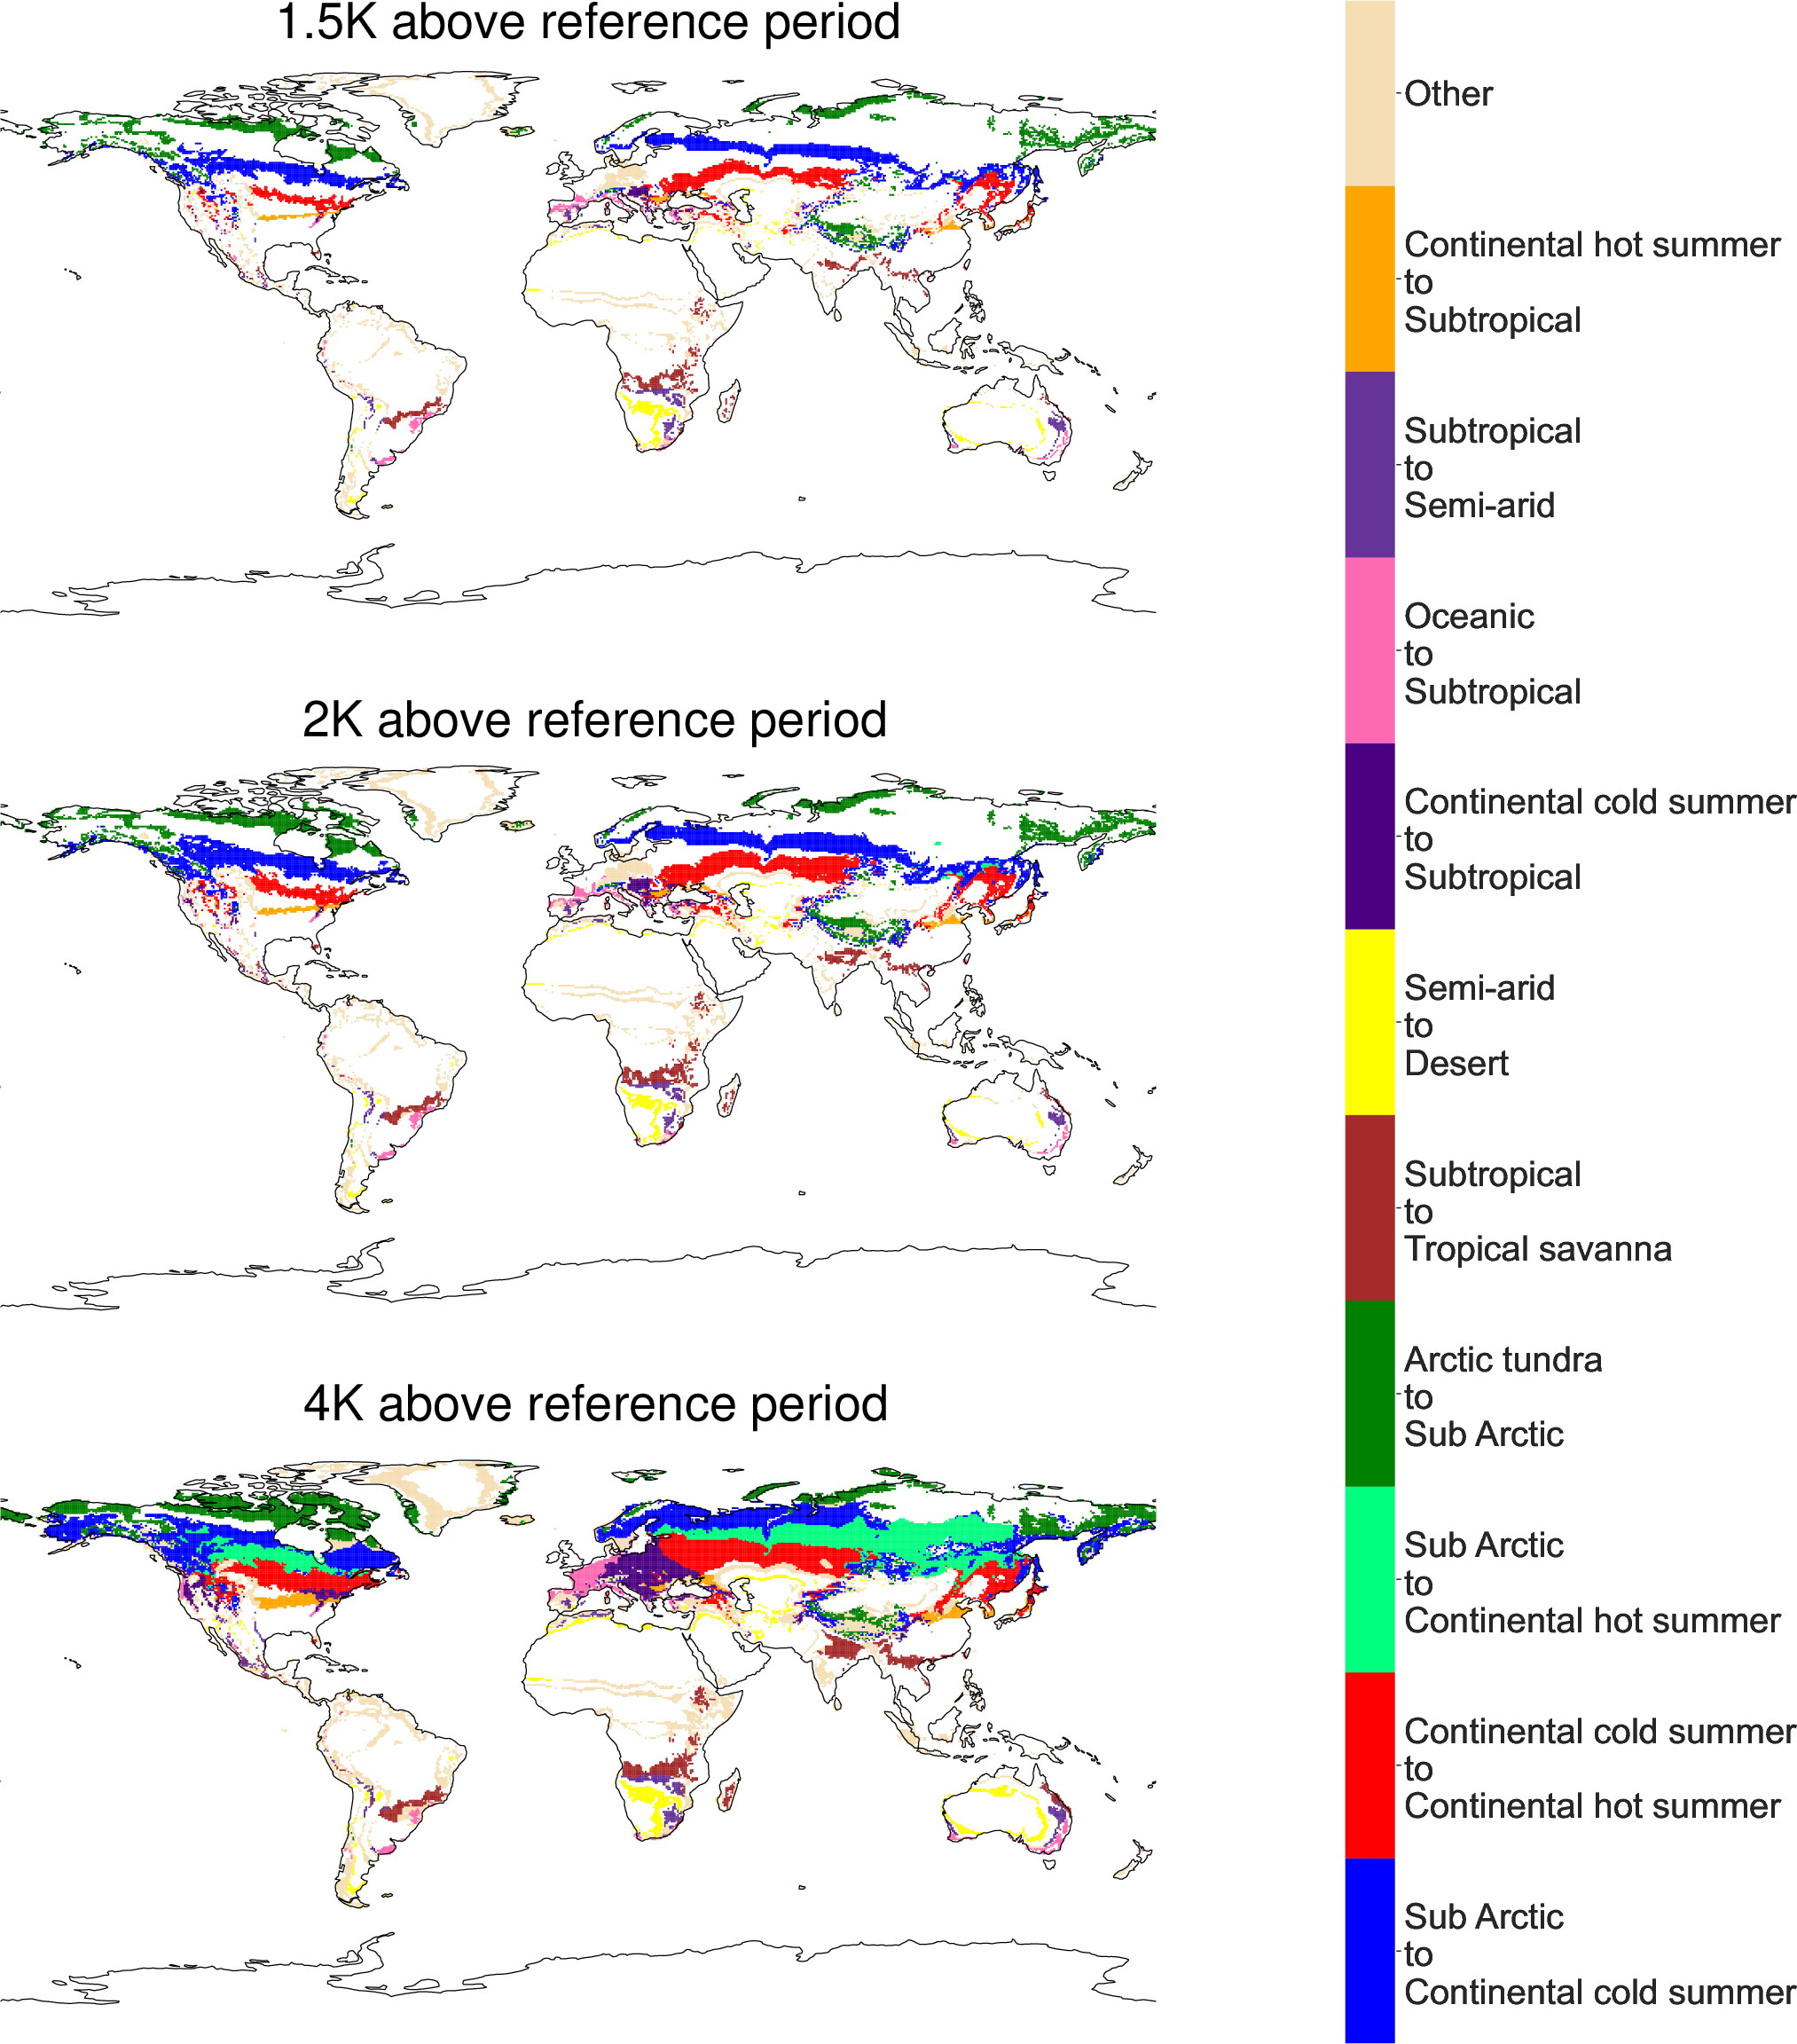
Figure 4: Major classification changes by area at 4K warming in the streamlined KG system.
Classification difference matrices provide quantitative detail on the redistribution at discrete warming increments (1.5K, 2K, 4K), showing sharp declines in cold/wet classes and expansion of arid and hot regime coverage.
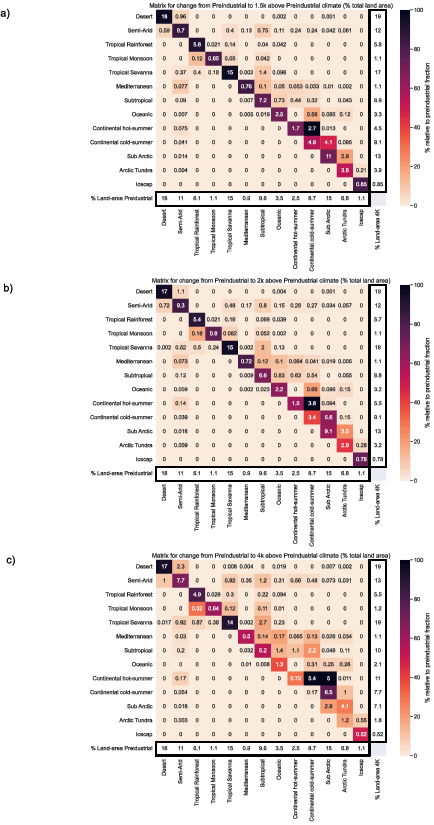
Figure 5: Global matrices quantifying classification changes for 1.5K, 2K, and 4K warming in the streamlined system.
At 4K, more than 15% of global land area undergoes a major bioclimatic class change, with Arctic Tundra declining by more than 40%. At 2K, substantial redistribution already occurs, underscoring the non-trivial scale of ecosystem disruption even at moderate warming.
Sensitivity of Bioclimate to ΔT
A principal finding is the weakly-saturating exponential relation between global mean temperature rise (ΔT) and the fraction of land area experiencing a bioclimatic shift:
f=1−e−0.17ΔT
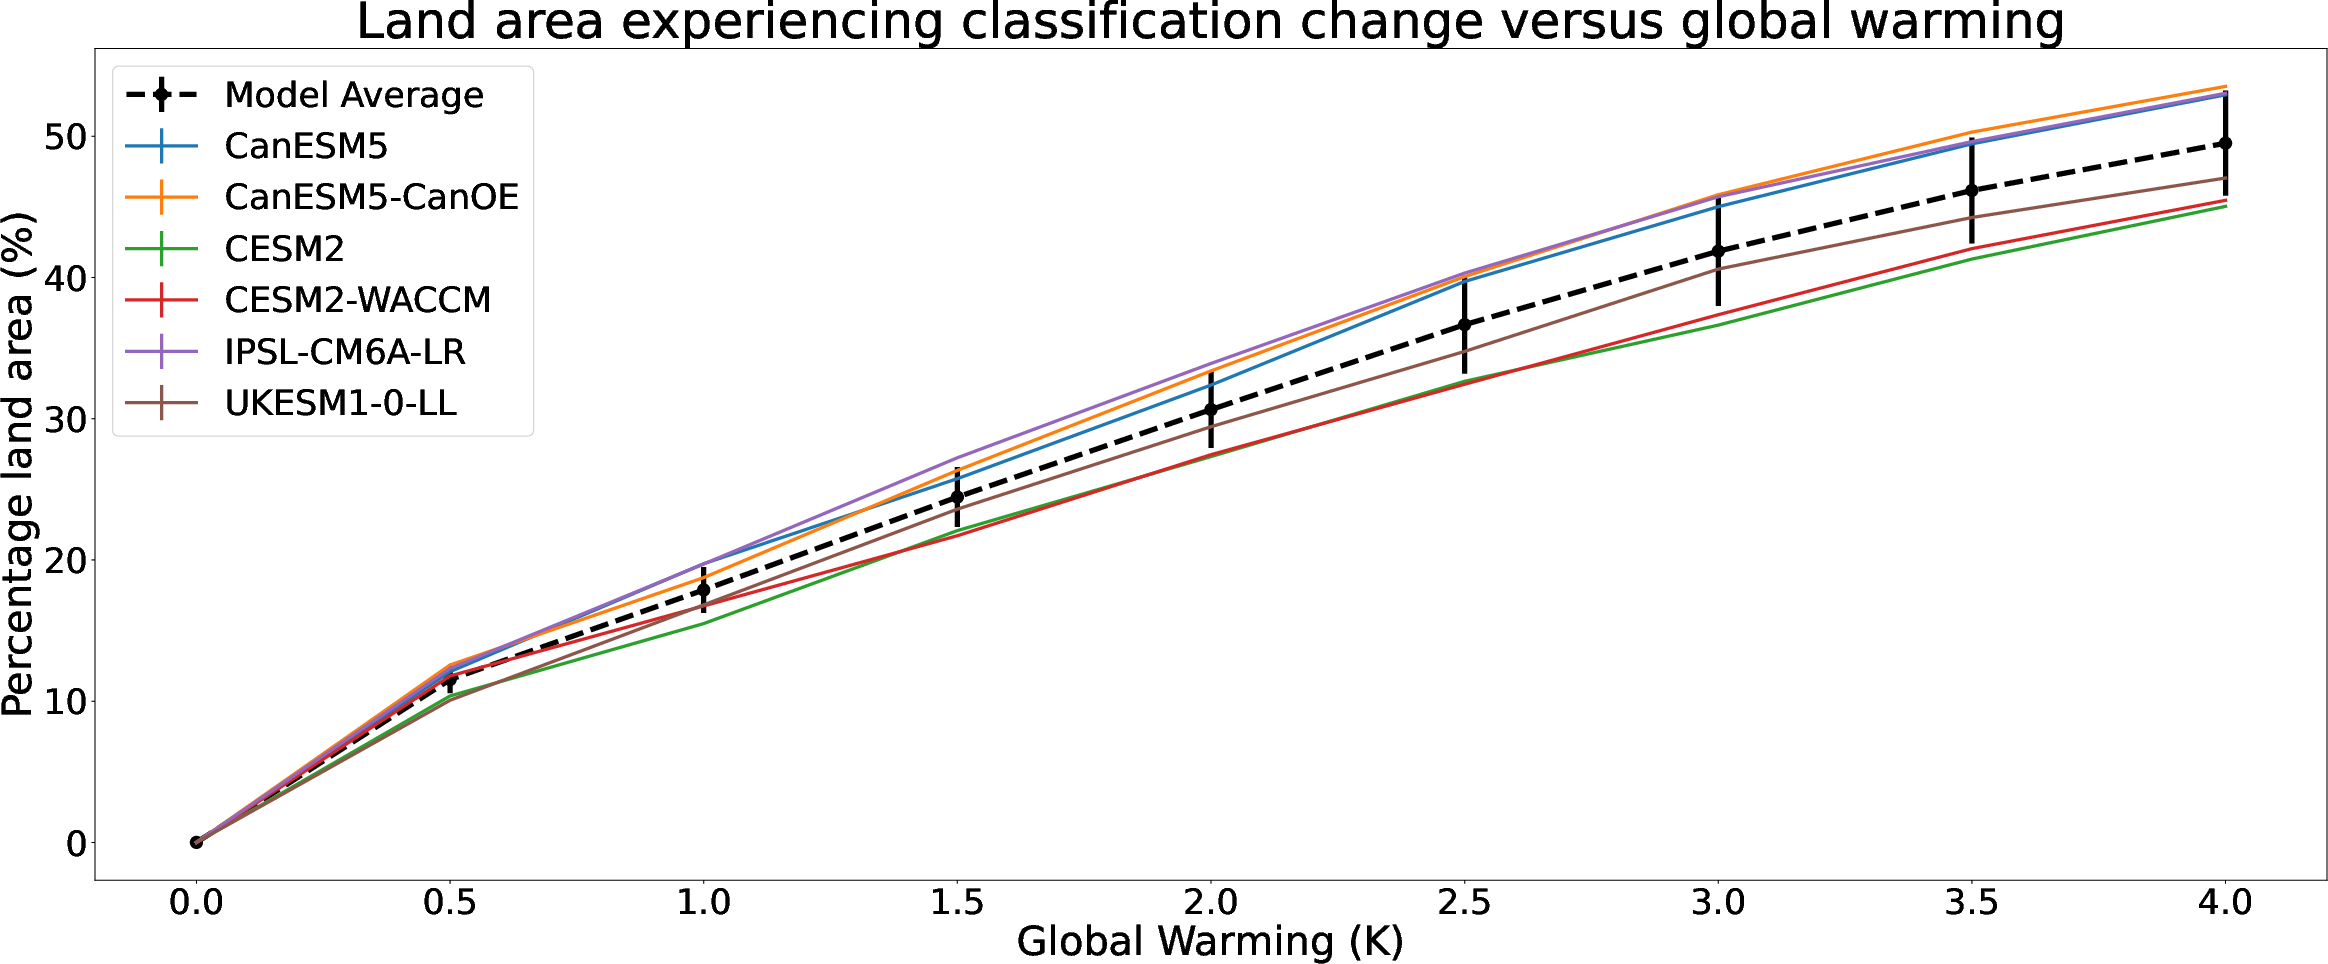
Figure 6: Fraction of land with classification change vs. global warming; ensemble mean evolution fits f=1−e−0.17ΔT.
This formula implies an approximately linear response in the targeted 1–3K Paris Agreement range, with ∼12% of non-Antarctic land shifting class per +1K warming. Consequently, constraining global warming to 1.5K instead of 2K would spare >7 million km² of terrestrial area from crossing a significant bioclimatic threshold.
Implications
The convergence of diverse state-of-the-art ESMs on robust area-fraction change per kelvin warming—despite significant discrepancies in absolute spatial projections and emissions scenario sensitivity—indicates model consensus on the functional bioclimatic response to warming. The introduced streamlined KG system and transition matrices facilitate more rigorous assessment and visualization of ecosystem risk under climate change.
Practical implications for ecosystem management, biodiversity preservation, and climate mitigation policy are significant. The linearity of bioclimate redistribution in response to warming underscores the urgency of meeting or exceeding Paris commitments. From a theoretical standpoint, these results confirm that discrete climate-sensitive ecological boundaries retain predictive power over larger scales, even as local variability and model biases persist.
Future work may involve extending this analysis to higher temporal resolution, incorporating more frequent scenario branching, further refining the classification schema, and exploring feedbacks between bioclimatic transitions and associated ecosystem processes or socioeconomic impacts.
Conclusion
This study provides quantitative, model-ensemble-backed evidence for the magnitude and structure of global bioclimatic redistribution under defined increments of global warming. There is strong inter-model agreement on the overall scale of terrestrial area affected per degree warming, with the majority of changes consistently trending towards hotter and/or more arid classifications. These insights deliver actionable context for climate impact assessment and emphasize the climatic value of limiting global temperature rise.

