- The paper demonstrates a mixed-initiative system integrating deep learning for data visualization recommendations based on user interaction and provenance data.
- The methodology employs bidirectional LSTM and a Siamese neural network in a learning-to-rank approach to optimize multi-view dashboard creation.
- Quantitative evaluation shows improved prediction accuracy over baselines, highlighting the system's potential to personalize and democratize dashboard design.
MultiVision: Designing Analytical Dashboards with Deep Learning Based Recommendation
This essay examines "MultiVision: Designing Analytical Dashboards with Deep Learning Based Recommendation", which presents an advanced system aimed at assisting users in designing analytical dashboards using deep learning-based recommendations. The work focuses on optimizing the selection of data columns and recommending multiple charts to enhance the multi-view visualization (MV) process, leveraging deep learning models integrated into a mixed-initiative system.
Deep Learning Integration into Visualization Systems
MultiVision integrates deep learning models with mixed-initiative systems to facilitate the visualization of data sets. The process begins with the automation module assessing charts and MVs through prediction models (Figure 1). These models optimize score predictions to recommend MVs that maximize user input constraints. Learning occurs offline from the provenance data extracted from authoring logs, enhancing model accuracy over time by incorporating user interactions into the learning loop.
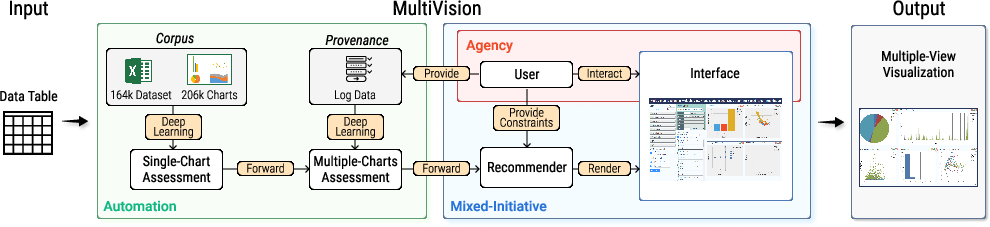
Figure 1: MultiVision is a mixed-initiative system that generates a multiple-view visualization given a data table.
The core of MultiVision's learning mechanism is modeled as a multi-layered heterogeneous graph (Figure 2), which forms a sequence-to-one regression task using a Siamese neural network structure. This structure enables the system to learn partial orders in visualization quality, driving recommendations based on both visualization corpus and user-generated provenance data.
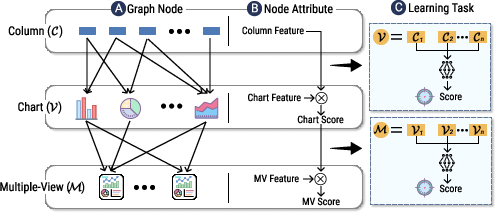
Figure 2: We abstract the recommendation problem into machine learning tasks: relationship modeling among data components.
Model Architecture and Training Approach
MultiVision's architecture (Figure 3) shares design features at both the chart assessment and MV assessment levels. The model's architecture employs bidirectional LSTM layers to capture sequence features of selected data columns, and linear layers make final score predictions. Single-chart and multi-chart assessments use this architecture with tailored modifications for each visualization type.
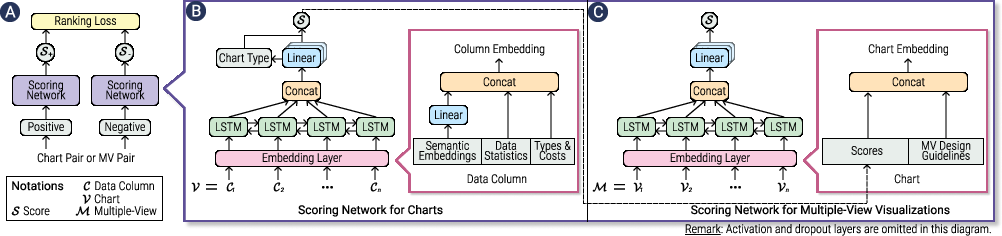
Figure 3: Shared model architecture for single-chart assessment and multiple-charts assessment.
Training data is obtained through a learning-to-rank approach, with detailed feature engineering applied to generate data column embeddings. A notable challenge addressed by the study was the lack of large-scale MV data, mitigated by utilizing authoring logs and visualization corpus, significantly increasing prediction accuracy and ML model effectiveness.
Interface and User Interaction
The interface of MultiVision provides a robust platform for user interaction, integrating user-driven data exploration with automation features. It offers functionalities like the Multiple-View Recommender and Chart Ideas (Figure 4), which dynamically update chart suggestions based on current user selections. This mixed-initiative design enables users to engage with a semi-automated process, balancing agency and automation seamlessly.
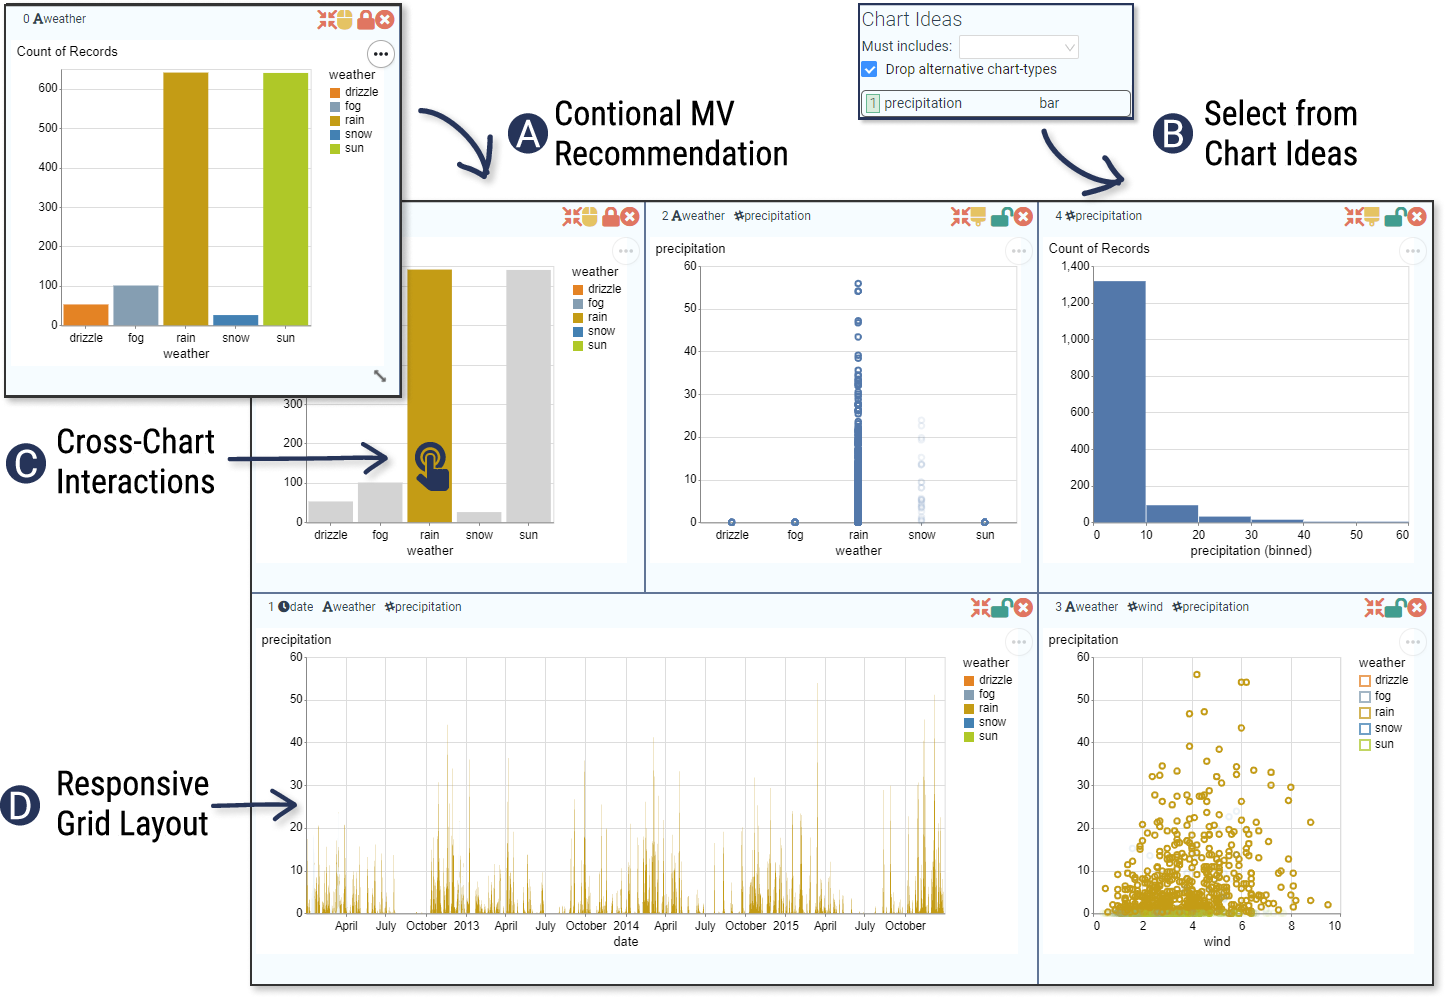
Figure 4: Major user interactions in MultiVision, showcasing both user engagement and system recommendations.
Features such as Chart Editing and Cross-Chart Interactions assist users in customizing and refining the visualizations to better communicate insights. These features provide users the freedom to adjust the aesthetics and scales of the dashboards, ensuring that charts remain tailored to specific analytical needs.
Evaluation and Implications
The system's evaluation involved both algorithmic testing and user studies. Quantitatively, MultiVision demonstrated high accuracy in ranking visualization pairs, outpacing existing baseline models and showcasing potential for widespread deployment (Figure 5). The user study highlighted the system's effectiveness in facilitating the visualization design process, with participants noting improved exploratory data analysis capabilities.
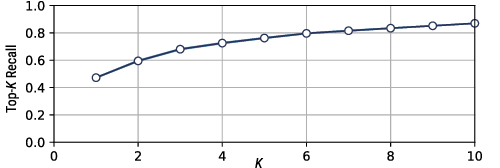
Figure 5: The top-k recall curve of our model averaged after Monte-Carlo Cross-Validation.
The study results suggest that while MultiVision aids in the democratization of data visualization processes, it also underscores the importance of integrating automated systems with human-centric design. Personalized recommendations are emphasized as a future goal, catering more closely to specific user needs and preferences.
Conclusion
MultiVision exemplifies a significant advancement in the domain of designing analytical dashboards using machine learning, highlighting the importance of integrating deep learning models into visualization systems effectively. The system not only supports dynamic and personalized user interactions but also offers insights into the future trajectory of AI-assisted data visualization tools. The findings support the need for ongoing research into improving visualization recommenders' efficiencies, interactions, and personalization capabilities, promising to redefine the landscape of data analytics and visualization in the coming decades.

