When Visualizing is the First Step to Reasoning: MIRA, a Benchmark for Visual Chain-of-Thought
Abstract: We propose MIRA, a new benchmark designed to evaluate models in scenarios where generating intermediate visual images is essential for successful reasoning. Unlike traditional CoT methods that rely solely on text, tasks in MIRA require models to generate and utilize intermediate images - such as sketches, structural diagrams, or path drawings - to guide their reasoning process. This setup closely mirrors how humans solve complex problems through "drawing to think". To solve this, MIRA focuses on tasks that are intrinsically challenging and involve complex structures, spatial relationships, or reasoning steps that are difficult to express through language alone. To ensure that our evaluation data is of high-quality, we include 546 multimodal problems, annotated with intermediate visual images and final answers. We also propose a unified evaluation protocol for MIRA that spans three levels of evaluation input: direct input with image and question only, text-only CoT input with image and thinking prompts, and Visual-CoT input with both annotated image clues and textual thinking prompts. To probe the upper bound of model capacity on our benchmark, we also report pass@k and majority voting accuracies under different k settings. Experimental results show that existing multimodal LLMs, including strongest private models as well as strong open-weight models, perform poorly when relying solely on textual prompts. However, when intermediate visual cues are provided, model performance improves consistently, yielding an average relative gain of 33.7% across all models and tasks. We also probe the upper bound by expanding the search space and designing textual prompts aligned with Visual-CoT, but both yield only limited improvements compared to our Visual-CoT setting. These results underscore the critical role of imagined visual information in enabling successful reasoning on MIRA.
Paper Prompts
Sign up for free to create and run prompts on this paper using GPT-5.
Top Community Prompts
Explain it Like I'm 14
Plain-language summary of “When Visualizing is the First Step to Reasoning: MIRA, a Benchmark for Visual Chain-of-Thought”
What is this paper about?
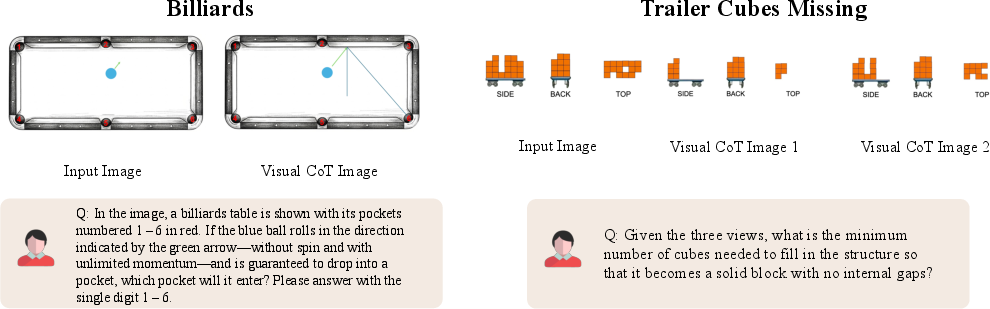
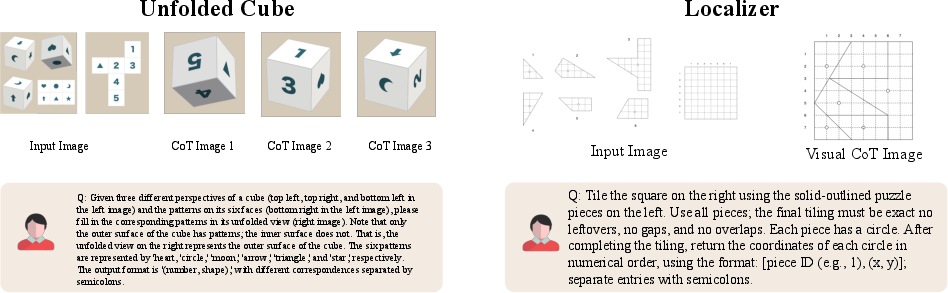
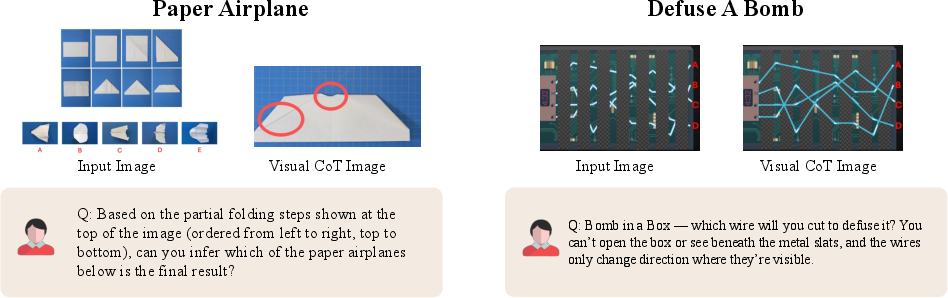
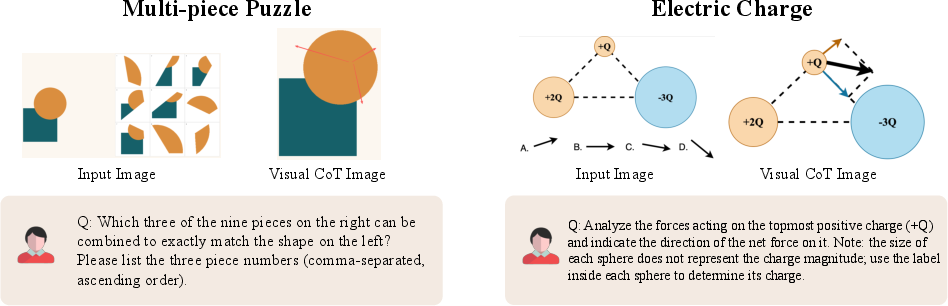
This paper introduces MIRA, a new test (called a benchmark) to check how well AI systems can solve problems by “drawing to think.” Instead of only writing out steps in words, some problems are much easier if you sketch what’s happening—like tracing a path in a maze, drawing force arrows in physics, or diagramming shapes in geometry. MIRA is built to measure whether AI can use these kinds of in-between visual steps to reason better.
What did the researchers want to find out?
The team explored a few simple questions:
- Do today’s AI models struggle on problems that really need drawings or diagrams to solve?
- Does giving AI helpful in-between pictures (like sketches, paths, or diagrams) make it reason better than just giving it text?
- If we let AI “try multiple times,” or give it better prompts, can it catch up without visual help?
How did they do it?
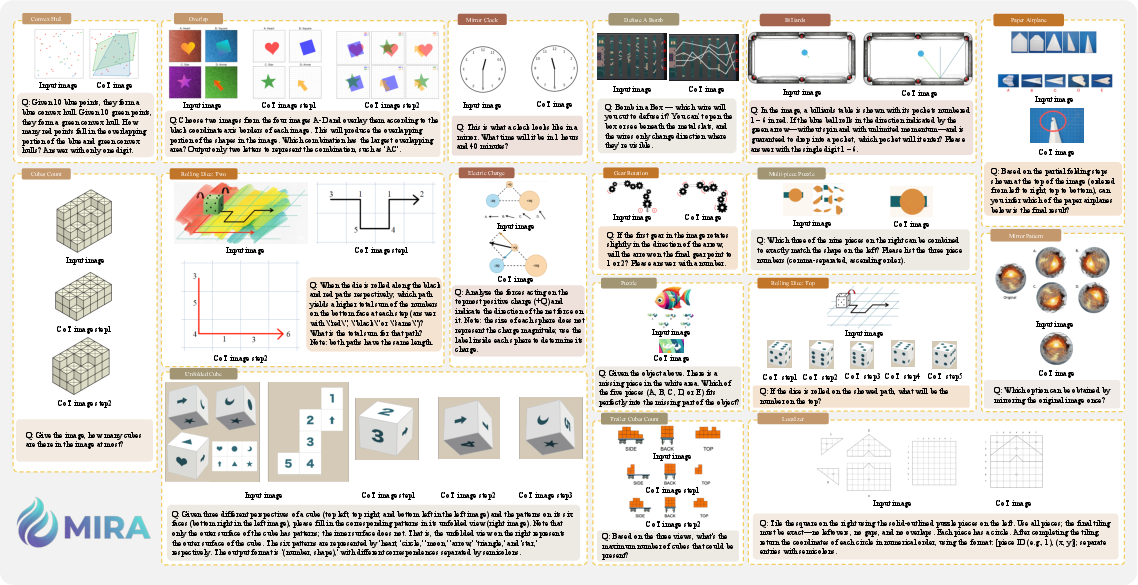
The researchers built a carefully checked set of 546 problems that are naturally “draw-to-think.” Each problem comes with:
- The question and the main image(s)
- Human-made intermediate visual steps (like sketches or step-by-step diagrams)
- The correct final answer
These problems cover four areas:
- Euclidean Geometry (e.g., shapes, angles, constructions)
- Physics-Based Reasoning (e.g., forces, motion, cause-and-effect)
- Abstract Spatial and Logical Puzzles (e.g., grids, paths, puzzle moves)
- Causal Transformations (e.g., how an object changes over a sequence of steps)
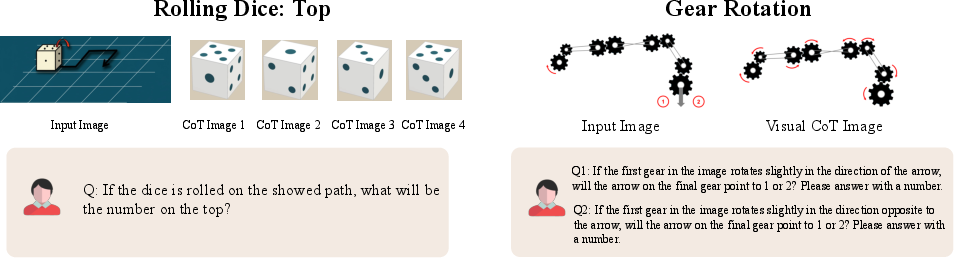
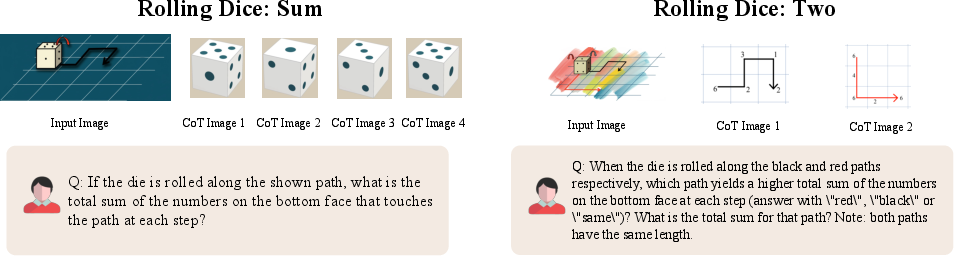
Some problems need just one key sketch (single-step), while others need a sequence of visuals (multi-step), like tracking a die rolling across a board and keeping score.
They tested many top AI models under three input settings:
- Direct: only the image(s) and the question.
- Text-CoT (text chain-of-thought): the image(s) and question, plus a prompt telling the AI to think step-by-step in words.
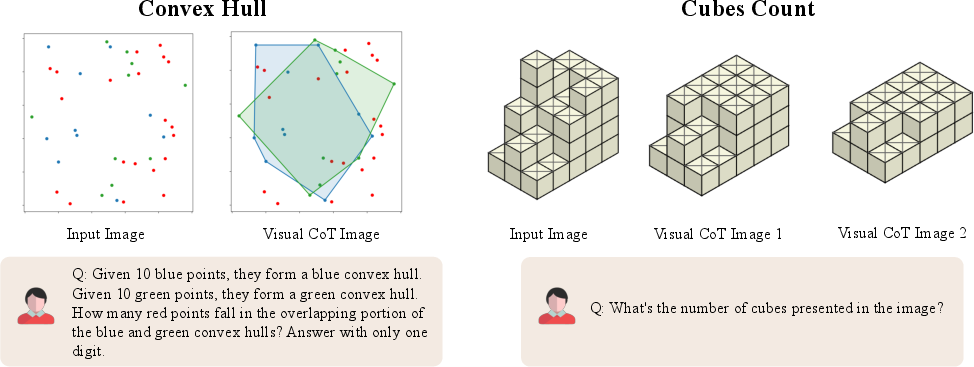
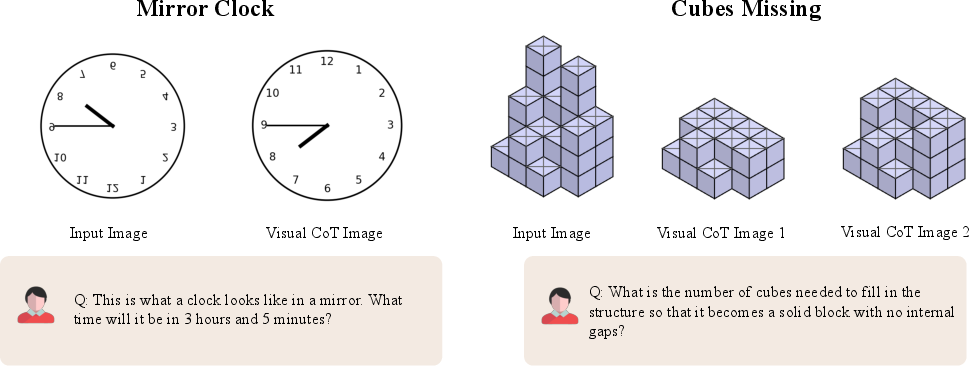
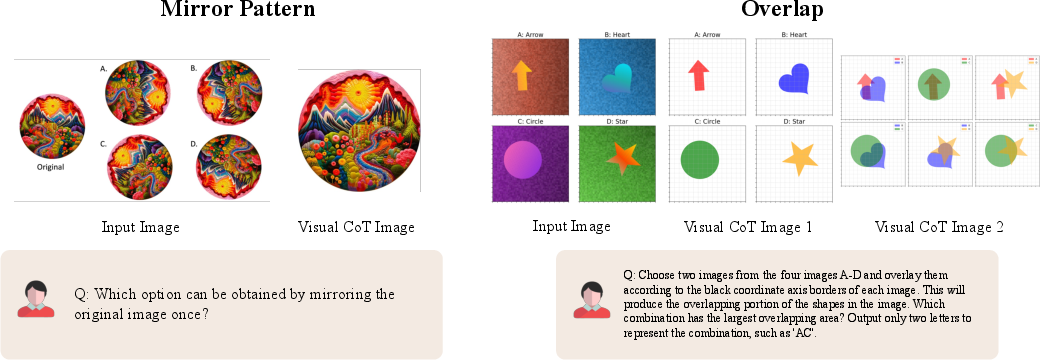
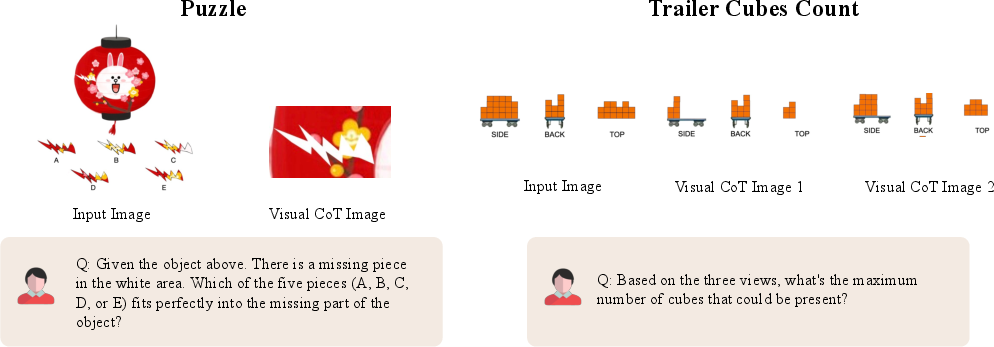
- Visual-CoT: the image(s), question, and the human-made in-between pictures, plus a prompt to reason using both text and visuals.
They also tried two extras to see the “best-case” potential of models:
- Pass@k: let the AI take several shots (like up to 8 tries) and count it right if any try is correct.
- Majority voting: ask the AI multiple times and pick the most common answer.
In simple terms, they checked whether “more tries” or “fancier text prompts” could make up for the lack of drawings.
What did they find, and why is it important?
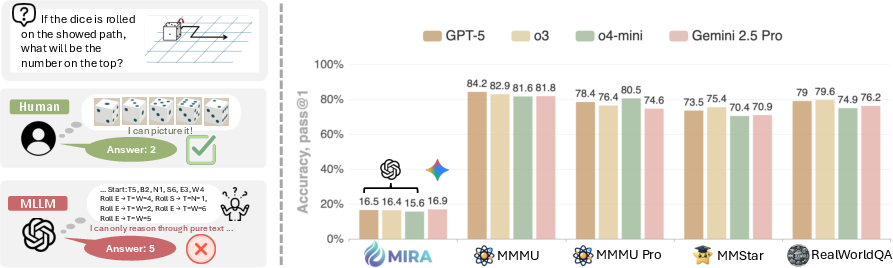
- Without visual help, even the best models did poorly. With just the question and image, top systems often scored under 20% correct on MIRA. That means these tasks truly need visual thinking, not just good reading and writing.
- Just telling the AI to “think in steps” using text (Text-CoT) often didn’t help—and sometimes made things worse. For certain models, performance dropped when they tried to talk through all the steps in words.
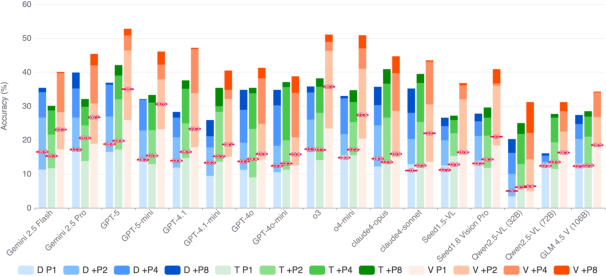
- Giving visual hints (Visual-CoT) made a big difference. When models were given the human-made intermediate pictures, their scores jumped by about 34% on average. In physics-style problems, performance sometimes nearly doubled. This shows that visual thinking isn’t a nice-to-have—it’s crucial for these tasks.
- More chances don’t fix the core problem. Letting models try multiple times (Pass@k) or use majority voting helped a bit, but improvements were limited compared to the gains from visual steps. This suggests the models are missing a core skill—not just making small mistakes.
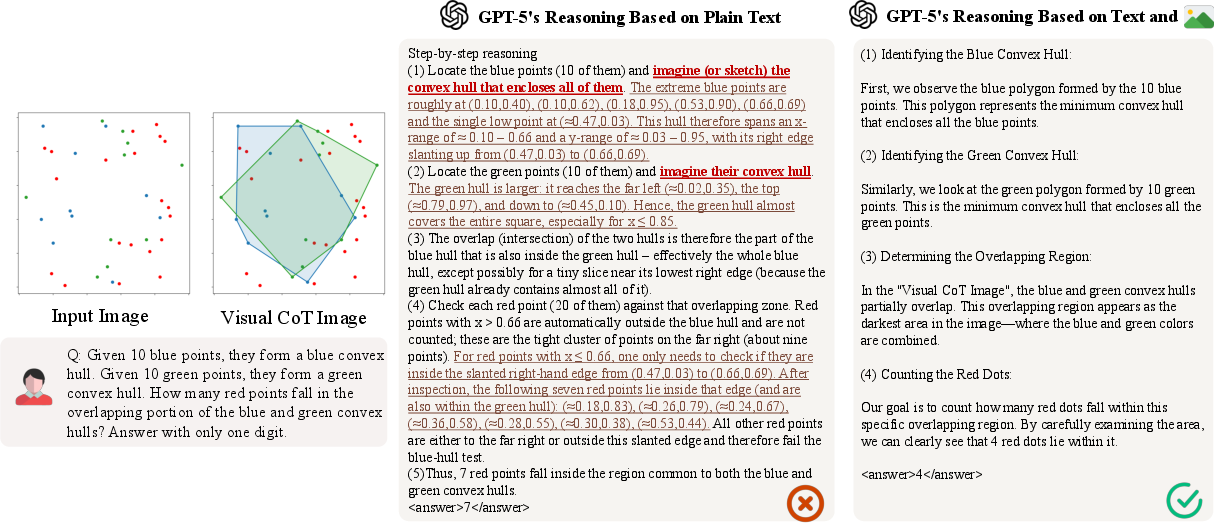
- Better text prompts help a little, but not enough. Specially designed, task-specific text prompts gave small improvements, but still couldn’t match the boost from visual reasoning. Some steps simply can’t be explained well in words.
Why it matters: Humans often solve tricky problems by sketching—drawing a force diagram, tracing a path, or marking off areas. These results show that today’s AI, even very advanced versions, struggles when it has to “imagine” and use intermediate visuals on its own. When we provide the visuals, AI gets much better—so the next step is teaching AI to create and use those visuals by itself.
What does this mean for the future?
- AI needs to “think while drawing.” Future models should be able to create, update, and use their own simple sketches, diagrams, and paths during reasoning—just like humans use scratch paper.
- MIRA can guide progress. Because MIRA comes with problems and gold-standard intermediate visuals, it gives a fair way to measure whether new AI systems are actually getting better at visual reasoning.
- Real-world impact: Better visual reasoning could help in classrooms (explaining geometry or physics), robotics (planning paths and actions), science and engineering (diagramming systems), and everyday tools (maps, puzzles, instructions).
- A gap remains: Some open models improved less than leading closed ones when given visuals. Closing this gap will likely need new training strategies and data that blend drawing and thinking tightly together.
In short: The paper shows that many complex problems aren’t just about words—they’re about pictures too. AI gets much smarter on these tasks when it can “see” and use the right in-between visuals. The big challenge now is building AI that can make and use those visuals on its own.
Knowledge Gaps
Knowledge gaps, limitations, and open questions
Below is a concise, actionable list of what remains missing, uncertain, or unexplored in the paper—intended to guide follow-up research.
- Simulated (not autonomous) visual chain-of-thought: the benchmark evaluates models’ ability to consume human-annotated intermediate images, but not to decide when/what to draw or to autonomously generate and iteratively use their own intermediate visuals during reasoning.
- Lack of metrics for intermediate visual reasoning quality: there is no scoring of the faithfulness, utility, or alignment of intermediate images to reasoning steps; a standard for evaluating generated diagrams (and their consistency with textual steps) is absent.
- Limited dataset scale and scope: only 546 problems across four categories may be insufficient to characterize generalization; expansion to more domains (e.g., real-world scenes, scientific diagrams, robotics, medical, maps) is needed.
- Synthetic/diagram-heavy bias: many tasks are stylized puzzles or constructed diagrams; it is unclear how results transfer to natural images, in-the-wild scenes, or complex real workflows.
- No human baselines: the benchmark lacks human accuracy, time, and variability measures to contextualize difficulty and to test the necessity and contribution of “drawing to think.”
- “Necessity” of visual CoT not causally established: while Visual-CoT helps, the paper does not show that equivalent-information textual descriptions fail while matched-information visuals succeed; controlled necessity/sufficiency studies are needed.
- Potential answer leakage via annotations: intermediate images might implicitly reveal answers (e.g., highlights or final structures). Controlled ablations varying visual clue informativeness are needed to isolate genuine reasoning gains.
- Underexplored representation design: which intermediate visual representations (sketches, graphs, vector fields, bounding boxes, heatmaps, canonical diagrams) most effectively support reasoning remains unstudied.
- Missing ablations on step granularity: the effect of the number, ordering, and granularity of intermediate visual steps (and their resolution/layout) on performance is not analyzed.
- No robustness tests: sensitivity to noise, occlusion, compression, stylistic variation, or adversarial perturbations in the intermediate visuals is unreported.
- Evaluation metric is coarse: reliance on micro-averaged final-answer accuracy omits stepwise correctness, partial credit, visual-step faithfulness, and macro-level fairness across task types/classes.
- LLM-as-judge ambiguity: ambiguous outputs are adjudicated by a closed-source LLM (GPT-4o) without inter-judge agreement, calibration, or bias analysis; human adjudication samples and agreement statistics are missing.
- Prompting and decoding confounds: pass@k and majority voting gains are reported without compute-normalized controls, systematic temperature/seed sweeps, or cost fairness across models.
- Tool-augmented baselines absent: unified evaluation of methods that can call drawing/geometry tools or code (e.g., Python plotting, CAD) during reasoning is not included; a tool-using track would clarify orchestration vs. end-to-end capabilities.
- No end-to-end “draw-while-reasoning” baseline: models are not allowed (or enabled) to generate their own intermediate images in-loop and then reason over them; the performance gap to human-provided Visual-CoT remains unquantified.
- Training-time questions unanswered: the paper evaluates inference-time consumption of visual CoT but does not study finetuning or pretraining with interleaved visual-text rationales, curriculum design, or data scaling laws for visual reasoning.
- Data quality transparency limits: inter-annotator agreement, error rates, and conflict-resolution statistics for intermediate images and answers are not reported; reproducible annotation protocols and QA metrics are needed.
- Dataset contamination risk: inspiration from public puzzle sources is acknowledged, but no systematic decontamination checks against pretraining corpora (or near-duplicate detection) are provided.
- Reproducibility under model drift: heavy reliance on closed-source APIs with evolving versions threatens reproducibility; standardized evaluation kits, seeds, and “frozen” model snapshots or hosted evaluation servers are needed.
- Limited error taxonomy: failure modes are not systematically categorized (e.g., mis-parsing visuals, spatial transformation errors, counting, temporal tracking), hampering targeted method development.
- OCR/text-in-image confounds: the extent to which tasks rely on reading text in images (favoring OCR-strong models) is unclear; controls to balance or isolate OCR from spatial reasoning are missing.
- Multilingual and accessibility coverage: all tasks appear English-only; cross-lingual robustness and accessibility aspects (e.g., colorblind-safe cues) are not explored.
- Licensing and asset provenance: images edited/generated via external tools (e.g., GPT-4o, Gemini) have unclear licensing/reproducibility guarantees; release of raw assets and licenses is unspecified.
- Security and safety aspects: no analysis of potential misuse, content risks, or safety considerations when enabling models to generate and reason with images (e.g., deceptive visuals).
- Benchmark longevity: without a hidden test server and contamination monitoring, future model training on the released set may erode its usefulness; a private leaderboard/holdout split is needed.
Practical Applications
Immediate Applications
Below is a focused set of deployable use cases that directly leverage MIRA’s findings and evaluation protocol, along with sector links, likely tools/workflows, and feasibility notes.
- Benchmarking and vendor selection for multimodal AI
- Sectors: software, education, healthcare, robotics, finance
- What: Use MIRA to stress-test candidate MLLMs beyond perception tasks, specifically for visual chain-of-thought (Visual-CoT) needs. Include MIRA’s three-level diagnostics (Direct, Text-CoT, Visual-CoT) in pre‑procurement and model QA to reveal failure modes hidden in standard VQA benchmarks.
- Tools/workflows: Automated evaluation harness, pass@k sampling and majority voting, semantic judges for output parsing
- Assumptions/dependencies: Access to model APIs, the ability to feed intermediate images, internal evaluation infrastructure
- Risk triage and task routing in production AI systems
- Sectors: software, customer support, education, robotics
- What: Classify incoming tasks by whether they likely require intermediate visual reasoning (e.g., spatial layout, geometric construction). Route such tasks to workflows that include visual aids (Visual-CoT) or human‑in‑the‑loop review to mitigate errors observed with Text-CoT alone.
- Tools/workflows: Task classifiers, Visual‑CoT prompt templates, human review queues
- Assumptions/dependencies: A dispatcher that can detect visual‑reasoning tasks; cost tolerances for human escalation
- Visual‑CoT assisted interfaces (“scratchpad in the loop”)
- Sectors: software (design tools, IDEs), education (tutoring), robotics (path planning), logistics (route planning), manufacturing (assembly)
- What: Improve accuracy by allowing users or tools to add intermediate sketches/diagrams (e.g., bounding boxes, paths, hulls) before the model reasons. MIRA’s results show consistent gains when models are given visual cues.
- Tools/workflows: Canvas overlays, diagram editors, Python plotting (matplotlib), whiteboard widgets in chat assistants
- Assumptions/dependencies: Models must accept multiple images and condition on them; UX support for drawings
- Prompt and workflow tuning aligned to Visual‑CoT
- Sectors: software, data science, education
- What: Adopt task‑specific textual prompts that mirror Visual‑CoT steps (specialized prompts). While gains are modest vs. full Visual‑CoT, they are immediate and low‑cost.
- Tools/workflows: Prompt libraries per task family (Geometry, Physics, Puzzles, Causal)
- Assumptions/dependencies: Domain‑aware prompt engineering; limited uplift relative to visual cues
- Diagnostic evaluation and reliability reporting
- Sectors: industry, academia, policy
- What: Use MIRA’s three‑level protocol to disentangle failures due to missing visual information from reasoning lapses. Report pass@k and majority-vote metrics alongside single‑shot accuracy to calibrate reliability.
- Tools/workflows: Evaluation dashboards, audit reports, reproducible pipelines
- Assumptions/dependencies: Agreement on metrics and acceptance criteria; access to benchmark artifacts
- Human‑in‑the‑loop visual aid generation for critical tasks
- Sectors: engineering (CAD review), energy (network diagrams), operations (facility layouts)
- What: Insert a step where domain experts or simple scripts provide intermediate diagrams (force-body diagrams, convex hulls, process flows) before model inference, improving accuracy for high‑stakes tasks.
- Tools/workflows: Diagram libraries, collaborative whiteboards, versioned visual inputs
- Assumptions/dependencies: Availability of domain experts or scripting capacity; governance of edits
- EdTech tutoring and assessment that “draws to think”
- Sectors: education
- What: Build tutoring sessions and assessments that require students (and the AI) to produce intermediate visuals for geometry/physics problems, mirroring MIRA’s effective Visual‑CoT paradigm.
- Tools/workflows: Interactive geometry tools, stepwise solution UIs, auto‑grading with visual checkpoints
- Assumptions/dependencies: Curriculum integration; student device support for drawing
- Dataset construction pipeline reuse for courseware and training data
- Sectors: academia, EdTech, software
- What: Repurpose MIRA’s hybrid pipeline (manual + programmatic item generation; cross‑review; unique answer enforcement) to create domain‑specific visual reasoning datasets and practice materials.
- Tools/workflows: Python generators, image editing tools, annotation guidelines, QA playbooks
- Assumptions/dependencies: Staff/time for curation; licensing for derivative datasets
- Deployment guardrails for visual reasoning claims
- Sectors: policy, compliance, software
- What: Use MIRA outcomes to define guardrails (e.g., “No text‑only reasoning for spatial tasks,” “Require visual aids for physical simulation”) in product policies and user guidance to reduce failure rates.
- Tools/workflows: Policy checklists, runtime detectors for task type, UI warnings
- Assumptions/dependencies: Organizational acceptance; monitoring to enforce guardrails
Long-Term Applications
Below are forward-looking applications that require further research, training data, tooling, or scaling to realize “think‑while‑drawing” capabilities revealed by MIRA.
- Unified “think‑while‑drawing” MLLMs
- Sectors: robotics (path planning), autonomous systems, engineering (mechanical design), software (UI layout reasoning), finance (chart analysis)
- What: Architect models that natively generate and consume intermediate diagrams during reasoning (visual scratchpads tightly coupled with language).
- Tools/products: Visual Reasoning LLMs, internal canvas memory modules, multimodal tokenization for diagrams
- Assumptions/dependencies: New training regimes with Visual‑CoT data; evaluation standards; compute budgets
- Scaled Visual‑CoT training corpora and curricula
- Sectors: healthcare (medical imaging), AEC/BIM (architecture), electronics (circuit design), geospatial (mapping)
- What: Build large, domain‑specific datasets with high‑quality intermediate visuals (e.g., annotated force diagrams, segmentation overlays, circuit transformations) to train and fine‑tune MLLMs.
- Tools/products: Data generation frameworks, annotation platforms, synthesis via code/tools
- Assumptions/dependencies: Expert labeling; privacy/regulatory compliance; maintenance costs
- Diagram‑centric tool ecosystems and standards
- Sectors: software, design tools, education
- What: Define APIs and standards for exchanging intermediate visual states between agents/tools (e.g., “Visual‑CoT JSON” for shapes, paths, layers) to enable interoperable visual reasoning.
- Tools/products: Whiteboard LLM APIs, shape/graph DSLs, plugin frameworks for diagram agents
- Assumptions/dependencies: Industry consensus on formats; versioning and provenance handling
- CAD/BIM assistants with stepwise visual reasoning
- Sectors: engineering, construction, energy
- What: AI copilot that reasons via constraint diagrams, clash detection visuals, and staged assemblies, improving design validation and change propagation.
- Tools/products: CAD plugins, BIM visual checkers, simulation overlays
- Assumptions/dependencies: Tight integration with proprietary CAD/BIM systems; certification for safety‑critical use
- Healthcare planning and diagnostics with visual scratchpads
- Sectors: healthcare
- What: Radiology and surgical planning assistants that generate intermediate visuals (e.g., boundary annotations, anatomical overlays) during reasoning to improve interpretability and safety.
- Tools/products: PACS-integrated AI with diagram layers, regulated visual audit trails
- Assumptions/dependencies: Clinical validation, regulatory approvals, liability frameworks
- STEM autograding and tutoring with visual proof steps
- Sectors: education
- What: Systems that require and assess intermediate sketches/diagrams for geometry proofs, physics problems, and lab setups; support scaffolded learning aligned to Visual‑CoT.
- Tools/products: Classroom platforms with visual step checkers, teacher dashboards
- Assumptions/dependencies: Robust rubric design; fairness and accessibility considerations
- Policy and certification for multimodal reasoning
- Sectors: policy, public procurement, accreditation
- What: Include Visual‑CoT benchmarks (like MIRA) in certification standards for AI used in education/testing, engineering support, and public services.
- Tools/products: Standardized test suites, reporting templates, audit protocols
- Assumptions/dependencies: Stakeholder agreement; enforcement mechanisms; periodic updates
- AR/VR interfaces that overlay intermediate visuals for field work
- Sectors: robotics, utilities, maintenance, manufacturing
- What: Real‑time visual reasoning overlays (paths, forces, dependencies) to guide technicians or robots; “draw‑to‑reason” in headset.
- Tools/products: AR visualization pipelines, on‑device multimodal models, latency‑optimized rendering
- Assumptions/dependencies: Hardware capabilities; ruggedized deployments; edge compute
- Visual transparency and safety through diagrammatic explanations
- Sectors: compliance, finance, public sector
- What: Require models to produce visual explanations (not just text) for decisions involving spatial or causal reasoning, improving auditability and trust.
- Tools/products: Explanation dashboards with visual traces, provenance logs
- Assumptions/dependencies: Standards for acceptable visual evidence; human reviewer training
- Scientific planning and simulation with visual intermediate states
- Sectors: research (physics, materials, climate), energy
- What: AI assistants that design and reason via experiment schematics, force diagrams, and causal graphs, reducing planning errors and improving reproducibility.
- Tools/products: Lab notebooks with diagrammatic CoT, simulation‑linked sketches
- Assumptions/dependencies: Integration with modeling tools; data/version control for visual artifacts
- Multi‑agent systems for visual reasoning
- Sectors: software, robotics
- What: Architectures where a “drawing agent” iteratively proposes diagrams and a “reasoning agent” validates and updates them, converging on solutions for complex spatial tasks.
- Tools/products: Agent orchestration frameworks, shared visual memory spaces
- Assumptions/dependencies: Robust coordination protocols; conflict resolution; task decomposition strategies
- Hardware accelerators for visual scratchpads
- Sectors: devices, edge AI
- What: Co‑processors or device firmware optimized for generating and consuming intermediate diagrams in real time (e.g., robots, handhelds).
- Tools/products: Specialized rendering and vision modules, memory formats for shape tokens
- Assumptions/dependencies: Market demand; hardware/software co‑design; developer ecosystem
Glossary
- Abstract Spatial Logical Puzzles (ASLP): A task category focused on abstract visual puzzles requiring spatial and logical reasoning. "ASLP (Puzzles)"
- Bounding boxes: Rectangular annotations used to localize regions of interest in images for visual reasoning. "intermediate visual cues (e.g., bounding boxes on relevant regions)"
- Causal Transformations (CT): A category involving reasoning about cause-and-effect changes in visual states. "Causal Transformations (CT)"
- Chain-of-Thought (CoT) prompting: A technique where models generate intermediate reasoning steps in natural language to solve complex problems. "Chain-of-Thought (CoT) prompting has emerged as a powerful paradigm for improving the reasoning capabilities of LLMs"
- Closed-Source SOTA MLLMs: Proprietary state-of-the-art multimodal models used as upper-bound baselines. "Closed-Source SOTA MLLMs"
- Convex hull: The smallest convex polygon containing a set of points, often used for geometric reasoning. "identify convex hulls of two point sets"
- Cross-temporal state tracking: Reasoning about object or state changes over time across multiple visual steps. "cross-temporal state tracking"
- Cross-validation: A process of independent verification to ensure data quality and consistency. "strict human annotation and cross-validation to guarantee data quality"
- Decoding search space: The set of possible outputs considered during sampling or generation to improve solution chances. "We broaden the decoding search space using Pass@ and majority voting"
- Euclidean Geometry (EG): A category focusing on geometric constructions and spatial relationships in the plane. "Euclidean Geometry (EG)"
- Force-body diagram: A diagram depicting forces acting on an object to aid physics reasoning. "draw a force-body diagram to visualize the net force"
- Gold-standard intermediate visual states: Human-verified visual steps aligned with correct reasoning trajectories. "paired with gold-standard intermediate visual states"
- Heuristic regular expressions: Pattern-based rules used to extract answers from text outputs when structure varies. "falling back to a set of heuristic regular expressions for common answer phrasings"
- Majority voting: Aggregating multiple sampled answers and choosing the most frequent as the final prediction. "we also report pass@ and majority voting accuracies under different settings"
- Micro-averaged accuracy: Accuracy computed over all instances, counting each example equally across categories. "We use micro-averaged accuracy as our metric"
- Multi-hop question answering: Tasks requiring reasoning across multiple interconnected facts or steps. "multi-hop question answering"
- Multimodal LLM (MLLM): A model that processes and reasons over both images and text. "existing multimodal LLMs (MLLMs), including strongest private models"
- Open-weight models: Models whose parameters are publicly available for use and modification. "strong open-weight models (e.g., Qwen2.5-VL, GLM 4.5V)"
- Pass@k: An evaluation metric where success is counted if any of k sampled outputs is correct. "we also report pass@ and majority voting accuracies under different settings"
- Perception-oriented evaluation: Benchmarks emphasizing recognition/understanding rather than complex reasoning. "the fundamental gap between perception-oriented evaluation and true visual reasoning"
- Physics-Based Reasoning (PBR): A category involving physical laws and dynamics to infer outcomes. "Physics-Based Reasoning (PBR)"
- Scratchpad diagrams: Auxiliary sketches used to externalize intermediate visual reasoning steps. "scratchpad diagrams humans create"
- Semantic judge: An LLM used to interpret and assess the correctness of generated answers when rule-based parsing fails. "we use a powerful LLM (gpt-4o-2024-11-20) as a semantic judge"
- Simulated Visual-CoT Reasoning: Evaluation setting where annotated intermediate images are provided to guide model reasoning. "Level 3: Simulated Visual-CoT Reasoning"
- Text-CoT: Text-only chain-of-thought prompts instructing models to reason step-by-step without visual generation. "text-only CoT (Text-CoT) input with image and thinking prompts"
- Tool-augmented methods: Approaches that let models call external tools (e.g., drawing or vision utilities) during reasoning. "tool-augmented methods like Visual ChatGPT, VisProg, and ViperGPT"
- Unified-architecture MLLMs: Models that unify vision and language understanding and generation within a single system. "Recent unified-architecture MLLMs (e.g., Blip3-o, Janus-pro, Bagel, Show-o, OmniGen2) combine vision and language processing to both understand and generate images"
- Vision-Augmented Prompting: A prompting framework that adds generated or processed visuals to enhance reasoning. "Vision-Augmented Prompting~\citep{xiao2024enhancing}"
- Visual ChatGPT: A tool-augmented framework enabling models to call vision/drawing tools during dialogue. "Visual ChatGPT~\citep{wu2023visual}"
- Visual-CoT: Chain-of-thought reasoning that interleaves intermediate visual cues with textual steps. "Visual-CoT input with both annotated image clues and textual thinking prompts"
- Visual grounding: Linking textual descriptions to specific regions or entities within an image. "visual grounding~\citep{yu2016modeling, mao2016generation}"
- Visual Question Answering (VQA): A task where models answer questions about an image. "Visual Question Answering (VQA)~\citep{antol2015vqa, fu2023mme, yue2024mmmu}"
- Visual Sketchpad: A framework that lets models generate/update diagrams via code to support visual reasoning. "Visual Sketchpad~\citep{hu2024visual}"
- Zero-shot CoT: Chain-of-thought prompting without labeled exemplars, relying on instructions to elicit reasoning. "zero-shot CoT~\citep{kojima2022large}"
Collections
Sign up for free to add this paper to one or more collections.