CodePlot-CoT: Mathematical Visual Reasoning by Thinking with Code-Driven Images
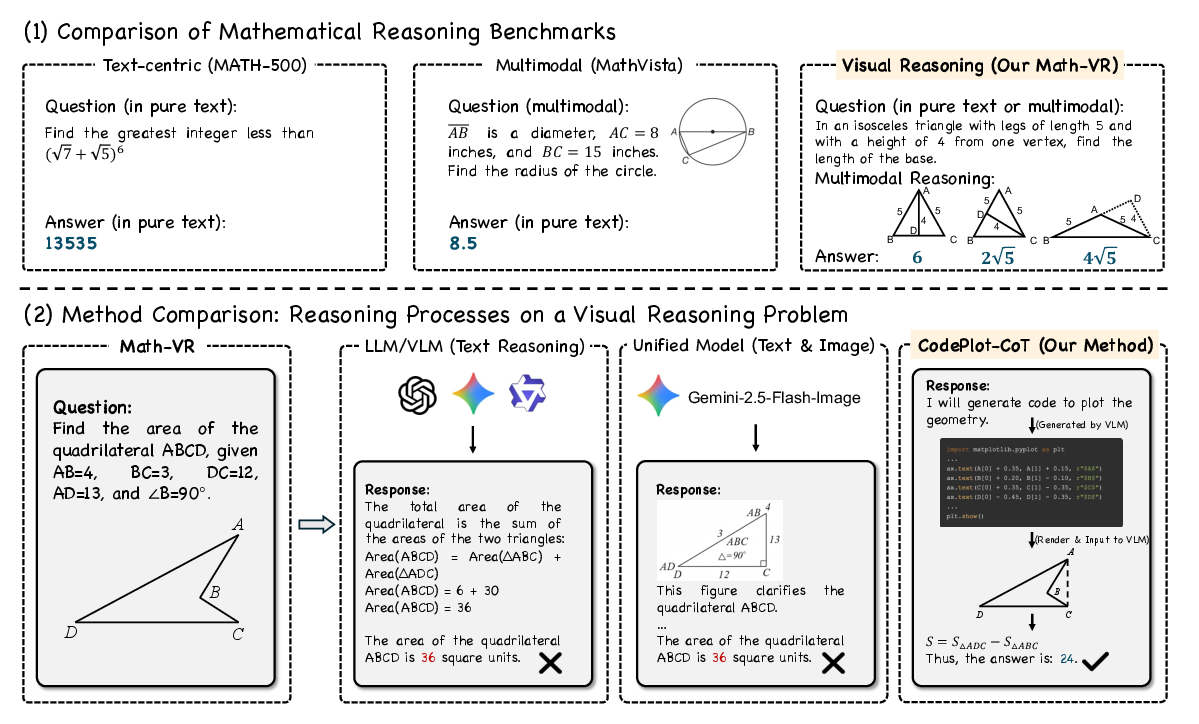
Abstract: Recent advances in LLMs and Vision LLMs (VLMs) have shown significant progress in mathematical reasoning, yet they still face a critical bottleneck with problems requiring visual assistance, such as drawing auxiliary lines or plotting functions to solve the problems. Most LLMs and VLMs are constrained to text-only reasoning chains, while multimodal unified models that can generate interleaved text and images lack the necessary precision and controllability for such tasks. To address this, we propose CodePlot-CoT, a code-driven Chain-of-Thought paradigm for "thinking with images" in mathematics. Our approach leverages the VLM to generate text reasoning as well as executable plotting code, which is then rendered into images as "visual thought", to solve mathematical problems. To achieve this, we first construct Math-VR, the first large-scale, bilingual dataset and benchmark for Mathematics problems with Visual Reasoning, comprising 178K samples. Second, to create high-quality training data, we develop a state-of-the-art image-to-code converter specialized for parsing complex mathematical figures into codes. Finally, using these training data, we train the CodePlot-CoT model for solving mathematical problems. Experimental results show that our model achieves up to 21% increase over base model on our new benchmark, fully validating the efficacy of our proposed code-driven reasoning paradigm. Our work opens a new direction for multimodal mathematical reasoning and provides the community with the first large-scale dataset, comprehensive benchmark, and strong approach for such problems. To facilitate future research, we make our datasets, code, and pretrained models publicly available at https://github.com/HKU-MMLab/Math-VR-CodePlot-CoT.
Paper Prompts
Sign up for free to create and run prompts on this paper using GPT-5.
Top Community Prompts
Explain it Like I'm 14
CodePlot-CoT: A Simple Explanation
What is this paper about?
This paper is about teaching AI to solve math problems that need pictures, like geometry diagrams or graphs, more like how humans do. Instead of only “thinking” in words, the AI learns to “think with images” by writing short pieces of code that draw precise figures. The model uses these code-made images to guide its reasoning and get the right answers.
What questions did the researchers ask?
To make AI better at visual math, the researchers asked:
- Can an AI solve math problems better if it creates and uses its own helpful pictures during thinking?
- Is it more reliable to make these pictures by writing code (which is exact) rather than by directly generating images (which can be fuzzy or imprecise)?
- Can we build a large, fair test set of math problems that truly require visual reasoning?
- Can we train a model to convert math figures into code and use that to teach the AI to “think with images”?
How did they do it?
The team built a full system with three big parts:
- A new dataset and benchmark called Math-VR
- They collected 178,000 real math problems (in both English and Chinese) where the solution uses at least one figure or plot.
- Most problems are high school level, especially geometry, where drawing extra lines or shapes is common.
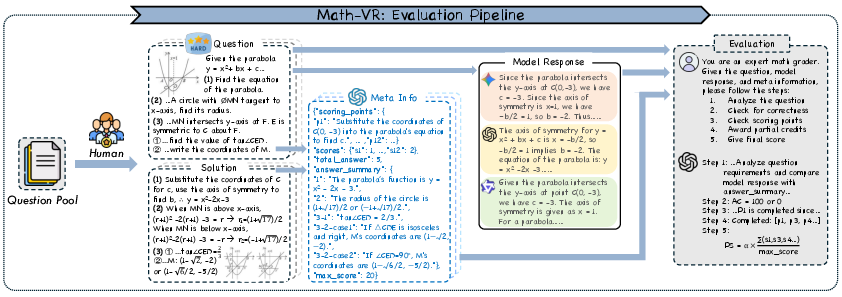
- They created a 5,000-question benchmark to test models fairly. It checks:
- Answer Correctness (AC): Is the final answer right or wrong?
- Process Score (PS): Even if the answer is wrong, did the model take important steps (like using the right theorem or drawing the right helper line)?
- A new idea for reasoning: CodePlot-CoT (think with code-driven images)
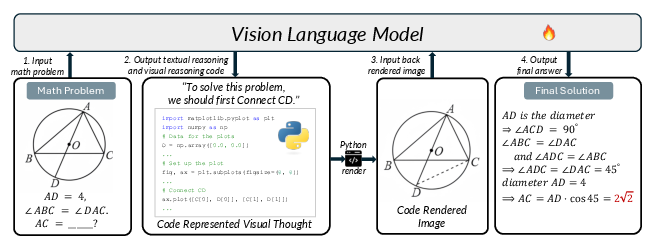
- Instead of only writing text, the model writes small pieces of plotting code (in Python) whenever it needs a diagram.
- This code is executed to draw a clean, precise figure (like “draw a circle with center O and radius r; draw tangent AB at B”).
- The newly drawn image is shown back to the model to help it reason further—like the model sketching on scratch paper.
- Why code? Because math diagrams must be exact (right angles, equal lengths, exact intersections). Code is precise; random image generation isn’t.
- A tool to turn images into code: MatplotCode
- To train the model, they needed lots of pairs of (image, code).
- They built MatplotCode, which takes a math figure and writes matplotlib code that can recreate it.
- This let them build high-quality training data so the model could learn how to “draw by coding” and use those drawings during problem solving.
What did they find, and why does it matter?
Here are the main results and why they’re important:
- CodePlot-CoT improved performance by up to 21% over its base model on the new Math-VR benchmark.
- This shows that “thinking with code-made images” really helps with visual math problems.
- Code-driven images beat direct image generation.
- When models tried to generate pictures directly, they often couldn’t make exact geometric constructions. Code-based drawings were accurate and reliable.
- The MatplotCode converter worked very well.
- Its code ran successfully almost all the time and recreated figures more faithfully than other systems.
- The evaluation method is trustworthy.
- Human judges and the automated scoring agreed closely, which means the benchmark and scoring are solid.
- It’s efficient.
- The model doesn’t need to produce tons of long text or huge images. Drawing with code is fast and precise.
What’s the bigger impact?
- Better math tutors and study tools: An AI that can sketch helper lines or plot graphs precisely can explain geometry and algebra more clearly to students.
- More human-like problem solving: People draw to think. Now AI can do that too—carefully and exactly—using code.
- Beyond math: Any task that needs precise diagrams or structured visuals (like engineering, architecture, data plots) could benefit from this code-driven visual thinking.
- A foundation for future research: The team released a big dataset (Math-VR), a strong benchmark, a code converter (MatplotCode), and their trained models so others can build on this work.
In short, the paper shows a practical, reliable way for AI to use picture thinking in math—by writing and running code to make precise images—and proves it really boosts performance.
Knowledge Gaps
Knowledge gaps, limitations, and open questions
Below is a single, consolidated list of concrete gaps and open issues left unresolved by the paper that future researchers can address:
- Dataset domain imbalance: Math-VR is ~81% geometry and secondary-school level; coverage of advanced algebra, calculus (e.g., piecewise/implicit/parametric plots), statistics/probability, combinatorics, and 3D geometry is limited. Extend to richer domains and higher difficulty levels.
- Proof-style reasoning excluded: Proof-based questions were removed from the benchmark; how to support and evaluate visual reasoning for proofs remains open.
- Train–test leakage risk: The dataset is scraped from public websites; no explicit near-duplicate detection, source-level deduplication, or leakage audits are reported. Implement robust de-dup pipelines (e.g., text/image hashing, code/solution similarity) and source-disjoint splits.
- Bilingual generalization untested: Although the dataset is bilingual (English/Chinese), evaluation focuses on 2.5k English questions. Assess cross-lingual parity, translation noise effects, and mixed-language prompts.
- External validity: The method is not evaluated on established benchmarks (e.g., MathVista, MathVerse, MATH-Vision) or out-of-domain datasets. Test generalization beyond Math-VR.
- Failure-mode analysis missing: Absolute AC remains low for the proposed model (22.1 overall). Provide an error taxonomy (e.g., wrong construction, constraint mis-encoding, reading errors, algebraic slips) and targeted ablations to guide improvements.
- Evaluation dependence on proprietary LLM: AC/PS use GPT-4.1 both to summarize references and to judge responses. Quantify sensitivity to prompt design, judge model choice, and temperature; provide an open-source judge or dual-judge protocols to reduce bias.
- Process Score design unvalidated: The choice of discount factor α=0.7 and scoring-point weights lacks ablation; calibrate PS against human grading at scale, and analyze inter-rater reliability on the full benchmark (not just a 1k subset).
- Fairness of comparisons: “Thinking” budgets, tool-use allowances, and token caps differ across baselines. Standardize inference-time budgets (tokens, tool calls, timeouts) to ensure fair comparisons.
- Limited expressivity of plotting code: Matplotlib-style 2D plotting may be insufficient for dynamic constructions, constraint-based geometry, exact constructions, or 3D. Explore domain-specific languages (e.g., GeoGebra/GCLC), SVG with constraints, or computational geometry APIs.
- Lack of formal constraint checking: There is no verification that generated plots satisfy textual constraints (e.g., tangency, concurrency, equal angles/lengths). Integrate constraint solvers, geometric theorem provers, or symbolic verifiers to validate constructions.
- Single-hypothesis plotting: Many geometry problems admit multiple valid configurations. Develop multi-hypothesis generation with branching and selection via constraint consistency or posterior scoring.
- No self-correction loop: The system does not detect contradictions between code-generated visuals and textual constraints. Add iterative “render–check–revise” loops with automatic inconsistency detection and re-plotting.
- No integration with CAS/solvers: The approach does not leverage computer algebra systems, equation solvers, or automated geometry provers to compute exact values or certify steps. Investigate hybrid code-plot + CAS/prover pipelines.
- Security/sandboxing not specified: Executing model-generated Python poses risks. Specify and evaluate sandboxing, whitelists, resource quotas, timeouts, and denial-of-service protections.
- Converter generalization: MatplotCode is evaluated mainly on curated math figures; robustness to hand-drawn diagrams, low-resolution scans, cluttered backgrounds, perspective/skew, and non-canonical styles is unknown. Build stress-test suites and report robustness metrics.
- Converter fidelity metrics: Reconstruction quality is judged by GPT-4.1 preferences, not geometric similarity. Introduce geometric metrics (e.g., primitive detection accuracy, keypoint/angle/length error, topology consistency) and human expert audits.
- Converter reliance on proprietary selection: GPT-4.1 is used to pick the “best” code among candidates. Provide an open, reproducible selection criterion or learned scoring model to replace closed-source dependence.
- Training-data noise from image-to-code: Supervision depends on automatically generated code that may approximate or distort diagrams. Quantify label noise and study denoising, confidence-weighting, or selective training strategies.
- Decision policy for when to plot: The model’s trigger for emitting code is learned implicitly via SFT; no explicit policy or ablation exists. Study policy learning (e.g., reinforcement learning, uncertainty-based triggers) and the impact of plot frequency on accuracy/cost.
- Multi-image state management: The paper claims multi-image reasoning, but there is no formal state model for consistent coordinates/primitives across steps. Introduce persistent scene graphs or shared construction state across code blocks.
- Cost and latency characterization: Tokens are reported, but wall-clock latency, GPU/CPU usage, and code-render time under varied hardware loads are not analyzed. Provide detailed cost–accuracy tradeoffs and throughput benchmarks.
- Scalability and model-size effects: Results are shown at 3B–32B (and selective baselines). Study scale laws for code-driven visual reasoning and the interaction between model size, code complexity, and performance.
- Robustness to adversarial inputs: The system is not evaluated against adversarial or misleading diagrams/captions (e.g., off-by-one labels, near-tangent illusions). Create adversarial/perturbation benchmarks and report robustness.
- Human interpretability/user studies: While claiming interpretability, there is no human-subject evaluation of the clarity, pedagogical value, or trustworthiness of code-driven visual thoughts. Conduct user studies with educators/students.
- Reusability of generated plots: Whether intermediate plots and code are reusable as formal solution artifacts (e.g., for grading, teaching) is not explored. Study downstream utility in educational or assessment settings.
- Data licensing and provenance: Although sources are public, dataset licensing compatibility and content provenance (attribution, terms of use) are not detailed. Provide license-aware filtering, source metadata, and redistribution permissions.
- Reproducibility constraints: Several critical steps (filtering, translation, evaluation, code selection) rely on proprietary models. Offer open alternatives, seeds, and full pipeline scripts to enable end-to-end reproducibility.
- Generalization beyond mathematics: The paradigm could apply to other visual–logical domains (engineering drawings, physics diagrams, circuits), but this is not demonstrated. Evaluate transfer and required adaptations.
- Extending to temporal/interactive visuals: Dynamic geometry or interactive constructions are out of scope. Explore support for animations, sliders, and interactive constraints for time-varying or parametric reasoning.
- Quantifying gains per plot call: No ablation on the marginal benefit of each additional plot/code block or diminishing returns. Measure accuracy vs. number of visual-thought steps to optimize plotting policy.
- Handling long/ambiguous texts: Many problems have lengthy or ambiguous descriptions; how well the system resolves textual ambiguity via plotting is not quantified. Add benchmarks measuring disambiguation efficacy via visual thoughts.
Practical Applications
Immediate Applications
Below are actionable use cases that can be deployed with today’s stack, derived from the paper’s code-driven visual reasoning paradigm, dataset/benchmark, and image-to-code tooling.
- Education (EdTech): AI math tutor that “thinks with diagrams”
- What: Interactive tutoring assistants that generate auxiliary lines/plots via executable code while explaining steps, then refine reasoning using the rendered figure.
- Tools/products/workflows: LMS plugin; classroom tablet/whiteboard assistant; mobile homework helper; “Explain-with-figure” button in problem sets; Jupyter/Colab widgets that render and iterate on code-driven diagrams.
- Dependencies/assumptions: Secure Python sandbox (matplotlib or similar); integration with LMS/SIS; alignment to curricula/standards; reliability on K–12 geometry-heavy content; bilingual support (EN/ZN) is available but broader languages need extension.
- Education assessment: Auto-grading with final-answer and process scoring
- What: Use the paper’s Answer Correctness (AC) and Process Score (PS) scheme to evaluate both final answers and partial reasoning steps, including visual steps.
- Tools/products/workflows: “Reasoning-aware grader” API; exam platforms that award partial credit for correct visual steps; teacher dashboards to review visual thought trails (code + render).
- Dependencies/assumptions: Consistent rubric extraction and scoring-point design; reliance on evaluator VLMs (e.g., GPT-4.1) or local alternatives; policy alignment for AI-aided grading.
- Developer tools: “Plot-while-reasoning” copilot for STEM coding notebooks
- What: Notebook/IDE extension that proposes plotting code to test hypotheses (e.g., sketches of geometric constructions, function behaviors), renders them, and revises reasoning based on visuals.
- Sector: Software/Developer Tools, Data Science
- Tools/products/workflows: JupyterLab/VS Code extensions; “visual thought” panel; diffable code + figure lineage for auditability.
- Dependencies/assumptions: Python execution environment; UI integration; user governance for code execution safety.
- Publishing and content modernization: Convert textbook figures to code for reusability
- What: Turn static figures from STEM textbooks/problem sets into executable code (via
MatplotCode) for responsive re-rendering, localization, and accessibility. - Sector: Publishing, Education
- Tools/products/workflows: Batch PDF/image-to-code pipelines; editorial toolchains to regenerate vector-quality diagrams; versioned figure repositories.
- Dependencies/assumptions: Figures are mathematical/diagrammatic (best fit for geometry/function plots); IP/licensing for source materials; converter tuned for math (not general photos).
- What: Turn static figures from STEM textbooks/problem sets into executable code (via
- Accessibility: Screen-reader and tactile-ready math diagrams
- What: Generate structured code for diagrams that can output accessible SVG/MathML and support tactile graphics production.
- Sector: Assistive Technology, Education
- Tools/products/workflows: “Accessible diagram” generator SaaS; alt-text + code bundle for each figure.
- Dependencies/assumptions: Conversion fidelity for precise geometry; workflow for assistive formats; institutional adoption.
- EdTech content creation: Parameterized problem authoring with verified visuals
- What: Teachers/content teams generate families of problems with code-backed figures and step-by-step solutions; visuals update automatically when parameters change.
- Sector: Education/EdTech
- Tools/products/workflows: “Geometry Problem Studio” with template libraries; batch solution rendering; randomization for practice/exams.
- Dependencies/assumptions: Coverage strongest in geometry and function plotting; QA to avoid subtle diagram-solution mismatches.
- Model evaluation and benchmarking
- What: Use Math-VR benchmark to measure model progress on visual reasoning, comparing baselines and “thinking” modes across VLMs.
- Sector: AI R&D (Academia/Industry)
- Tools/products/workflows: CI gates for model releases; public leaderboards; ablations comparing text-only vs code-driven visual reasoning.
- Dependencies/assumptions: Reproducibility depends on evaluator model prompts; dataset licensing adhered to.
- Customer support for STEM products
- What: Assist users of calculators, geometry tools, or graphing apps by generating precise plots and annotated constructions that explain steps.
- Sector: Software, Consumer Apps
- Tools/products/workflows: In-app chat that returns code + rendered plot; “fix my graph” support flows.
- Dependencies/assumptions: Clear scope (math figures); safe code-execution sandboxing.
- Scientific communication within math/CS courses
- What: Auto-generate figure code for lecture notes, problem explanations, and solution keys.
- Sector: Academia
- Tools/products/workflows: LaTeX + Python weave; TikZ/matplotlib bridges; reproducible figure pipelines.
- Dependencies/assumptions: Primarily math-style figures; conversion beyond matplotlib requires adapters.
- Lightweight mobile learning apps
- What: Phone app that snaps a photo of a geometry problem, converts auxiliary figures to code, renders precise diagrams, and walks through the solution.
- Sector: Consumer EdTech
- Tools/products/workflows: On-device or cloud execution; “photo-to-plot-to-solution” flow with bilingual support (EN/ZN).
- Dependencies/assumptions: Connectivity or on-device runtime; safety/privacy for student data; quality of camera input.
Long-Term Applications
These use cases require further research, integration with domain tools, scaling beyond math diagrams, or formal controls.
- CAD-lite and engineering sketches with constraints
- What: Extend code-driven reasoning from math figures to CAD-like parametric sketches (e.g., OpenCASCADE), maintaining geometric constraints precisely during planning and verification.
- Sector: Engineering/CAD, Manufacturing
- Tools/products/workflows: “Design-with-code” assistant that proposes constraint-satisfying sketches; tolerance checks; change-propagation via param updates.
- Dependencies/assumptions: Robust adapters from plotting code to CAD kernels; domain coverage (dimensions, tolerances); safety-critical QA.
- Robotics and autonomy: Geometry-aware planning with verifiable visual thoughts
- What: Generate code-defined maps/trajectories that satisfy geometric constraints (visibility, clearances), render them, and iteratively reason using the visuals.
- Sector: Robotics, Mobility
- Tools/products/workflows: Planning copilots that emit executable path definitions; simulated render feedback loops; integration with motion planners (e.g., OMPL).
- Dependencies/assumptions: Precise environment modeling; closed-loop validation; real-world noise and dynamics not captured by simple plots.
- Scientific reproducibility at scale: Figure-to-code across disciplines
- What: Generalize
MatplotCodeto broader plotting ecosystems (Plotly, ggplot2, TikZ, D3), enabling reverse engineering of published figures for re-analysis and replication. - Sector: Research, Publishing, Policy
- Tools/products/workflows: Journal submission checks that include code-backed figures; “rebuild my plot” services for peer review and meta-analyses.
- Dependencies/assumptions: Diverse chart/diagram grammars; noisy scans; legal/IP considerations; domain-agnostic fidelity.
- What: Generalize
- Formal verification and audit trails for AI reasoning
- What: Regulatory or enterprise standards that require code-generated, auditable intermediate artifacts (plots + code) for high-stakes reasoning.
- Sector: Policy/Standards, RegTech, Compliance
- Tools/products/workflows: “Reasoning artifact” archives; code execution logs; compliance dashboards for model decisions.
- Dependencies/assumptions: Consensus standards; standardized sandboxes; privacy and security of artifacts.
- Symbolic-visual hybrid solvers
- What: Combine code-driven drawings with CAS/geometry theorem provers to produce formally validated constructions and proofs, not just numeric answers.
- Sector: Education, Research, Safety-Critical Engineering
- Tools/products/workflows: Assistants that output both a rendered construction and a machine-checkable proof; proof-carrying solutions in classrooms.
- Dependencies/assumptions: Tight integration with provers; coverage of school and competition math axioms; user-friendly proof explanations.
- AR overlays for math instruction and lab exercises
- What: Real-time overlays that add auxiliary lines or plots onto printed pages/whiteboards using code-defined visuals as the ground truth.
- Sector: Education, Training
- Tools/products/workflows: Classroom AR apps; camera capture → code → overlay pipeline; teacher broadcast mode.
- Dependencies/assumptions: Reliable detection/registration; low-latency device execution; robust to lighting/occlusions.
- Finance and operations analytics copilots with hypothesis-driven plotting
- What: Assist analysts by proposing code-defined, constraint-aware scenario plots that support explainable decision-making.
- Sector: Finance, Operations, Supply Chain
- Tools/products/workflows: “Visual thought” sidecar that generates scenario charts with explicit assumptions encoded in code; revision cycles based on rendered outputs.
- Dependencies/assumptions: Extension to time-series and econometric plots; data governance; risk controls.
- Healthcare diagrams and clinical pathway planning (structured schematics)
- What: Use code-driven diagrams to plan and audit clinical workflows or anatomical schematics with clear constraints (e.g., surgical steps).
- Sector: Healthcare
- Tools/products/workflows: “Pathway-with-code” builders; QA of guideline adherence using visual constraints.
- Dependencies/assumptions: Domain ontologies, patient data privacy; accuracy beyond simplified geometric representations.
- Standards and accreditation for AI in education
- What: Adopt Math-VR-like benchmarks as part of edtech accreditation, rewarding systems that produce verifiable visual thoughts and process scores.
- Sector: Policy, Education
- Tools/products/workflows: Certification tests; public scorecards; procurement criteria for schools/districts.
- Dependencies/assumptions: Governance bodies’ buy-in; robust, bias-aware evaluation pipelines without reliance on a single proprietary evaluator.
- Diagram reverse-engineering for legacy documentation
- What: Convert engineering drawings/schematics in scanned manuals into editable, code-driven diagrams for modernization and maintenance.
- Sector: Industrial Maintenance, Energy, Aerospace
- Tools/products/workflows: PDF-to-code services; change-tracked updates; digital twins alignment.
- Dependencies/assumptions: Expansion of image-to-code beyond math figures; handling noise and varied symbol sets.
- Low-resource/on-device learning assistants
- What: Deploy efficient, code-driven tutors that minimize token budgets by using concise plotting code instead of long textual chains or heavy image generation.
- Sector: Education, Public Sector
- Tools/products/workflows: Offline-capable mobile tutors; municipal deployments for after-school programs.
- Dependencies/assumptions: On-device inference optimizations; lightweight rendering stacks; localized content.
- Auto-generated STEM exams with parameterized figures and verified solutions
- What: End-to-end pipeline to create large, diverse exam banks where each problem has code-backed figures and correctness-checked solutions.
- Sector: Education
- Tools/products/workflows: Exam bank generator; proctoring integrations; item-response analytics.
- Dependencies/assumptions: Robust parameter ranges to avoid degenerate cases; fairness and difficulty calibration.
- Cross-lingual STEM learning content expansion
- What: Scale the bilingual (EN/ZN) dataset approach to more languages, enabling equitable access to visual reasoning content.
- Sector: Education, Public Policy
- Tools/products/workflows: Localization toolchains; culturally adapted examples; teacher training materials.
- Dependencies/assumptions: High-quality translation and figure-context alignment; regional standards mapping.
- Safety-first code execution frameworks for AI tools
- What: Hardened sandboxes and auditing tailored to code-driven reasoning (plotting libraries, resource/time caps, deterministic outputs).
- Sector: Platform Engineering, Security
- Tools/products/workflows: “Safe-plot” runtimes; policy-controlled tool-use profiles; reproducibility snapshots.
- Dependencies/assumptions: Platform integration; performance under constraints; defense-in-depth for code execution.
Explanation of applicability: The paper’s central innovation—representing visual reasoning as executable plotting code and feeding the rendered visuals back into the reasoning loop—offers precision, verifiability, and lower token costs versus pixel generation. Paired with the Math-VR benchmark and the MatplotCode converter, it unlocks immediate education-focused products and establishes a pathway to broader, high-assurance applications in engineering, robotics, publishing, and policy where traceable, constraint-satisfying visual reasoning is essential.
Glossary
- Ablation studies: Controlled experiments that remove or vary components to assess their contribution. "To better understand the contribution of each design choice in our framework, we conduct two sets of ablation experiments."
- Agent-plus-code paradigm: An approach where a model plans and uses external code tools to perform precise operations. "The agent‑plus‑code paradigm treats the model as a planner that create and manipulate input figure by predicting code snippets and call to external tools (Python, CAS/solver libraries, plotting utilities etc.)."
- Answer Correctness (AC): A binary metric that scores whether the final answer exactly matches the ground truth. "If the answer is completely correct, it receives a score of 1 for AC; any error or omission results in a score of 0."
- Auxiliary lines: Additional geometric lines drawn to reveal relationships and simplify proofs or calculations. "Recent advances in LLMs and Vision LLMs (VLMs) have shown significant progress in mathematical reasoning, yet they still face a critical bottleneck with problems requiring visual assistance, such as drawing auxiliary lines or plotting functions to solve the problems."
- CAS/solver libraries: External computational tools (e.g., Computer Algebra Systems) used to symbolically or numerically solve mathematics. "(Python, CAS/solver libraries, plotting utilities etc.)"
- Chain-of-Thought (CoT): Step-by-step reasoning process generated by models to solve complex tasks. "we propose CodePlot-CoT, a code-driven Chain-of-Thought paradigm for ``thinking with images'' in mathematics."
- Cohen’s kappa: A statistic measuring inter-rater agreement beyond chance for categorical judgments. "We report Cohen’s and MCC ."
- Diffusion models: Generative models that learn to reverse a noise-adding process to synthesize images; here cited as heavy pixel-level modeling. "without introducing complex distributional modeling (e.g., diffusion models)."
- Execution Success Rate: The proportion of generated code that runs without errors. "We assess two aspects: (i) Execution Success Rate, i.e., the probability that the generated code runs without errors."
- Executable plotting code: Code that, when run, renders precise figures to support visual reasoning. "our approach guides the model to output executable plotting codes which are rendered into images as intermediate ``visual thoughts''."
- Geometric constraints: Strict conditions on shapes, positions, angles, and lengths that constructions must satisfy. "Even state-of-the-art unified models struggle to execute precise operations in mathematics, such as constructing auxiliary lines that satisfy strict geometric constraints."
- High-dimensional distribution of natural images: The complex statistical space governing real image pixels and textures that is hard to model directly. "The fundamental challenge in direct image generation and manipulation arises from the inherent difficulty in modeling the high-dimensional distribution of natural images"
- Image-to-code converter: A system that translates images of figures into equivalent plotting code. "we develop MatplotCode, a high-fidelity image-to-code converter, which we leverage to construct code-driven CoT for training."
- Interleaved text and image reasoning: A decoding paradigm where models generate mixed sequences of text and images to reason. "build unified models capable of generating interleaved text and image reasoning chain auto-regressively."
- LLMs: Models trained on massive text corpora to perform diverse language tasks. "Recent advances in LLMs and Vision LLMs (VLMs) have shown significant progress in mathematical reasoning"
- MatplotCode: The proposed high-fidelity converter specialized for mathematical figures. "we develop MatplotCode, a high-fidelity image-to-code converter"
- Math-VR: The introduced large-scale bilingual dataset and benchmark for mathematical visual reasoning. "we first construct Math-VR, the first large-scale, bilingual dataset and benchmark for Mathematics problems with Visual Reasoning, comprising 178K samples."
- Matthews Correlation Coefficient (MCC): A balanced metric for binary classification agreement accounting for all confusion matrix terms. "We report Cohen’s and MCC ."
- MLP projector: A multilayer perceptron that maps vision features to the LLM’s embedding space. "we first align the visual components by training only the vision encoder (ViT) and the MLP projector for one epoch"
- Multimodal reasoning: Reasoning that combines information across text and images (or other modalities). "Math-VR necessitates multimodal reasoning with images."
- Pearson r: A statistic measuring linear correlation between two continuous variables. "We report Pearson and Spearman ."
- Process Score (PS): A partial-credit metric that evaluates the reasoning steps even if the final answer is wrong. "(2) Process Score (PS): When solving mathematical questions, even if the final answer is incorrect, the reasoning process may still be meaningful."
- Programmatic code: Structured textual representation (code) used to precisely specify and render visual elements. "we introduce programmatic code as the optimal representation for mathematical visual reasoning."
- Reconstruction Fidelity: A measure of how closely generated code-rendered images match the originals. "We assess two aspects: (i) Execution Success Rate, i.e., the probability that the generated code runs without errors. (ii) Reconstruction Fidelity, judged by GPT-4.1 via a standardized prompt to decide which reconstruction is most similar to the original image."
- Spearman rho: A statistic measuring rank-order correlation between two variables. "We report Pearson and Spearman ."
- Supervised Fine-Tuning (SFT): Further training of a model on labeled data to specialize its behavior. "We then fully finetune this model on our curated SFT dataset for 5000 steps."
- Tool-augmented agents: Models that plan and invoke external tools (e.g., code execution) to produce precise, verifiable outputs. "In contrast to interleaved generation, tool-augmented agents provide precise and verifiable outputs by executing code"
- Unified Model (UM): A single model that can generate both text and images in one autoregressive sequence. "Model Types: VLM: Vision LLM, LLM: LLM, UM: Unified Model."
- Vision encoder (ViT): A visual backbone (Vision Transformer) used to encode images for multimodal models. "we first align the visual components by training only the vision encoder (ViT) and the MLP projector for one epoch"
- Vision LLMs (VLMs): Models that jointly process and reason over visual and textual inputs. "Recent advances in LLMs and Vision LLMs (VLMs) have shown significant progress in mathematical reasoning"
- Visual Chain-of-Thought (Visual CoT): A paradigm where models generate intermediate visual steps to support reasoning. "Recent efforts in general-domain visual understanding have explored the paradigm of Visual Chain-of-Thought (Visual CoT)"
- Visual tokens: Discrete representations of images embedded as tokens within a sequence model. "These approaches discretize or embed images into visual tokens and train a single sequence model that sequencially outputs text and image during decoding."
- Zero-shot: Performing a task without task-specific training examples or fine-tuning. "Current planners are often zero-shot and not specifically trained for mathematical reasoning"
Collections
Sign up for free to add this paper to one or more collections.