- The paper proposes a two-stage framework combining real-time nowcasting with double/debiased machine learning to predict market troughs in the S&P 500.
- It employs extensive feature engineering and SHAP-based interpretability, achieving an ROC AUC of 0.89 and well-calibrated probabilities.
- Comparative causal analysis reveals that volatility factors and market illiquidity are robust triggers, highlighting the importance of flexible, nonlinear models.
Predicting Market Troughs: A Machine Learning Approach with Causal Interpretation
Introduction and Motivation
This paper addresses the challenge of identifying and understanding the causal drivers of equity market troughs, with a focus on the S&P 500 index. The authors argue that prior approaches, often based on restrictive linear models, are inadequate for capturing the complex, nonlinear, and high-dimensional nature of financial markets. They propose a two-stage framework: (1) a high-performance nowcasting model for real-time detection of market troughs, and (2) a comparative causal analysis using Double/Debiased Machine Learning (DML) to robustly identify causal triggers, explicitly testing the sensitivity of conclusions to model specification.
The study is motivated by the need for both accurate prediction and credible causal inference in financial market stress events. The authors emphasize that robust causal identification is essential for both policymakers and market participants, as it enables targeted interventions and informed risk management.
Data, Labeling, and Feature Engineering
The dataset spans April 2013 to June 2025 and integrates high-frequency options, futures, macroeconomic, and sentiment data. The target variable—market troughs—is labeled using a modified Bry-Boschan algorithm, which systematically identifies significant turning points in the S&P 500 log price series. To avoid data leakage, the prediction task is framed as a nowcasting problem: the model estimates, in real time, the probability that the current day will eventually be labeled as a trough, using only information available up to that day.
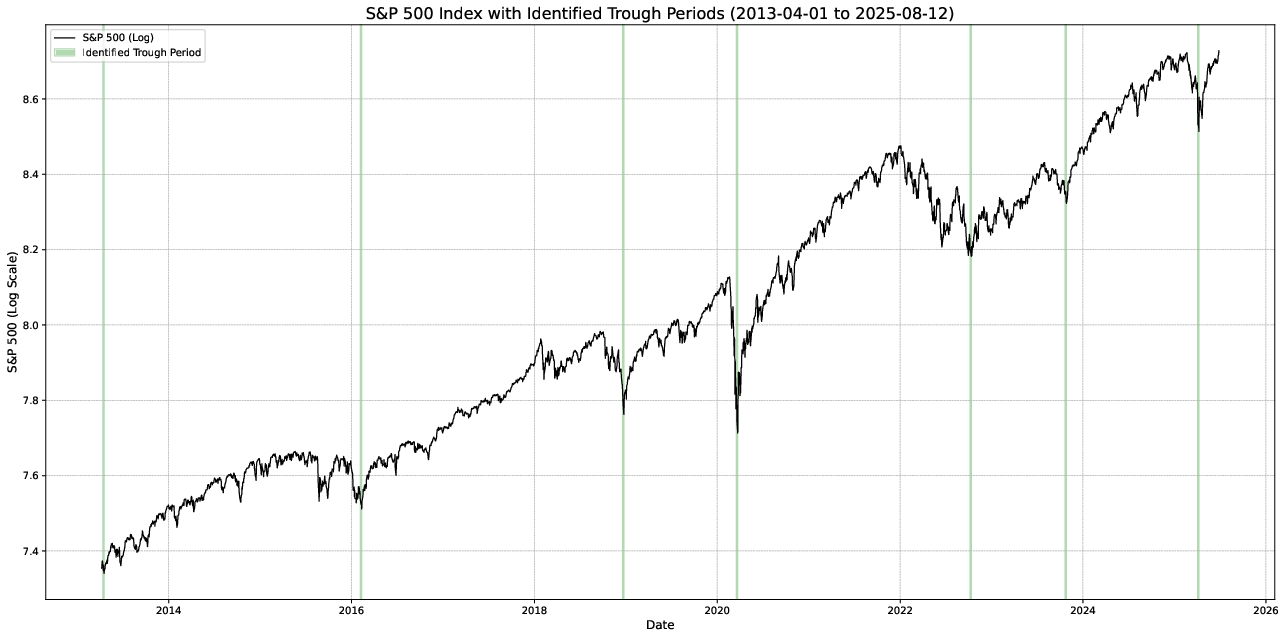
Figure 1: S&P 500 log price series with algorithmically identified market troughs, illustrating the temporal distribution of labeled events.
Feature engineering is extensive, resulting in over 200 predictors grouped into structural (e.g., dealer gamma exposure, credit spreads, liquidity) and sentiment (e.g., VIX, put/call ratios, risk-neutral moments) categories. Advanced transformations—rate-of-change, trend z-scores, wavelet decompositions, and rolling percentile scaling—are applied to address non-stationarity, fat tails, and persistence in the raw data.
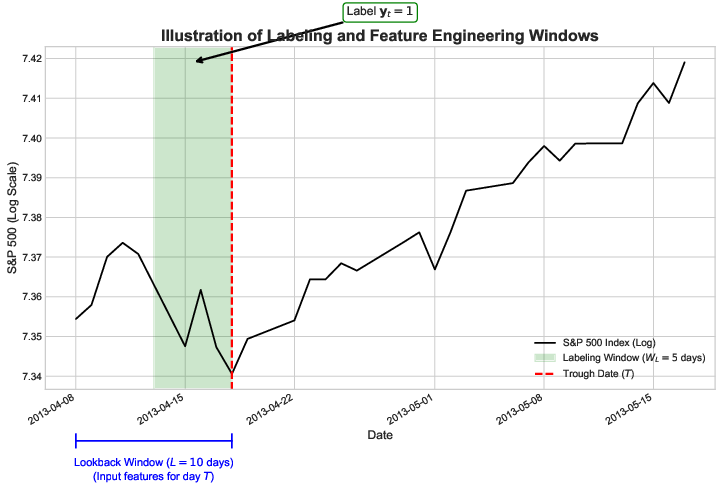
Figure 2: Schematic of the labeling and feature engineering process, showing the lookback and labeling windows relative to a market trough.
The prediction task is formulated as a rare-event binary classification problem. The pipeline includes SMOTE for class imbalance, feature selection via Random Forest Gini importance, and a linear SVM as the primary classifier. Nested time-series cross-validation is used for hyperparameter tuning and unbiased performance estimation. The final model uses 15 features and applies isotonic regression for probability calibration.
Out-of-sample results on the hold-out set (July 2023–June 2025) are strong: ROC AUC of 0.89 and Brier score of 0.017, indicating both high discrimination and well-calibrated probabilities. The model outperforms benchmarks, including LassoCV (which suffers from poor calibration), naive VIX-based heuristics, and Gaussian Naive Bayes.
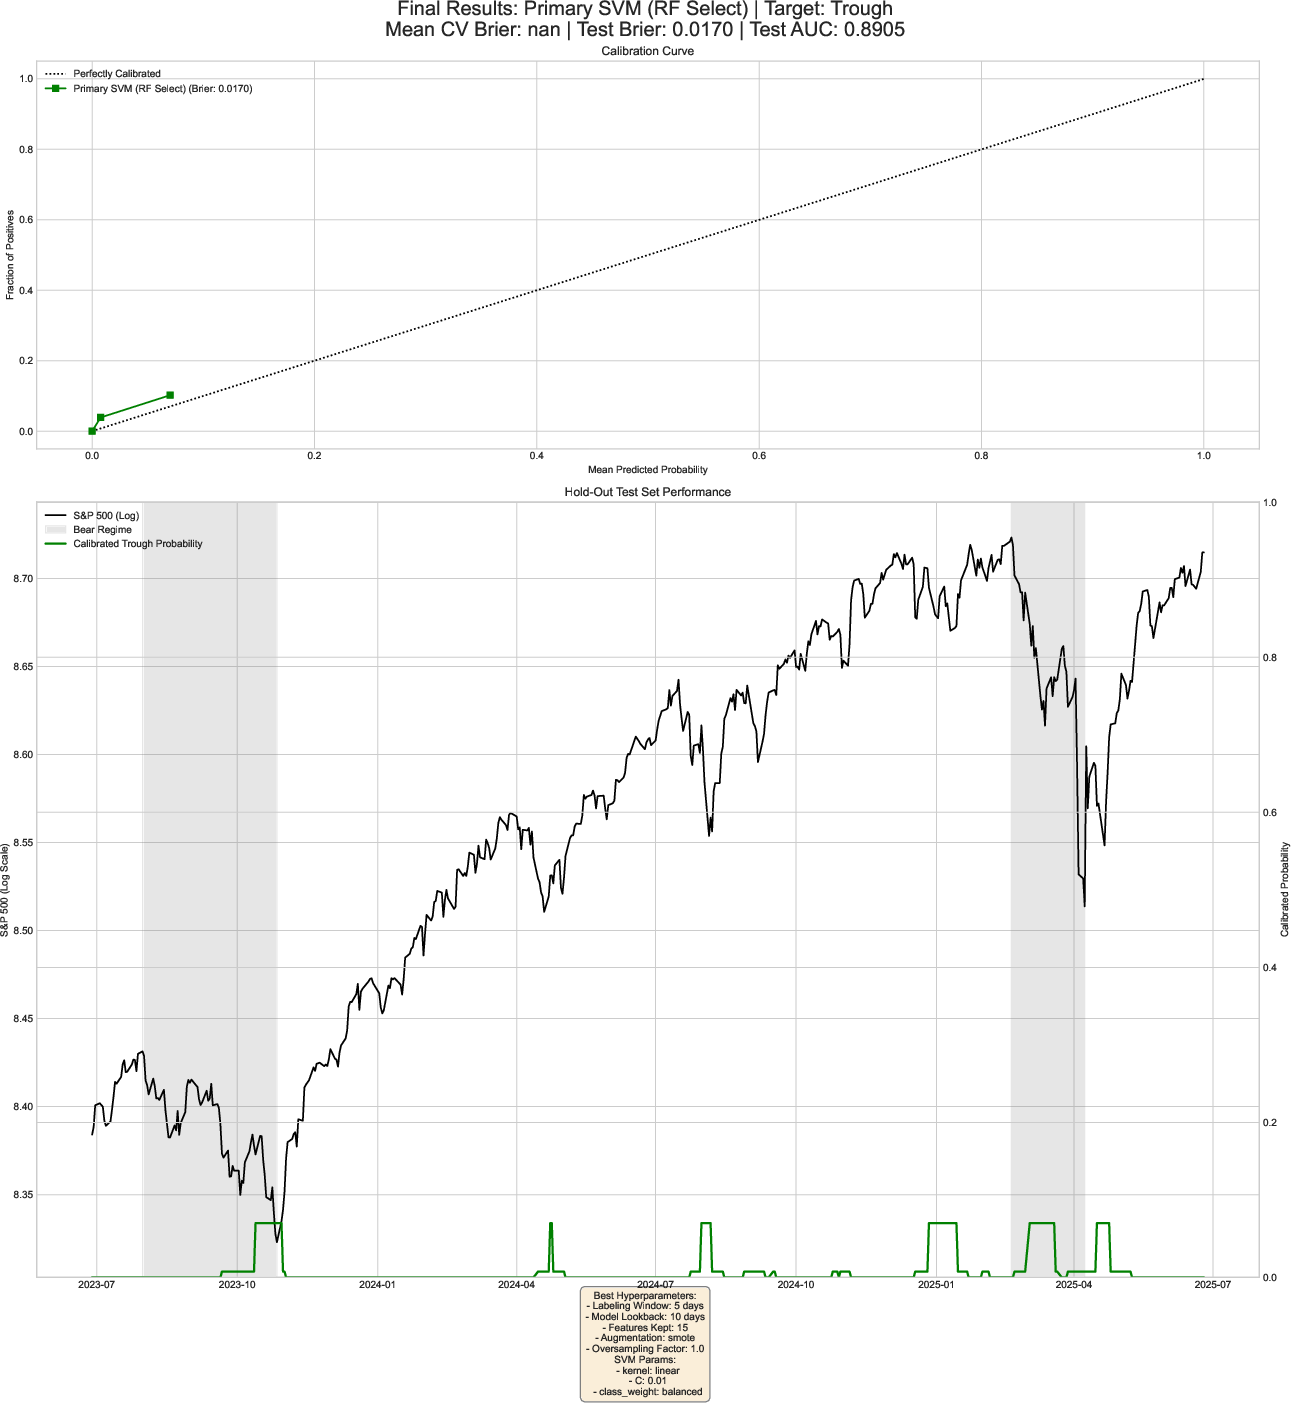
Figure 3: Out-of-sample predictive performance, including calibration curve and predicted trough probabilities over time.
Model Interpretation and Feature Importance
Interpretability is addressed using SHAP values. The most influential features are the volatility of the 63-day rate-of-change in gamma exposure (GEX) and credit spread volatility. SHAP dependence and interaction plots reveal that troughs are more likely when GEX volatility is low-to-moderate and persistent, and when credit spread volatility is rising but not extreme. Nonlinear interactions are evident, particularly between credit spread volatility and realized volatility, and between realized volatility and funding conditions.
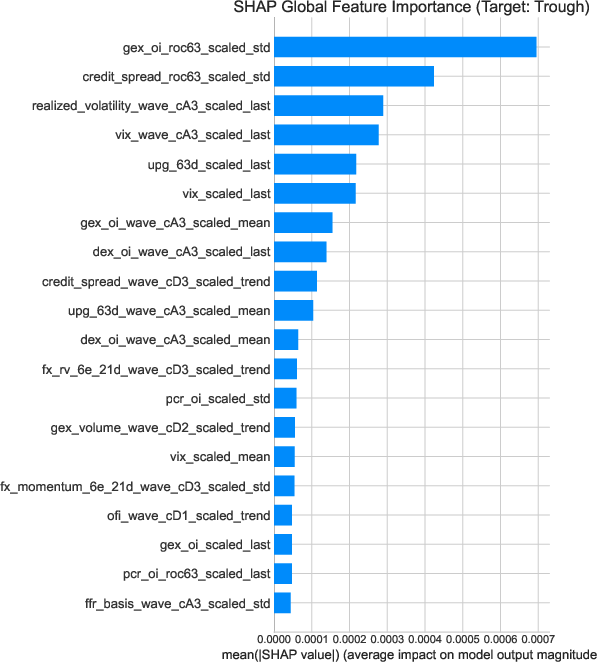
Figure 4: SHAP global feature importance for the SVM model, highlighting the dominance of GEX and credit spread volatility.
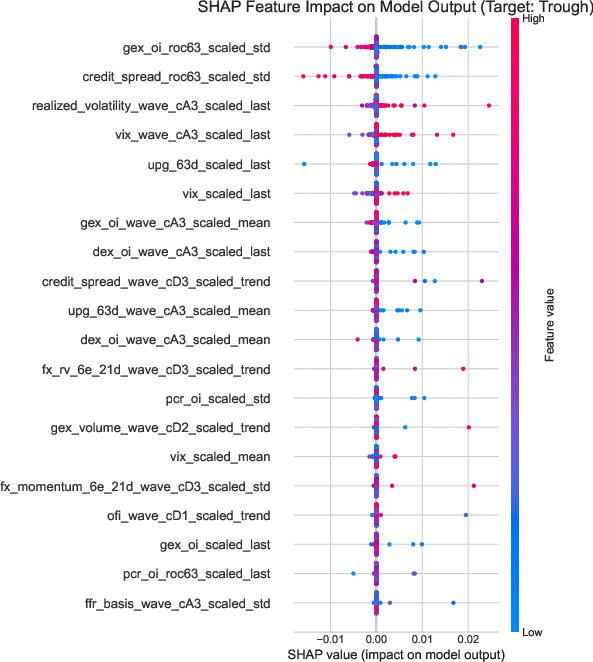
Figure 5: SHAP beeswarm plot showing the direction and heterogeneity of feature impacts on trough probability.
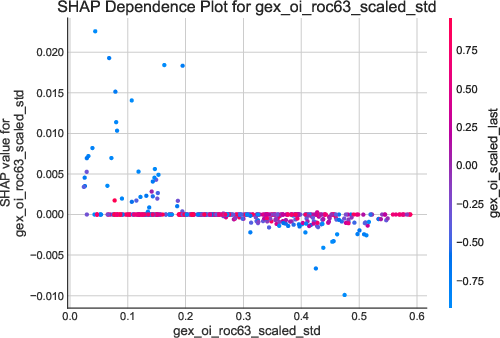
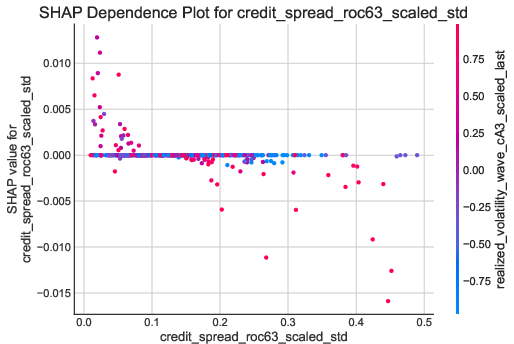
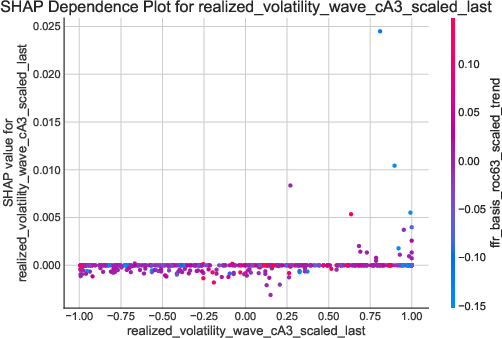
Figure 6: SHAP dependence plots for top predictive features, illustrating key nonlinearities and interaction effects.
Robustness and Stability
Robustness is evaluated along three axes:
- Temporal stability: Rolling Brier scores remain low except during actual troughs, with rapid recovery post-event.
- Covariate shift: Kernel density estimates show no significant distributional changes in key features between training and test periods.
- Concept drift: SHAP feature importance rankings are stable across the hold-out period, indicating that the model’s learned relationships persist.
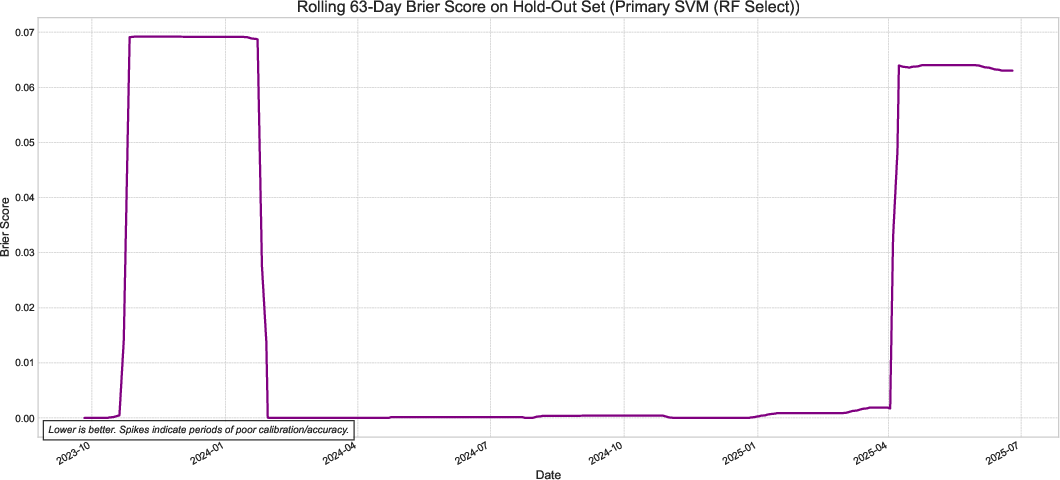
Figure 7: Rolling Brier score demonstrating temporal stability of model performance.
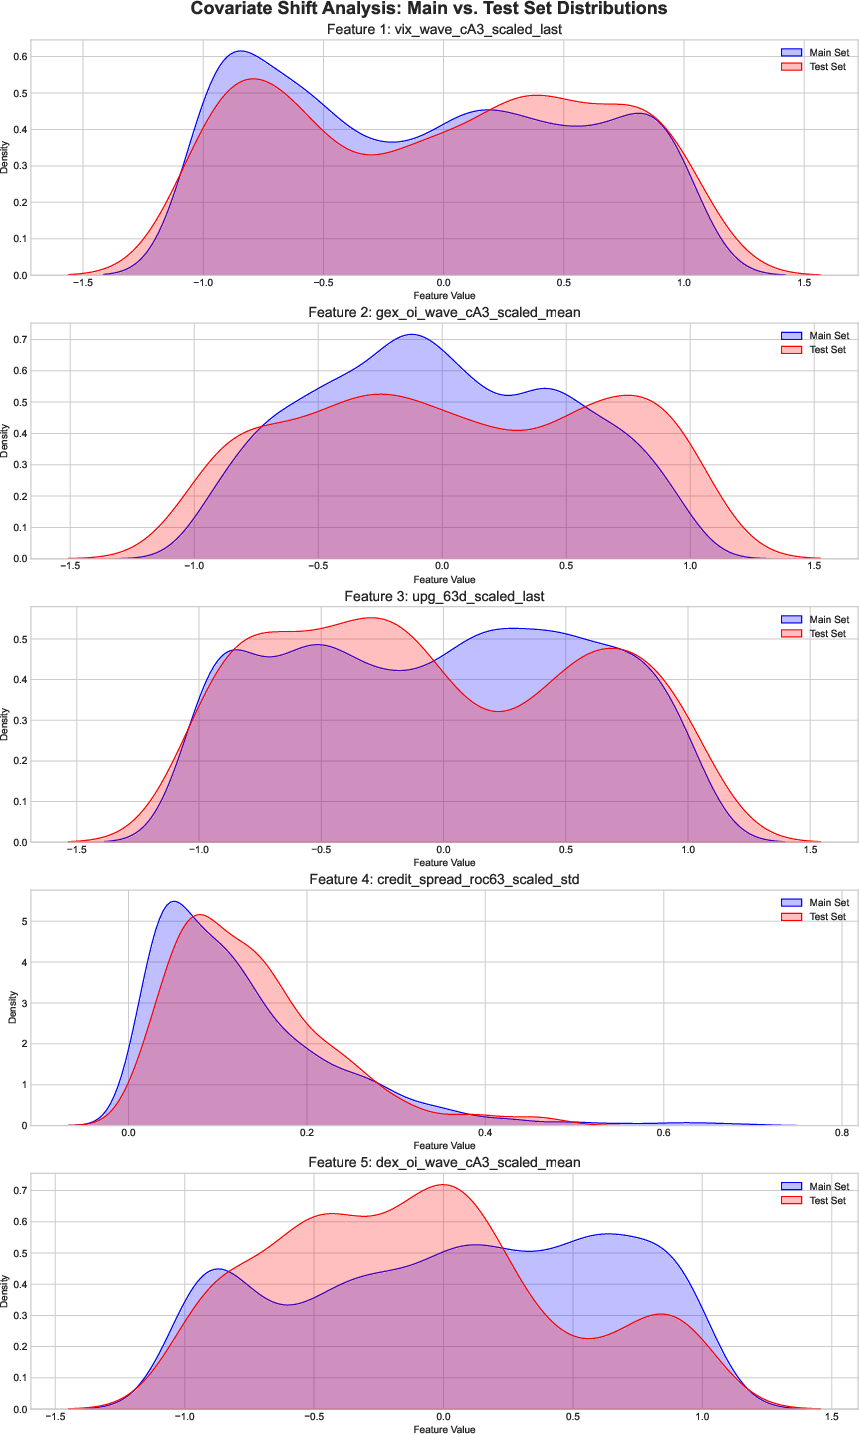
Figure 8: Covariate shift analysis for top predictive features, showing stable distributions across periods.
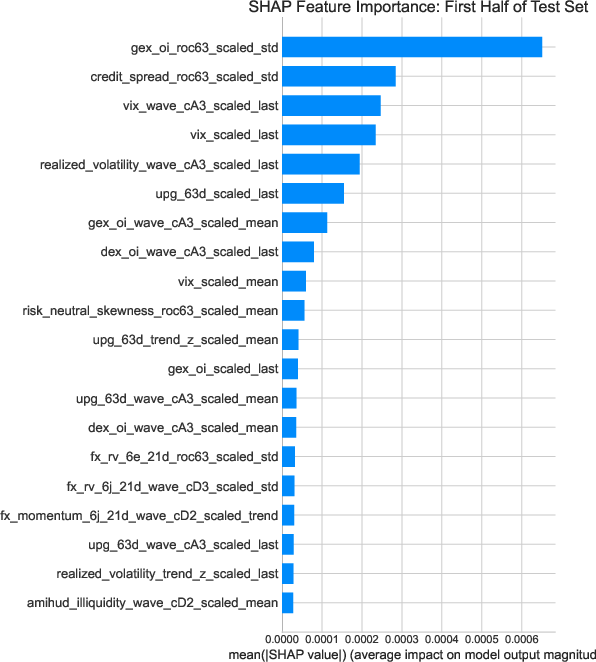
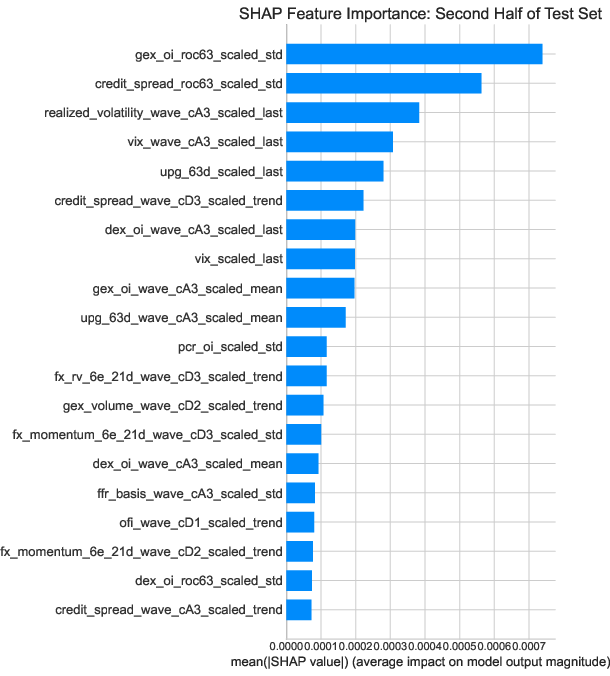
Figure 9: Stability of SHAP feature importance across the hold-out test set.
Economic Significance and Backtesting
A stylized backtest using E-mini S&P 500 futures demonstrates the economic value of the nowcast signal. A simple fixed-size strategy achieves annualized Sharpe ratios above 2.0 for 10–12 day holding periods, with robust performance across parameter choices. However, aggressive pyramiding strategies, while yielding high returns, suffer from catastrophic drawdowns, highlighting the model’s limitation in distinguishing V-shaped reversals from prolonged bear markets. The signal is best interpreted as a panic/capitulation detector rather than a trend reversal validator.
Comparative Causal Analysis: DML-PLR vs. DML-APE
The core methodological contribution is a comparative causal analysis using DML. The baseline is the partially linear regression (DML-PLR), which assumes constant, additive treatment effects. The main model is the Average Partial Effect (DML-APE), which allows for nonlinear, interactive, and state-dependent effects, and is more appropriate for binary outcomes.
Key findings:
- Specification sensitivity: Several causal effects change sign or lose significance when moving from PLR to APE, underscoring the risk of spurious inference under restrictive linearity.
- Robust drivers: The trend in the Fed Funds futures slope (proxy for monetary policy expectations) is a robust, negative causal driver of trough probability across both models.
- New causal channels: The DML-APE model identifies the volatility of options-implied risk appetite (e.g., GEX, risk-neutral skewness/kurtosis) and market illiquidity (Amihud measure) as significant causal triggers, consistent with intermediary asset pricing theory.
- Sign reversals: For example, the volatility of Amihud illiquidity switches from a negative (stabilizing) effect in PLR to a positive (destabilizing) effect in APE, aligning with theoretical expectations.
Theoretical and Practical Implications
The findings provide high-frequency empirical support for modern intermediary asset pricing models, which posit that market troughs are triggered by nonlinear dynamics in risk appetite and liquidity, especially when intermediaries are capital-constrained. The robust identification of volatility-based triggers (rather than just levels) has implications for both policy (e.g., liquidity provision) and risk management (e.g., stress testing, early warning systems).
The methodological framework—combining high-frequency nowcasting, interpretable ML, and robust causal inference—sets a new standard for empirical macro-finance research. The explicit demonstration of model specification sensitivity is particularly important for practitioners and policymakers relying on causal claims.
Future Directions
Potential extensions include:
- Symmetric analysis for market peaks, which may require different features and mechanisms.
- Application to longer historical periods, including the 2008 GFC, contingent on data availability.
- Methodological advances such as conditional APE estimation and integration with physics-informed ML or deep reinforcement learning for dynamic causal discovery.
Conclusion
This study demonstrates that robust, interpretable, and causally credible prediction of market troughs is feasible using a combination of advanced feature engineering, high-performance ML, and modern causal inference. The key insight is that the triggers for market capitulation are rooted in the volatility and instability of risk appetite and liquidity, not merely their levels. The comparative DML analysis reveals that credible causal inference in high-dimensional, nonlinear settings requires flexible, interaction-aware models. The framework and findings have direct implications for both financial market participants and policymakers seeking to understand and mitigate systemic risk.