- The paper introduces the Effective Chart Dataset (ECD) with over 10,000 chart images and 321,544 QA pairs to enhance MLLM chart interpretation.
- The methodology employs a modular five-step synthesis pipeline to increase data diversity, visual complexity, and semantic coherence.
- Experiments reveal that models fine-tuned with ECD outperform previous datasets on benchmarks, validating its effectiveness in chart understanding.
Summary of "Effective Training Data Synthesis for Improving MLLM Chart Understanding"
This paper presents a novel methodology to enhance chart understanding in multimodal LLMs (MLLMs) through effective training data synthesis. The authors introduce the Effective Chart Dataset (ECD), a high-quality synthetic dataset designed to bridge the gap between synthetic and real-world chart understanding.
Introduction and Motivation
Chart understanding is crucial for building effective AI agents capable of interpreting scientific data. Current MLLMs, while proficient in text-based tasks, struggle with chart understanding, exhibiting low success rates on complex benchmarks. This challenge is exacerbated by the limitations of existing synthetic datasets, which often lack the fidelity and diversity of real-world charts.
The ECD is designed to address these shortcomings using a five-step data synthesis pipeline that focuses on improving data quality and diversity. This pipeline modularizes chart generation processes and introduces visual diversity in the generated datasets, setting a new standard for chart training sets.
Data Synthesis Pipeline
Single Plot Generation
The process begins with generating single plots using pre-defined themes and chart functions in Python. GPT-4o is tasked with producing data and textual elements like titles and labels, ensuring a rich distribution of data while maintaining semantic coherence.
Combined Subplots Generation
A conditional generation strategy is used for creating multi-subplot charts. Each subplot generation is conditioned on prior subplots to maintain thematic and semantic coherence, akin to human-designed scientific figures.
Chart Image Diversification
To overcome stylistic limitations, the charts undergo a diversification process which modifies visual elements like annotations, color schemes, and layout adjustments. This step ensures that the charts exhibit higher visual complexity and variation.
Filtering Low-quality Charts
Charts are evaluated based on visual clarity and semantic coherence using specialized GPT-4o prompts. This filtering step ensures that only high-quality chart images, which meet or exceed average quality standards, are included in the final dataset.
QA Pairs Generation
Finally, GPT-4o generates descriptive and reasoning-based question-answer pairs for the charts. The QA pairs are rigorously filtered to ensure high confidence and accuracy, maintaining the dataset's integrity as a training resource.
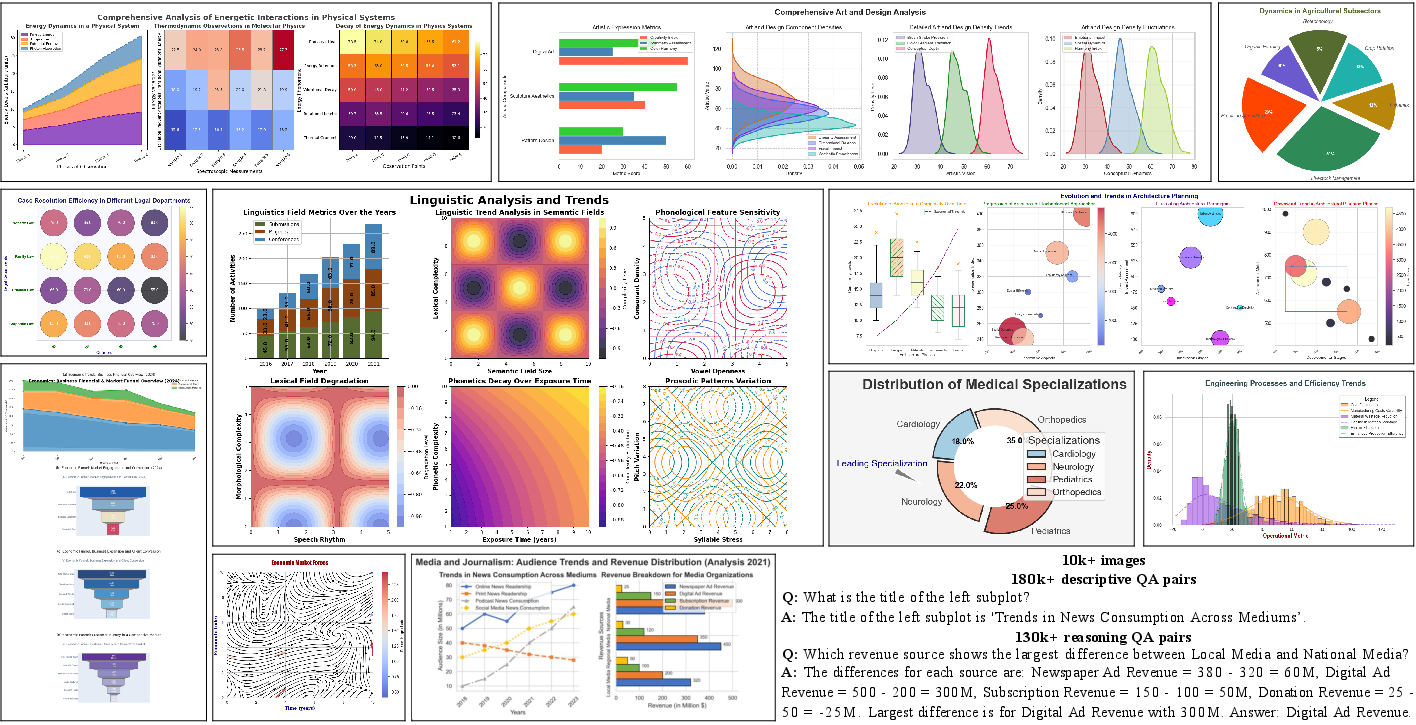
Figure 1: Overview of the effective chart dataset (ECD). It includes a diverse range of chart images and QA pairs.
Effective Chart Dataset (ECD)
ECD includes over 10,000 chart images and 321,544 QA pairs spanning 29 chart types and 252 subplot combinations. It significantly outperforms existing datasets in terms of visual diversity and complexity, as evidenced by its superior performance on benchmarks like CharXiv and others.
Experiments and Results
The ECD was tested on several benchmarks, and models fine-tuned with ECD consistently outperformed those fine-tuned with other datasets. Improvements were observed across various metrics, highlighting the effectiveness of ECD in enhancing chart understanding capabilities in MLLMs.
Comparison with Other Datasets
Comparisons against other chart datasets demonstrated ECD's superior ability to enhance model performance across multiple test sets, indicating its potential as a standard resource for training MLLMs on chart understanding tasks.
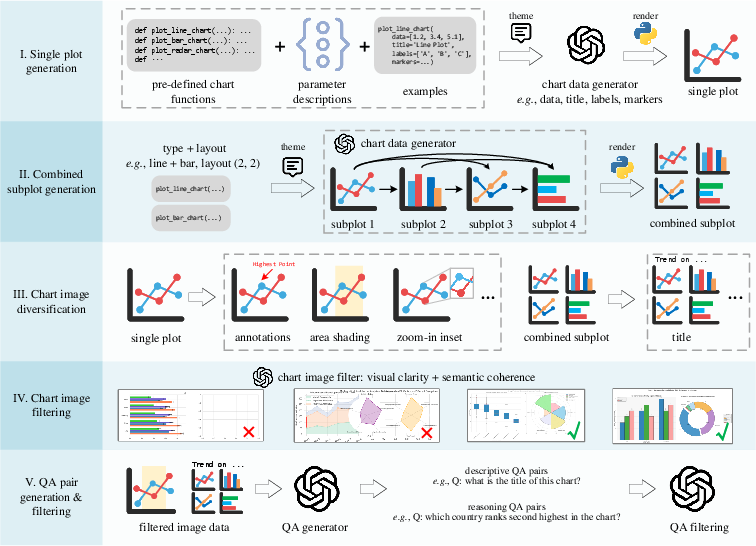
Figure 2: Our chart generation pipeline consists of five key steps.
Ablation Studies
Ablation studies confirmed the importance of diverse chart types and themes, and the inclusion of both descriptive and reasoning QA pairs in improving model performance. The chart types, themes, and QA diversification strategies were critical to achieving superior results.
Conclusion
The paper introduces and validates ECD, demonstrating its efficacy in improving chart understanding for MLLMs. By addressing the limitations of existing training data through this novel synthesis approach, the authors make a significant contribution to the field of AI-driven chart comprehension. Future work may explore further expansions of ECD and application-specific fine-tuning to unlock even greater potential in chart understanding AI models.

