- The paper introduces a novel stage-by-stage synthetic dataset for figure QA pre-training using error-free Python rendering and LLM-generated QA pairs.
- The paper leverages a systematic methodology with structured JSON data generation, rendering, and direct QA pair extraction to ensure diverse, accurate figures.
- The paper demonstrates that pre-training on SBS Figures boosts visual reasoning in models like Donut and Pix2Struct, improving real-world chart interpretation.
Introduction
The paper "SBS Figures: Pre-training Figure QA from Stage-by-Stage Synthesized Images" presents a novel approach to constructing large-scale datasets for figure question answering (QA) using a synthetic methodology. The primary contribution is the introduction of a pipeline capable of generating chart figures with comprehensive visual annotations and dense QA annotations efficiently. This method circumvents common issues related to code errors and repetitive figures that occur in other LLM-based synthesis techniques, by adopting a structured stage-by-stage approach.
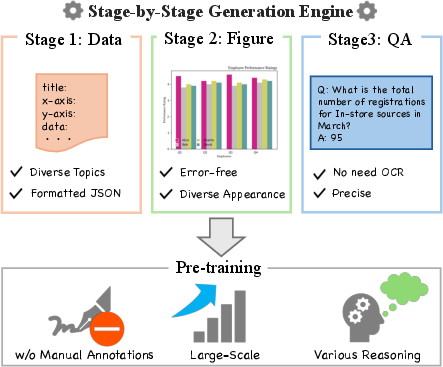
Figure 1: SBS Figures~(Stage-by-Stage Synthetic Figures). We create SBS Figures, a dataset for pre-training figure QA. Our stage-by-stage synthetic dataset creation enables a strong pre-training effect for real-world chart data.
Dataset Creation Process
The SBS Figures dataset is constructed through a systematic process that divides figure generation into distinct stages: visualization target data generation, figure rendering using Python scripts, and QA pair generation.
- Visualization Data Generation: The initial step involves generating JSON data representing complete numbers, text, and colors for various chart types. This structured data serves as the foundation for visual representation and ensures diverse figures across random topics.
- Figure Rendering: The figures are rendered using pre-defined Python scripts, which meticulously avoid code errors by leveraging a consistent data structure. This stage ensures that the visual appearance of figures varies greatly by randomizing elements such as fonts, titles, and legends.
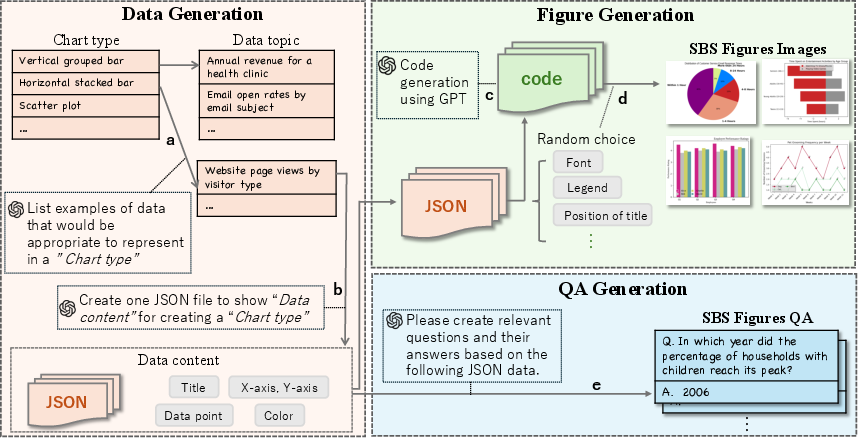
Figure 2: Generation pipeline of SBS Figures. SBS Figures was created using a fully synthetic method. First, we generate the visualization data, represented in JSON format, containing complete numbers, text, and colors. Next, we produce figure images from this data using pre-defined, error-free Python scripts. Finally, we generate dense and accurate QA pairs from visualization data without the need for OCR.
- QA Pair Generation: This stage employs LLMs to produce dense and accurate QA pairs directly from the visualized data. This method bypasses traditional OCR processes, thus eliminating errors associated with text extraction from images.
The robust pipeline not only automates figure generation but also ensures that the figures cover a wide range of topics without copyright concerns, leveraging the capabilities of LLMs such as GPT-3.5-turbo.
Evaluation and Results
The SBS Figures dataset was evaluated by pre-training models on synthetic data followed by fine-tuning with real-world chart data. The evaluation showed substantial improvements over existing methods:
Key Insights and Future Directions
The research discusses crucial factors that influence the effectiveness of figure QA pre-training. It concludes that diversity in figure appearance, quality and variety in QA pairs, and the number of pre-training images are significant contributors to model performance. The findings encourage further exploration into increasing dataset size and optimizing pre-training parameters.
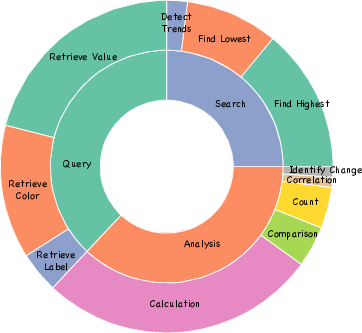
Figure 4: QA distribution of SBS Figures. We randomly selected 100 QAs and manually analyzed their QA types.
Looking forward, the availability of SBS Figures as a public resource is expected to significantly aid subsequent research in the domain of visual data comprehension and reasoning. It also poses the potential for developing stronger models capable of sophisticated visual understanding tasks beyond traditional datasets.
Conclusion
The paper successfully introduces a synthetic pre-training dataset that demonstrates practical advancements in figure QA tasks. By minimizing manual effort and maximizing data diversity through a systematic stage-by-stage generation process, SBS Figures establishes a new path for developing models adept at interpreting complex visual data, promoting efficient learning from synthetic datasets.