- The paper demonstrates that blockchain metrics derived from Bitcoin data provide statistically significant trading signals, especially for long positions.
- The methodology leverages moving averages and nonlinear coefficients to construct blockchain ribbons as reliable buy and sell indicators.
- Predictive models using Random Forest and LSTM reveal that preprocessing blockchain metrics reduces forecasting errors and boosts trade performance.
Blockchain Metrics and Indicators in Cryptocurrency Trading
This essay provides a detailed analysis of the research presented in the paper titled "Blockchain Metrics and Indicators in Cryptocurrency Trading" (2403.00770), which introduces blockchain-based metrics as indicators for cryptocurrency trading. The paper suggests that such metrics, derived from blockchain data, can provide a statistical advantage in trading and highlights the effectiveness of these metrics in both algorithmic trading and predictive modeling.
Overview of Blockchain Metrics
The paper explores 21 datasets from the Bitcoin blockchain network, collectively termed blockchain metrics. These include data points such as the hash rate, mining difficulty, and cost per transaction. These metrics are smoothed using moving averages to create indicators known as blockchain ribbons. The concept extends existing indicators like the Hash Ribbon, providing a base for new financial indicators that offer buy and sell signals through the crossovers of moving averages.
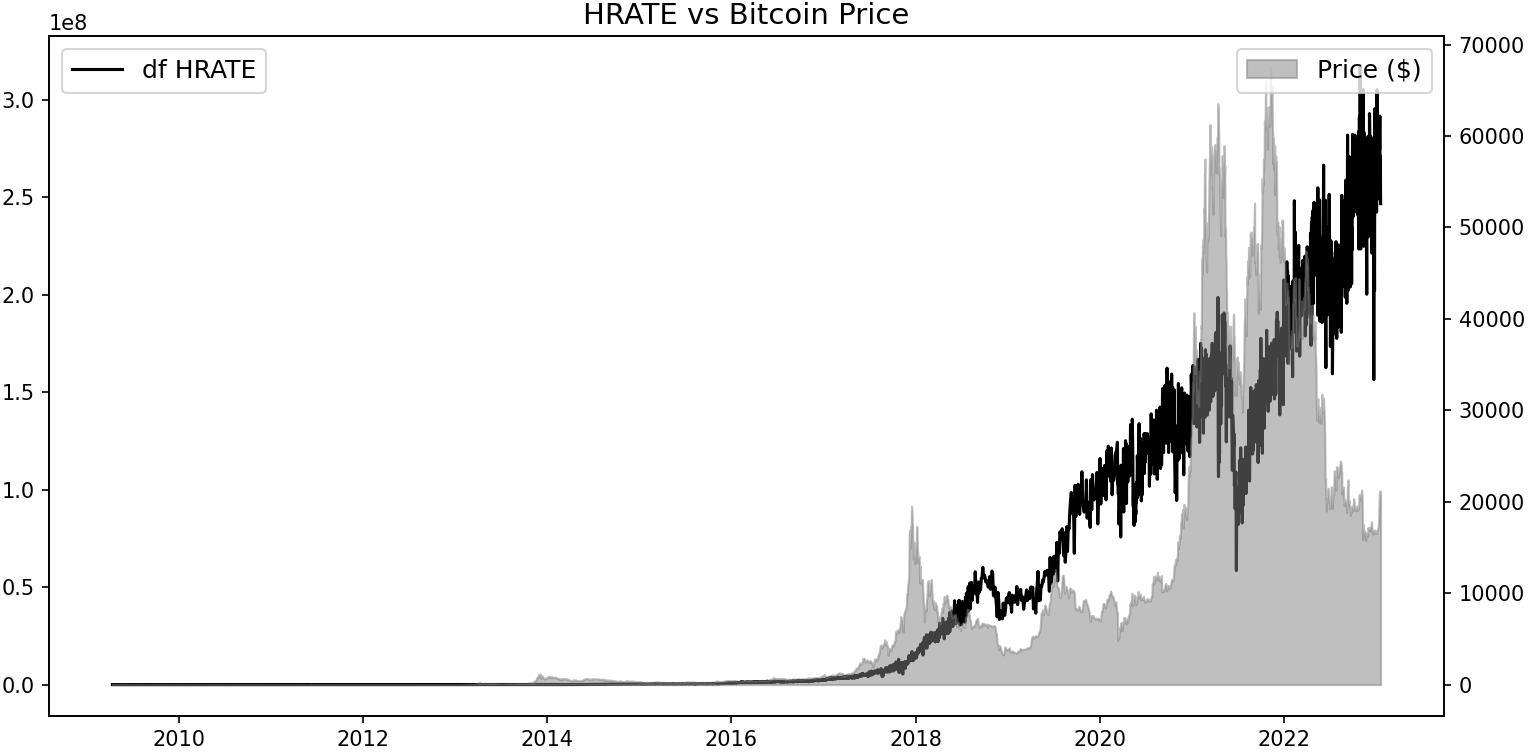
Figure 1: Hash rate vs Bitcoin price. The continuous line is the hash rate and the gray area represents the Bitcoin price, see insets.
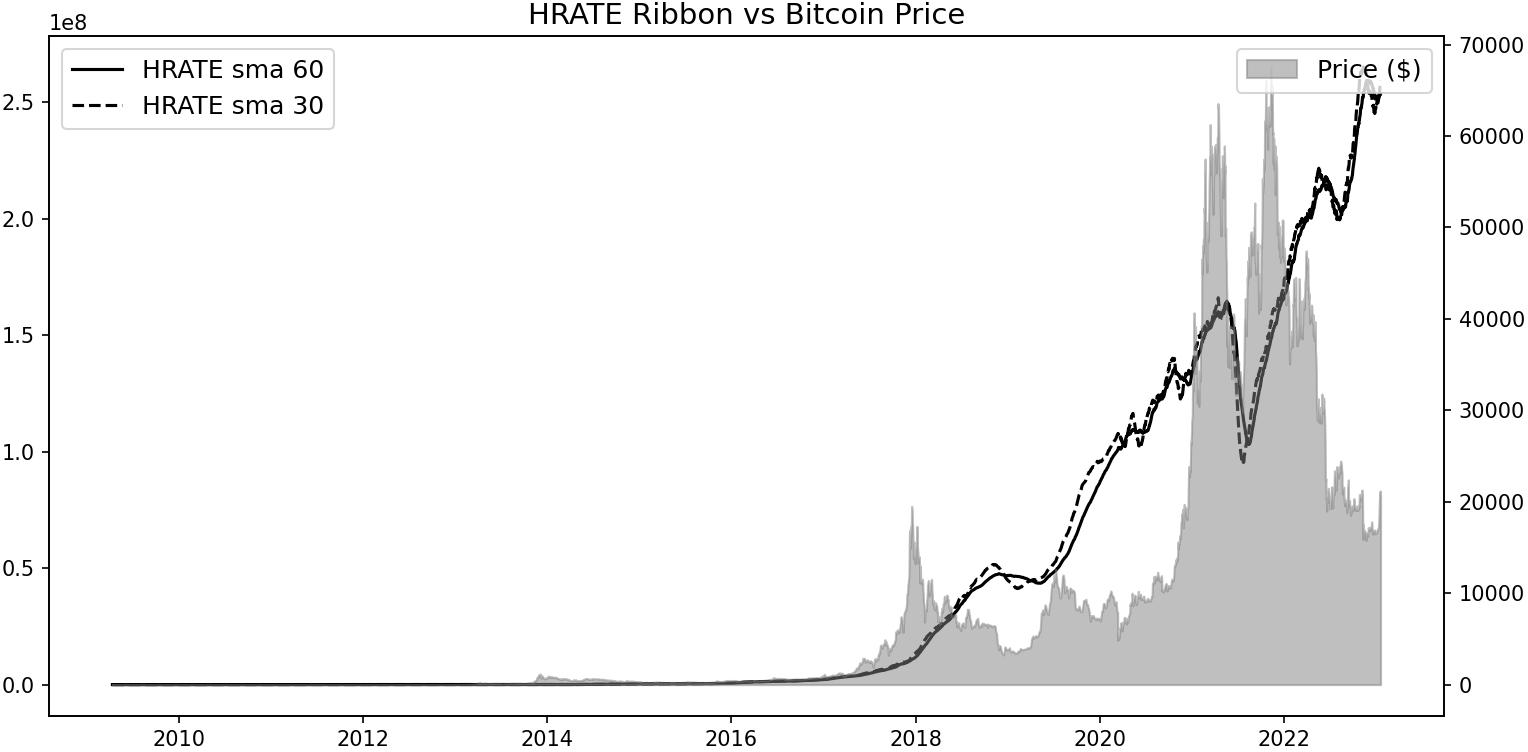
Figure 2: Hash ribbon vs Bitcoin price. The long ribbon line (SMA-60) is the continuous one, and the short ribbon line (SMA-30) is the dotted one, see insets.
Methodology
The methodology employs nonlinear coefficients of functional dependency and moving averages to derive meaningful insights from the blockchain metrics. These insights are then used to identify long and short signals in trading. The methods involve creating blockchain ribbons and evaluating their performance in algorithmic trading.
After calculating the ribbons, two numerical experiments were conducted: trading utilizing blockchain ribbons for long and short signals, and predictive modeling using Random Forest and LSTM networks. The trading simulations show that using blockchain metrics increases profitability in long trading positions, while the predictive models highlight the power of these metrics in anticipating bitcoin price movements.
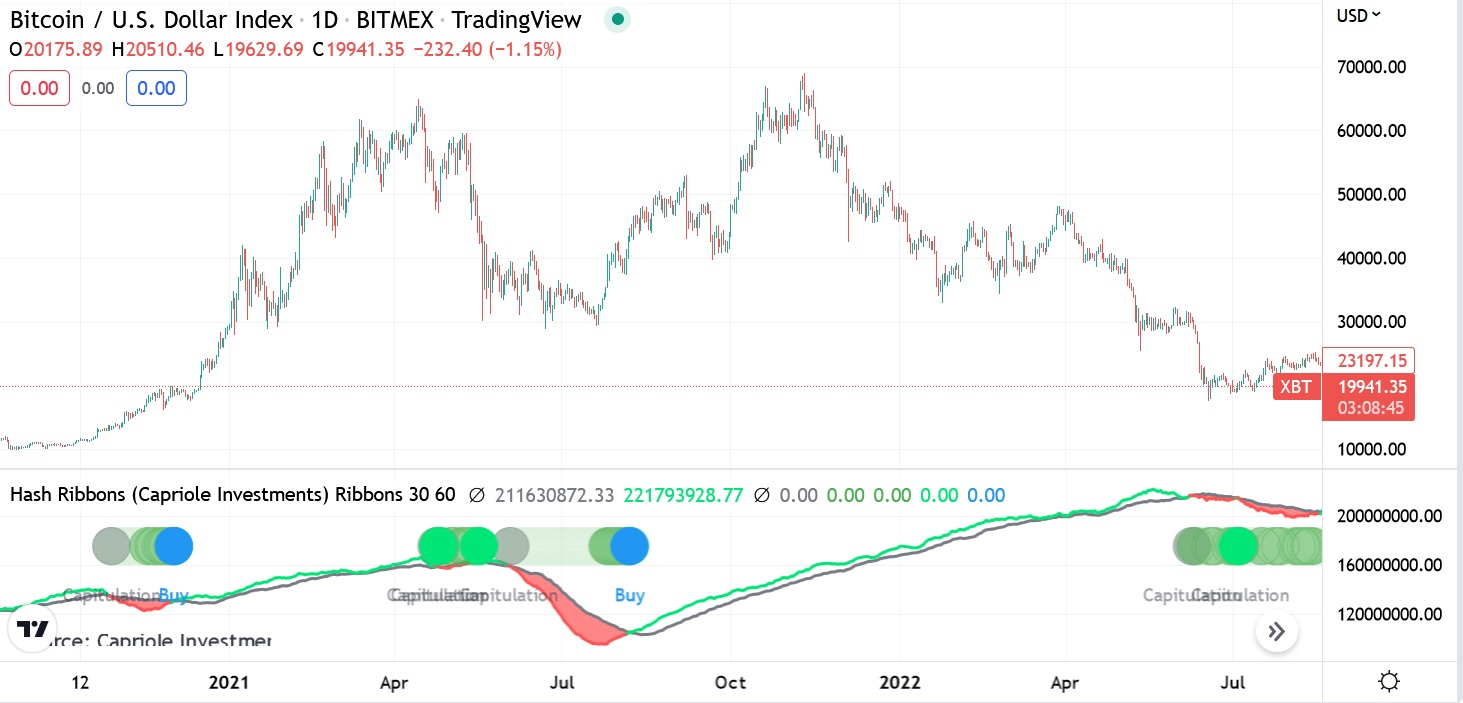
Figure 3: Actual visualization of the hash ribbon.
Analysis of blockchain ribbons demonstrated that they offer a statistical edge when making trading decisions, particularly for long positions. The results indicated that metrics such as DIFF, MKTCP, and NADDU, among others, performed well in trading simulations despite their nonlinear correlation with the Bitcoin price.
Consequently, the adjusted metrics—particularly the Adjusted CPTRA (AdCPTRA)—were highlighted for improved performance in short signals. The adjustment involved computing linear regressions of monotonic maxima and integrating them into trading strategies that resulted in better performance compared to the original CPTRA metric.
Predictive Models
The predictive potential of blockchain metrics was explored using test models, Random Forest and LSTM. Preprocessing the blockchain metrics into percentages improved model performance, with LSTM showing the most promise by achieving the lowest Mean Absolute Scaled Error (MASE) during testing. This indicates blockchain metrics' effectiveness as predictors when utilized in well-structured LSTM networks, particularly when preprocessed into mathematical textures.
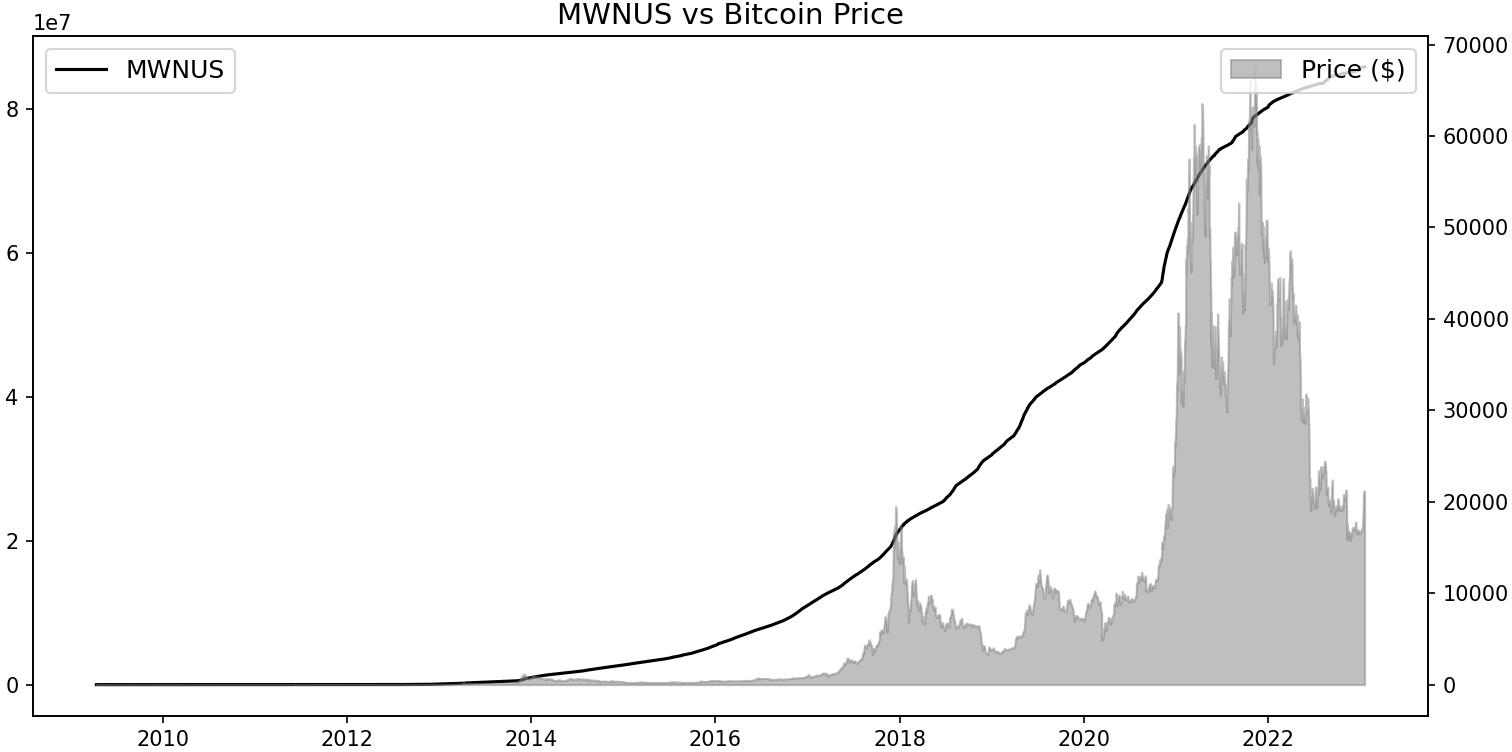
Figure 4: Bitcoin My Wallet Number of Users vs Bitcoin Price.
Challenges and Limitations
Despite the positive results for long positions, short trading signals showed inconsistent performance across the metrics. These challenges emphasize the need for diversified strategies that combine blockchain metrics with other financial indicators to fully leverage the data's potential.
Moreover, while the blockchain metrics provided a performance edge, potential overfitting issues were noticed, particularly with Random Forest models on raw data. Improved results were obtained when deploying simplified mathematical versions of the inputs, revealing the necessity of appropriate data preprocessing prior to model integration.
Conclusion
The paper concludes that blockchain metrics are not only viable as trading indicators but also crucial for predictive modeling in cryptocurrency markets. The significant findings demonstrate the added value of blockchain data derived from network activity over traditional financial indicators. Future research is expected to further refine these metrics and expand their applicability across different cryptocurrencies and trading environments.
The study advocates for combining blockchain metrics with existing technical analysis tools to create more robust trading strategies. Emerging machine learning techniques may further enhance these strategies by efficiently assimilating diverse and complex datasets typical of the cryptocurrency market.
In summary, the exploration and application of blockchain metrics contribute significantly to both practical trading strategies and theoretical advancements in understanding the dynamics of cryptocurrency markets.

