- The paper introduces a machine learning-based xG model that adjusts for player and position, achieving a 0.902 correlation with benchmark data.
- The methodology employs logistic regression and gradient boosting techniques while integrating features such as goalkeeper positioning and player pressure radiuses.
- The model's results demonstrate enhanced predictive accuracy with practical implications for player performance analysis, recruitment, and betting strategies.
Introduction
The paper presents a comprehensive study on the application of machine learning techniques to develop a model for Expected Goals (xG) in football, focusing on player-specific and position-specific adjustments. Given the inherent value of acquiring additional parameters beyond goal conversion to evaluate player performance, the xG metric offers probabilistic insights into shot success likelihood, spanning from 0 to 1. This metric catalyzes a nuanced understanding of player contributions beyond observable goal-scoring, particularly in a low-scoring sport like football.
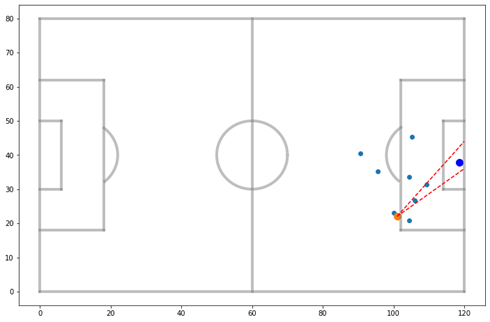
Figure 1: A freeze frame example: shot location (distance and angle).
Academic Look to the xG Metric
The development of the xG metric has seen significant involvement from both academic and industry experts. The metric is relatively novel, with widespread usage in professional football largely catalyzed by analyst-driven insights [Tippett, James (2019)].
Herold et al. discuss the necessity of incorporating context such as opponent positioning within xG models [Herold et al., 2019]. Lucey et al.'s work on spatio-temporal analysis provides foundational methodologies for understanding the build-up to shot attempts and evaluating the quality of shots based on defender proximity [Lucey et al., 2015].
Brechot and Flepp highlight xG's potential in objectively evaluating team performance [Brechot and Flepp, 2020], while Madrero Pardo explores qualitative player information for enhanced xG model performance [Madrero Pardo, 2020]. Such studies provide essential frameworks for managing inherent randomness and optimizing shot-related performance metrics.
The utilization of xG metrics in the football industry extends across performance analytics, player recruitment, and betting strategies. The metric offers performance analysts objective evaluations of player and team actions.
Possession, traditionally seen as team dominance, finds context when juxtaposed with comprehensive xG data evaluating the actual scoring potential. Recruitment strategies already benefit from xG evaluations, enabling clubs to identify undervalued players with high expected goal contributions [Tippett, 2019].
Betting companies leverage xG metrics in predictive modeling to refine odds based on team defensive performance insights, thereby attaining strategic advantages.
The Proposed xG Model Details and Results
The study undertakes to design a machine learning-based xG model aimed at facilitating open-play goal prediction. A logistic regression model serves as a baseline, characterized by a correlation of 0.659 with StatsBomb data. Following model refinement via additional features such as Goalkeeper positioning and Player Pressure Radiuses, the improved logistic model demonstrates a correlation of 0.887 with StatsBomb xG and accumulates a total xG of 1866 against actual goals of 1887.
The resultant proposed model employs Gradient Boosting techniques, achieving a correlation of 0.902 with the benchmark data, signifying enhanced prediction fidelity compared to baseline logistic regression.
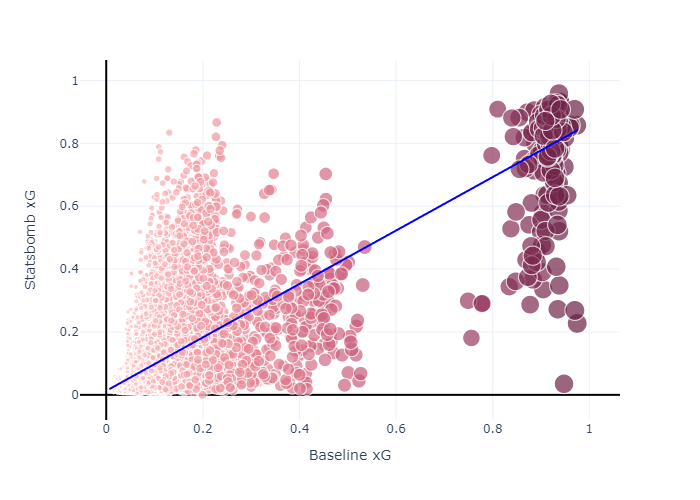
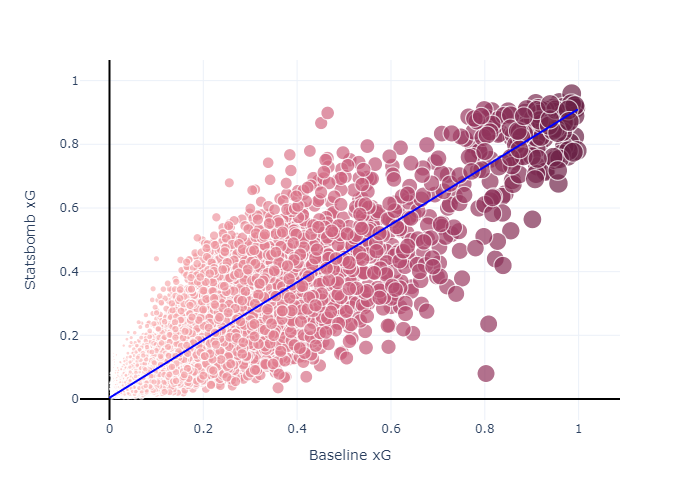
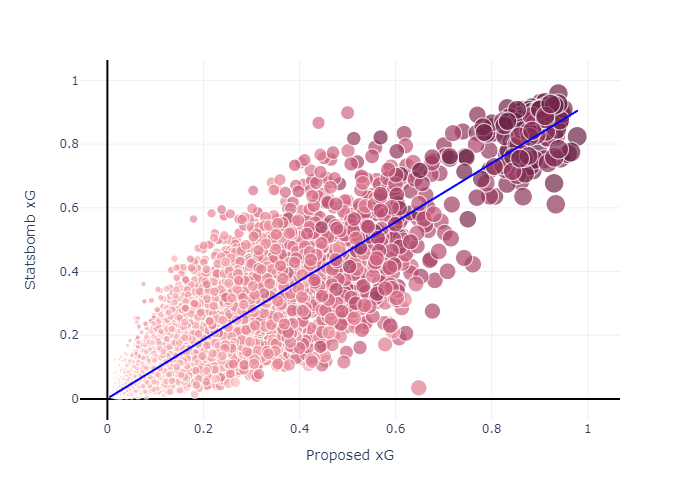
Figure 2: (a) Baseline model results with existing 26 features. (b) Baseline model performance after adding extra features. (c) Proposed xG model performance.
Results
Position Adjusted xG
Analysis of position-related xG showcases forwards as most efficient in xG accrual, with an impressive 86-point adjustment when their skill set is universally applied across sample data.
Figures illustrate shot density, indicating higher conversion probabilities for shots within the box, a pattern consistent with forward positions.
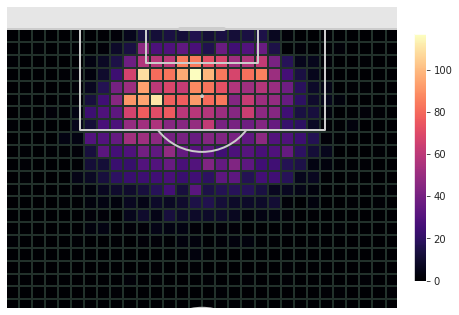
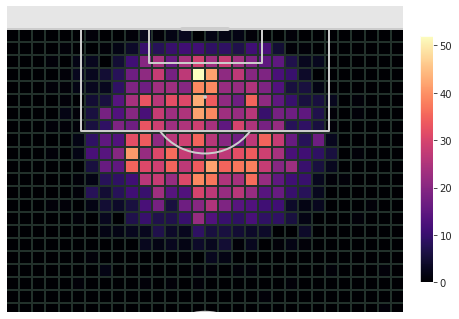
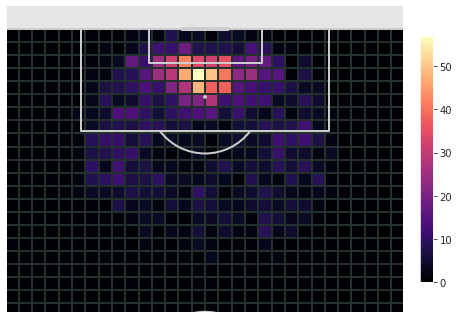
Figure 3: Shot Density of (a) Forwards, (b) Midfielders, (c) Defenders.
Player Adjusted xG Values
Lionel Messi’s subset results reveal a 347 xG enhancement, reinforcing the hypothesis of superior performance over average players.
Player-specific adjustments depict Messi as significantly over-performing traditional xG values, making him a quintessential player for predictive modeling.
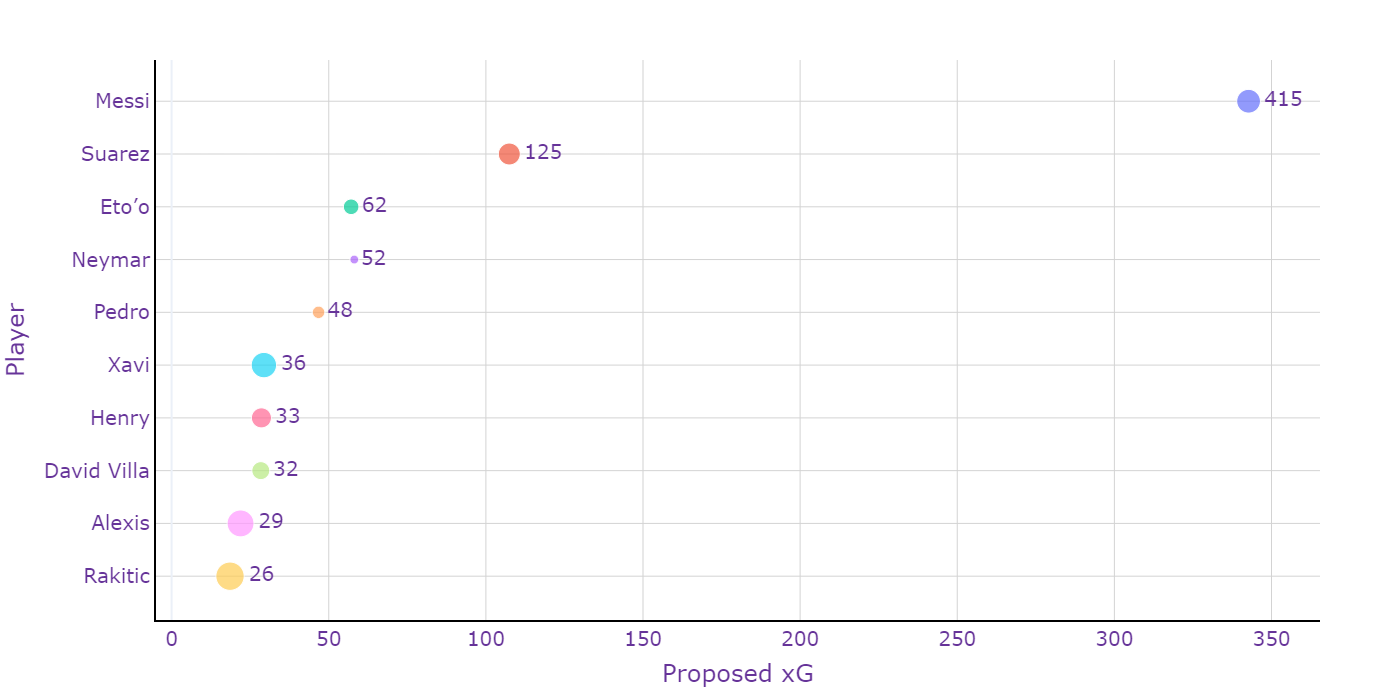
Figure 4: Player specific xG and Goals analysis. The size of the markers shows Goals per xG metric whilst the text next to each marker is the exact number of goals scored by the player.
Industry Benchmark Testing and Application
Applying the proposed model to a distinct match, Real Madrid vs. Liverpool 2017/18 UEFA Champions League final, revealed congruence with existing industry benchmarks. A pivotal comparison between StatsBomb xG and proposed model outputs demonstrates satisfactory results aligning within industry-standard expectations.
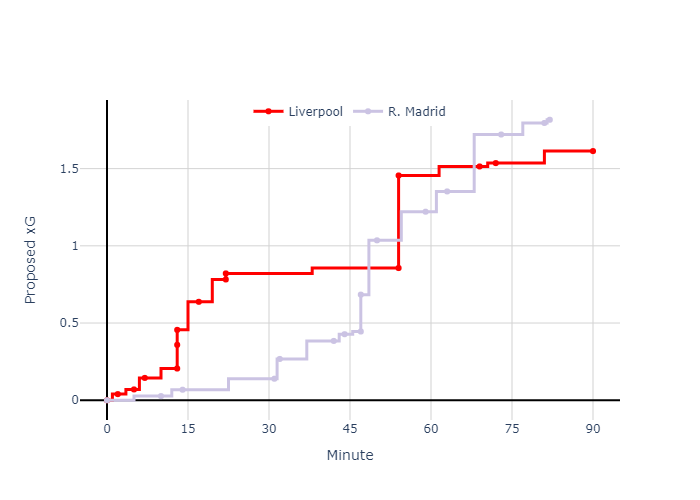
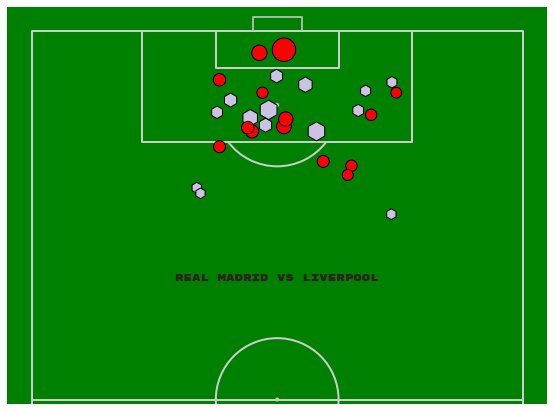
Figure 5: 2018 Real Madrid vs Liverpool, Champions League final (TOP) xG timeline, (BOTTOM) xG location map.
Conclusions
This study successfully develops a machine learning-based xG model with player and position adjustments, offering substantial granularity in metrics beyond conventional scores. The insights derived affirm positional efficiencies, with Forward, Midfield, and Defense distinctly evaluated.
Models leveraging features such as Goalkeeper positioning, among others, deliver profound advances in xG model fidelity. With applications extending to academic settings and professional football, this work not only addresses existing gaps but sets precedence for future research directed towards league-specific adjustments and intra-league comparative analyses.