- The paper introduces DashBot, leveraging deep reinforcement learning to automatically generate dashboards through optimized visualization mappings.
- It employs a Bi-LSTM network and an A3C-based framework to capture sequential dependencies and ensure design compliance via constrained sampling.
- Evaluation results show improved insightfulness and visual clarity over baselines, highlighting its potential to enhance dashboard authoring tools.
DashBot: Insight-Driven Dashboard Generation Based on Deep Reinforcement Learning
This essay provides a detailed analysis of the paper "DashBot: Insight-Driven Dashboard Generation Based on Deep Reinforcement Learning" (2208.01232). The paper introduces DashBot, an innovative system designed to leverage deep reinforcement learning for the automatic generation of insightful analytical dashboards by recommending visualization mappings.
Introduction to DashBot and Analytical Dashboard Generation
Dashboards are critical in business intelligence for exploring and presenting multifaceted data insights but generating effective dashboards is challenging. Existing approaches to visualization recommendation often emphasize single-view optimization and rule-based methods, which do not fully capture the nuances of multiple-view visualizations (MVs). DashBot proposes a method using deep reinforcement learning to address these limitations by creating dashboards that automatically discover insights while adhering to established visualization practices.
DashBot models the process of dashboard creation as a Markov Decision Process (MDP), where the task is to optimize sequences of actions (e.g., adding charts, selecting columns) to maximize cumulative reward, defined by the utility of the resulting dashboard. It innovatively applies constraints during the sampling processes in reinforcement learning to adhere to visualization principles.
System Overview and Design
Feature Extraction and System Architecture:
DashBot employs a neural network to predict actions and parameters, using features derived from both raw data columns and chart properties (Figure 1). The architecture accommodates the sequence-dependent nature of dashboard generation through a Bi-LSTM network, which effectively captures relationships across different chart configurations.
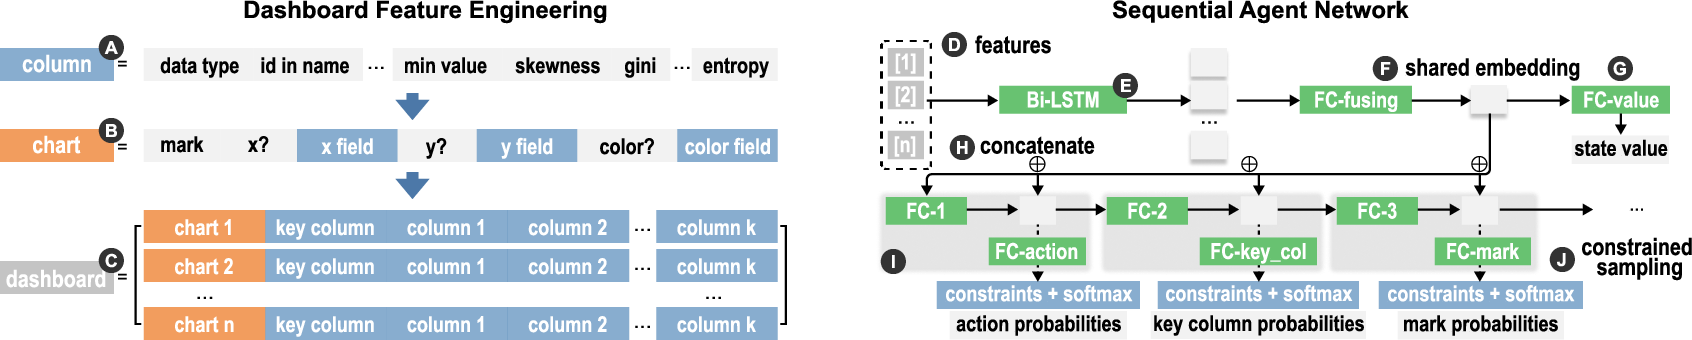
Figure 1: Process of feature construction and sequence generation using Bi-LSTM, integrated within DashBot’s neural network structure for action prediction.
Reinforcement Learning Framework:
The system applies the Asynchronous Advantage Actor-Critic (A3C) algorithm, suited for high-dimensional state and action spaces typical in visualization tasks. The framework facilitates robust training dynamics by enabling simultaneous learning across multiple agent instances (Figure 2).
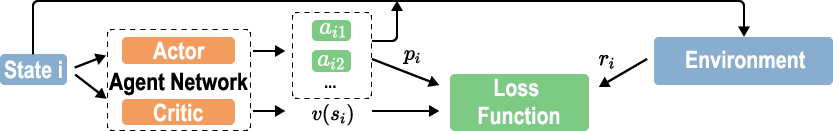
Figure 2: A3C-based reinforcement learning framework guides the optimization process for dashboard generation.
Constrained Sampling:
DashBot introduces a constrained sampling technique to ensure feasible visualization mappings. This mechanism employs visualization principles as constraints to guide the agent’s decisions, essentially integrating design knowledge directly into the learning process (Figure 3).
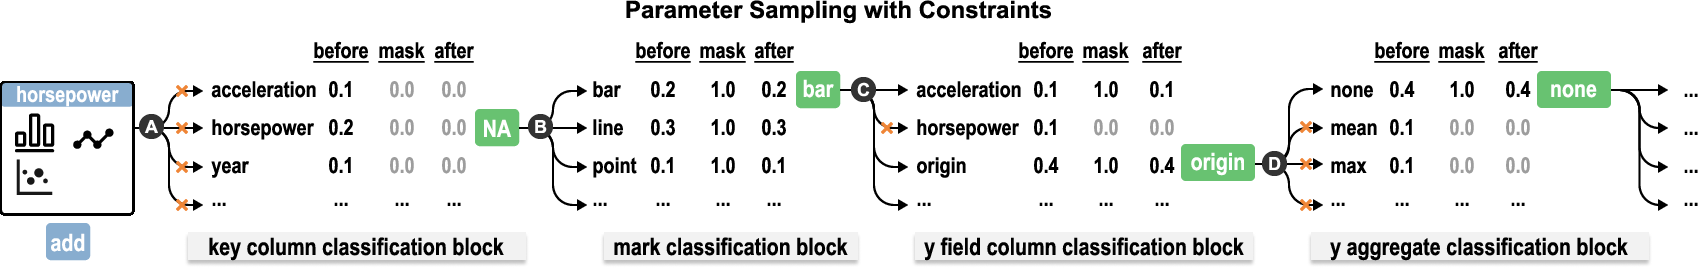
Figure 3: Constrained sampling mechanism, ensuring feasible parameter selections for chart creation.
Reward Mechanisms and Dashboard Generation
Effective dashboard generation in DashBot is driven by sophisticated reward functions, which quantify both presentation quality (diversity, parsimony) and data-driven insights (correlations, distributions). These metrics inform the agent's learning, dynamically adjusting to the visualization context to incentivize insightful, coherent dashboard designs.
Evaluation and Impact
Quantitative Analysis and User Studies:
DashBot demonstrated superior results in ablation studies and comparative user experiments against baselines, such as DQN and other non-sequence models (Figure 4). Participants rated DashBot higher for insightfulness and visual clarity, revealing its practical utility in real-world applications.
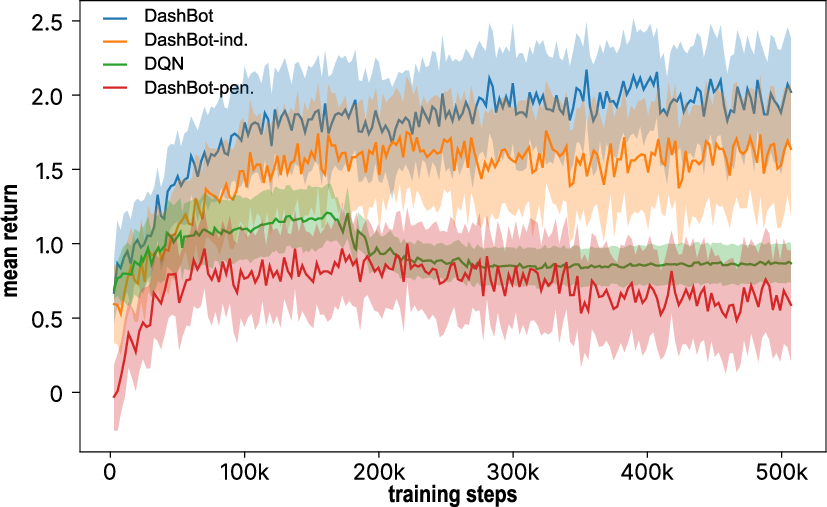
Figure 4: DashBot ablation study metrics showcasing improved mean returns compared to alternative implementations.
Potential Applications:
The approach is poised to enhance dashboard authoring tools, automating sophisticated visual narratives that integrate user preferences and rapid adjustments. Its framework can be refined with more extensive datasets, including large-scale semantic and domain-specific vectors for more nuanced insight detection.
Conclusion
DashBot exemplifies a novel intersection of deep reinforcement learning with visual analytics, providing a robust tool for automating dashboard creation. While promising, further exploration into larger datasets and more complex visualization tasks is needed to fully realize its potential in diverse applications. The paradigm shift towards learning-based visualization signifies a vital stride in reducing the cognitive load and expertise barriers traditionally associated with effective dashboard design.