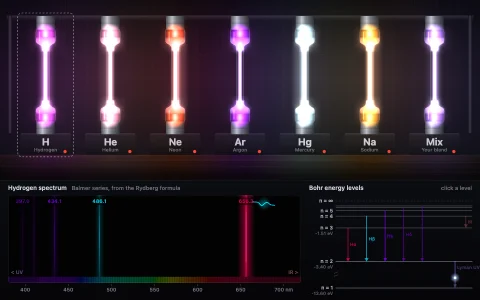
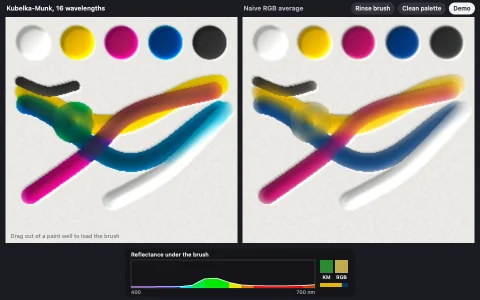
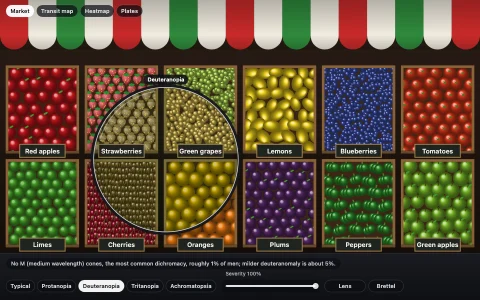
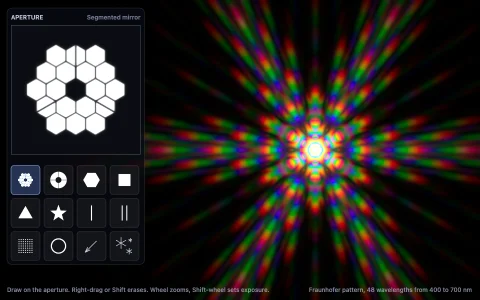
Draw any light's spectrum and watch it land on the CIE 1931 horseshoe.
Every spectrum is reduced to three numbers by the CIE 1931 color matching functions, generated in code from a multi-lobe Gaussian fit, and its chromaticity x and y lands somewhere on the horseshoe, which is colored per pixel. Around it are the sRGB, Display P3 and Rec. 2020 gamut triangles and the Planckian locus of blackbody light, with readouts of correlated color temperature, dominant wavelength and purity. The metamer tool builds spectra that look identical to yours from three LED peaks (a 3x3 linear solve), two monochromatic lines on a chord through the color, or by adding a metameric black the eye cannot see, and the tristimulus bars show why they match. Clicking the diagram runs the inverse: Newton's method fits a smooth spectrum to that chromaticity.
Try it. Drag on the spectrum to draw your own light. Click or drag inside the horseshoe to fit a smooth spectrum to that color, and hover it to check display gamuts. Use the chips (or 1 to 6) for daylight, tungsten, LED, fluorescent, laser and sodium light, and the Metamer chip (or M) to cycle three kinds of metamer. C toggles the matching function curves, Space draws a random spectrum.
Paste this into Claude Code, Codex or any coding agent to get a simple version running, then take it wherever you like.
Build an interactive CIE 1931 chromaticity diagram with JavaScript and the HTML canvas element, with a spectrum I can draw that shows where its color lands. Put everything in a single index.html file with no libraries or build step, so I can open it directly in a browser.

Start simple:
- Make a canvas that fills the window, stays sharp on high-DPI screens (scale by devicePixelRatio), with a dark background. Put the diagram on the left and a spectrum graph on the right.
- Write the CIE 1931 color matching functions with the Wyman, Sloan and Shirley multi-lobe Gaussian fit and sample them every 5 nm from 380 to 730. The fit drifts in the far tails, so check that the horseshoe's red end reaches about x = 0.73, y = 0.27.
- Draw the spectral locus: for each wavelength, x = X / (X + Y + Z) and y = Y / (X + Y + Z) of the matching functions, joined into a horseshoe and closed with the line of purples.
- Keep the spectrum as an array of 71 values. Let me drag on the graph to draw it, sum it against the matching functions to get X, Y and Z, and plot its chromaticity as a dot.

Once that works, make it beautiful:
- Fill the horseshoe pixel by pixel with ImageData: convert each x, y to XYZ, then to linear sRGB, desaturate out-of-gamut colors by adding white, scale the largest channel to 1 and gamma encode. Do this once and cache it.
- Draw the sRGB, Display P3 and Rec. 2020 gamut triangles and the Planckian locus of blackbody light, labelled in kelvin.
- Fill the area under the drawn spectrum with the color of each wavelength, and show a swatch of the resulting color.

Explain the color math in short code comments. When you're done, tell me how to open it and suggest three directions I could take it next, such as generating metamers (different spectra with the same color), computing correlated color temperature, or clicking the diagram to fit a smooth spectrum to that color.