Beyond Memorization: A Multi-Modal Ordinal Regression Benchmark to Expose Popularity Bias in Vision-Language Models
Abstract: We expose a significant popularity bias in state-of-the-art vision-LLMs (VLMs), which achieve up to 34% higher accuracy on famous buildings compared to ordinary ones, indicating a reliance on memorization over generalizable understanding. To systematically investigate this, we introduce the largest open benchmark for this task: the YearGuessr dataset, a collection of 55,546 building images with multi-modal attributes from 157 countries, annotated with continuous ordinal labels of their construction year (1001-2024), GPS data, and page-view counts as a proxy for popularity. Using this dataset, we frame the construction year prediction task as ordinal regression and introduce popularity-aware interval accuracy metrics to quantify this bias. Our resulting benchmark of 30+ models, including our YearCLIP model, confirms that VLMs excel on popular, memorized items but struggle significantly with unrecognized subjects, exposing a critical flaw in their reasoning capabilities. Project page: https://sytwu.github.io/BeyondMemo/
Paper Prompts
Sign up for free to create and run prompts on this paper using GPT-5.
Top Community Prompts
Explain it Like I'm 14
Overview: What this paper is about
This paper looks at how well AI models can guess the year a building was built just from a photo (and sometimes its location). The authors show that many powerful vision-LLMs (VLMs)—AIs that look at images and read text—do much better on famous buildings than on regular ones. That suggests these models are “memorizing” landmarks they’ve seen on the internet instead of truly understanding architecture.
To study this fairly, the authors built a huge, open dataset called YearGuessr (55,546 building images from 157 countries, from the years 1001 to 2024) and a new model called YearCLIP. They also created new tests to measure bias toward popularity.
Key questions the paper asks
- Can AI tell how old a building is from a photo?
- Are today’s AI models really learning architectural clues, or are they just recognizing famous buildings they’ve “seen” online before?
- How can we build a fair, worldwide test to measure this?
- Can we design a model that explains its guesses, not just gives a number?
How they did it (in simple terms)
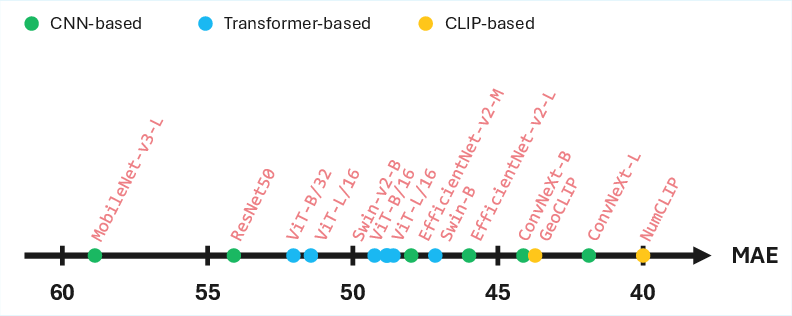
The authors created a global benchmark and a baseline model, then tested 30+ AI systems.
1) YearGuessr: the dataset
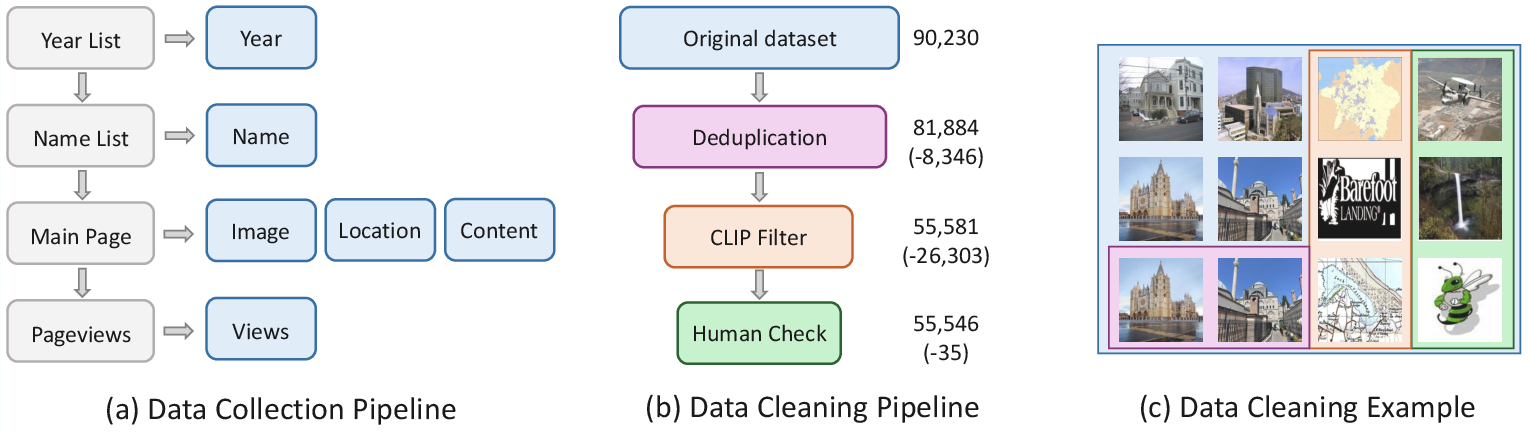
- What it is: 55,546 photos of building facades from Wikipedia/Wikimedia Commons.
- What it includes: the photo, the building’s construction year, GPS coordinates, a text description, and how many people viewed the Wikipedia page (a stand-in for “how famous it is”).
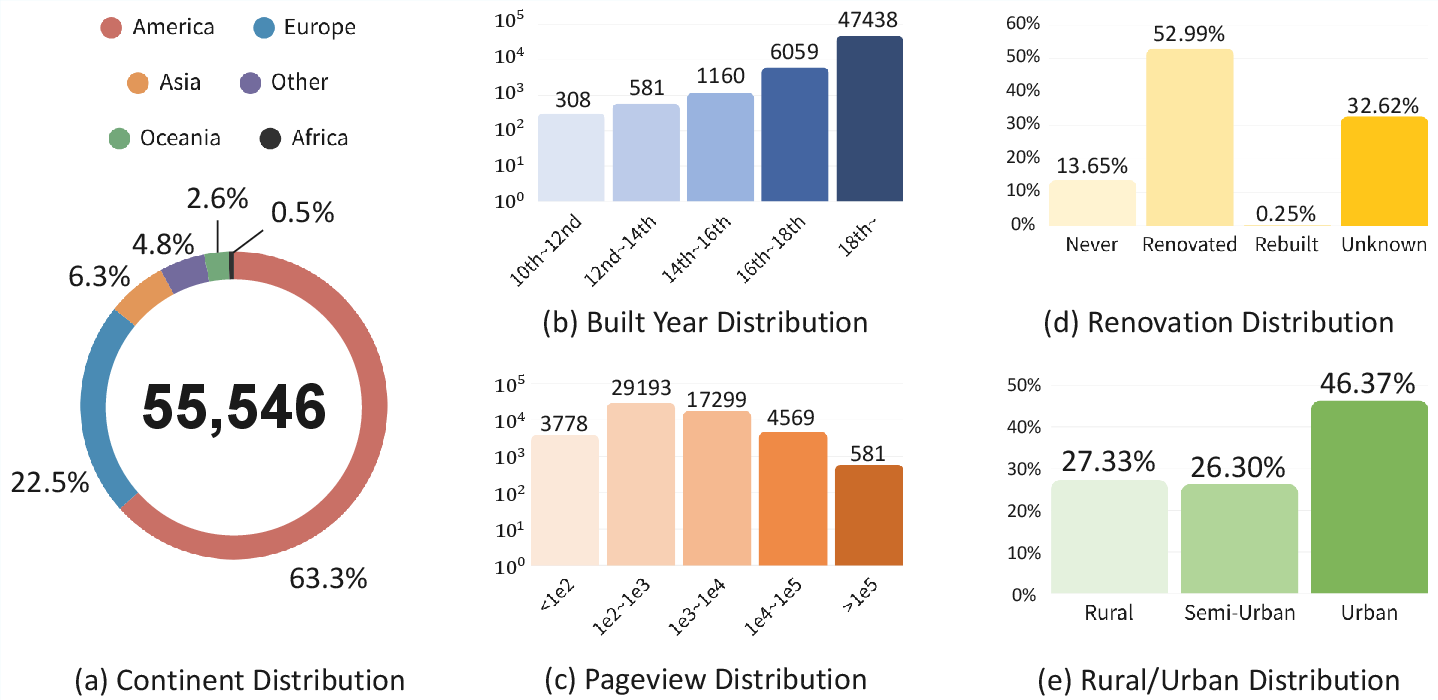
- Why it matters: It covers 157 countries and spans more than 1,000 years (1001–2024), and it’s openly licensed, so anyone can use it to test their models.
2) The task: predict the construction year
- The model sees a building photo (and sometimes GPS location) and tries to estimate the year it was built.
- They treat this as “ordinal regression.” Think of ordinal regression like guessing a place on a timeline: years have a natural order (1900 comes before 1950), so being off by 2 years is better than being off by 200.
3) How they measure accuracy
They use simple, understandable scores:
- Mean Absolute Error (MAE): On average, how many years is the guess off by?
- Interval Accuracy (IAk): What percent of guesses are within k years of the real year? They check within 5, 20, 50, and 100 years. For example, IA20 is like, “Did the model at least place it in the right era?”
- Popularity-aware scores: They compare results for low-view vs. high-view (famous) buildings to spot popularity bias.
4) YearCLIP: their model
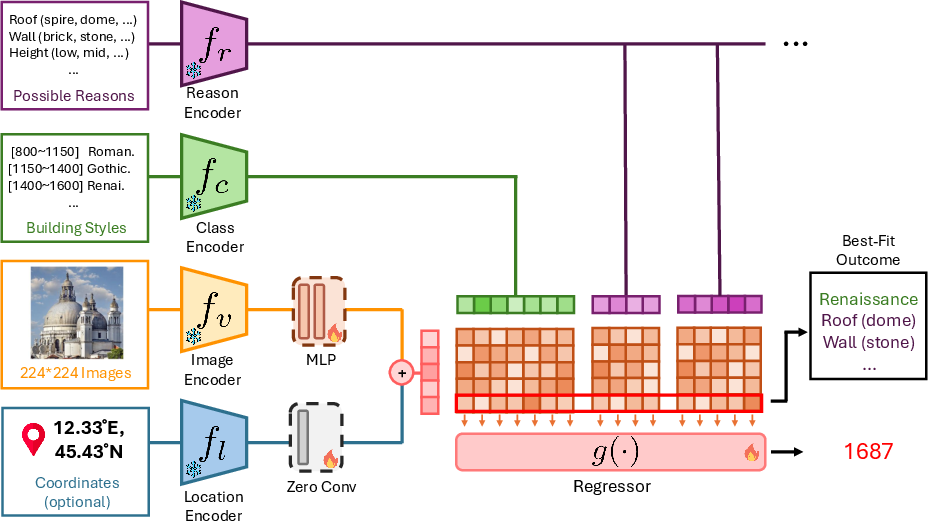
YearCLIP builds on CLIP, a model that learns to match images with text. The idea:
- Use the image like a “face of the building.”
- Optionally use GPS as a clue, like adding a map pin. The model learns how much to trust location automatically.
- Use “reasoning prompts” as helpful hints. These are short text cues like “brick walls,” “domed roof,” or “Gothic arches.” The model learns which visual features match which time periods and can explain its guess by pointing to these features.
- Guess in two steps: first a coarse era, then fine-tune the year (like narrowing down from “1800s” to “1885”).
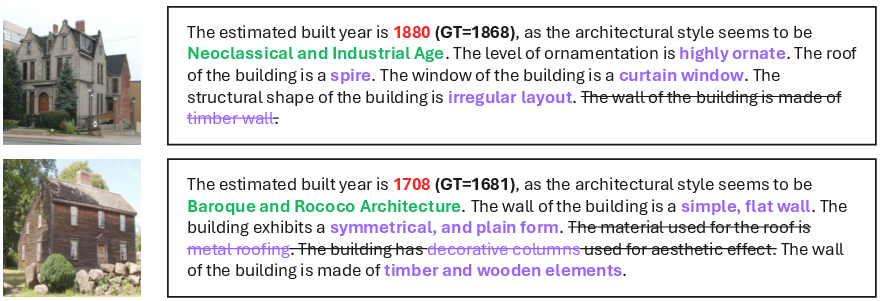
This setup aims to be more explainable: the model can say why it thinks a building is from a certain time.
Main findings and why they matter
Here are the most important results, with simple explanations:
- Big VLMs do great on famous buildings—but that’s a problem.
- Some top models (like Gemini 2.0) are far more accurate on buildings with many page views. For example, the accuracy within ±5 years jumped by up to 34 percentage points for famous buildings.
- That suggests they’re relying on memorization. The model likely “knows” the Eiffel Tower because it has seen it many times online, not because it’s using architectural clues that would work on unknown buildings.
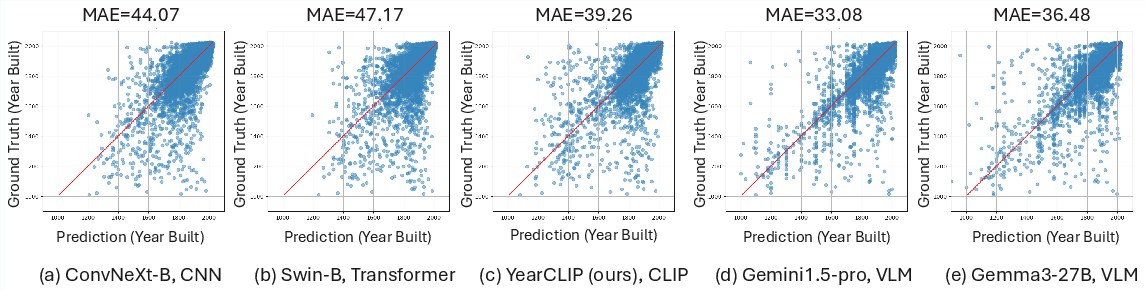
- Traditional vision models and CLIP-based models don’t benefit from popularity in the same way.
- For many non-VLM models, accuracy actually drops on famous buildings, likely because iconic sites are complex, renovated, or have mixed styles that are hard to date visually.
- This contrast helps prove the “popularity bias” in VLMs is real.
- YearCLIP improves accuracy and adds explanations.
- YearCLIP reduced the average error compared to several strong baselines and provides readable reasons for its predictions (for example, “brick Gothic arches suggest 19th century”).
- Using GPS helps, but the model also works without it.
- Time period and region matter a lot.
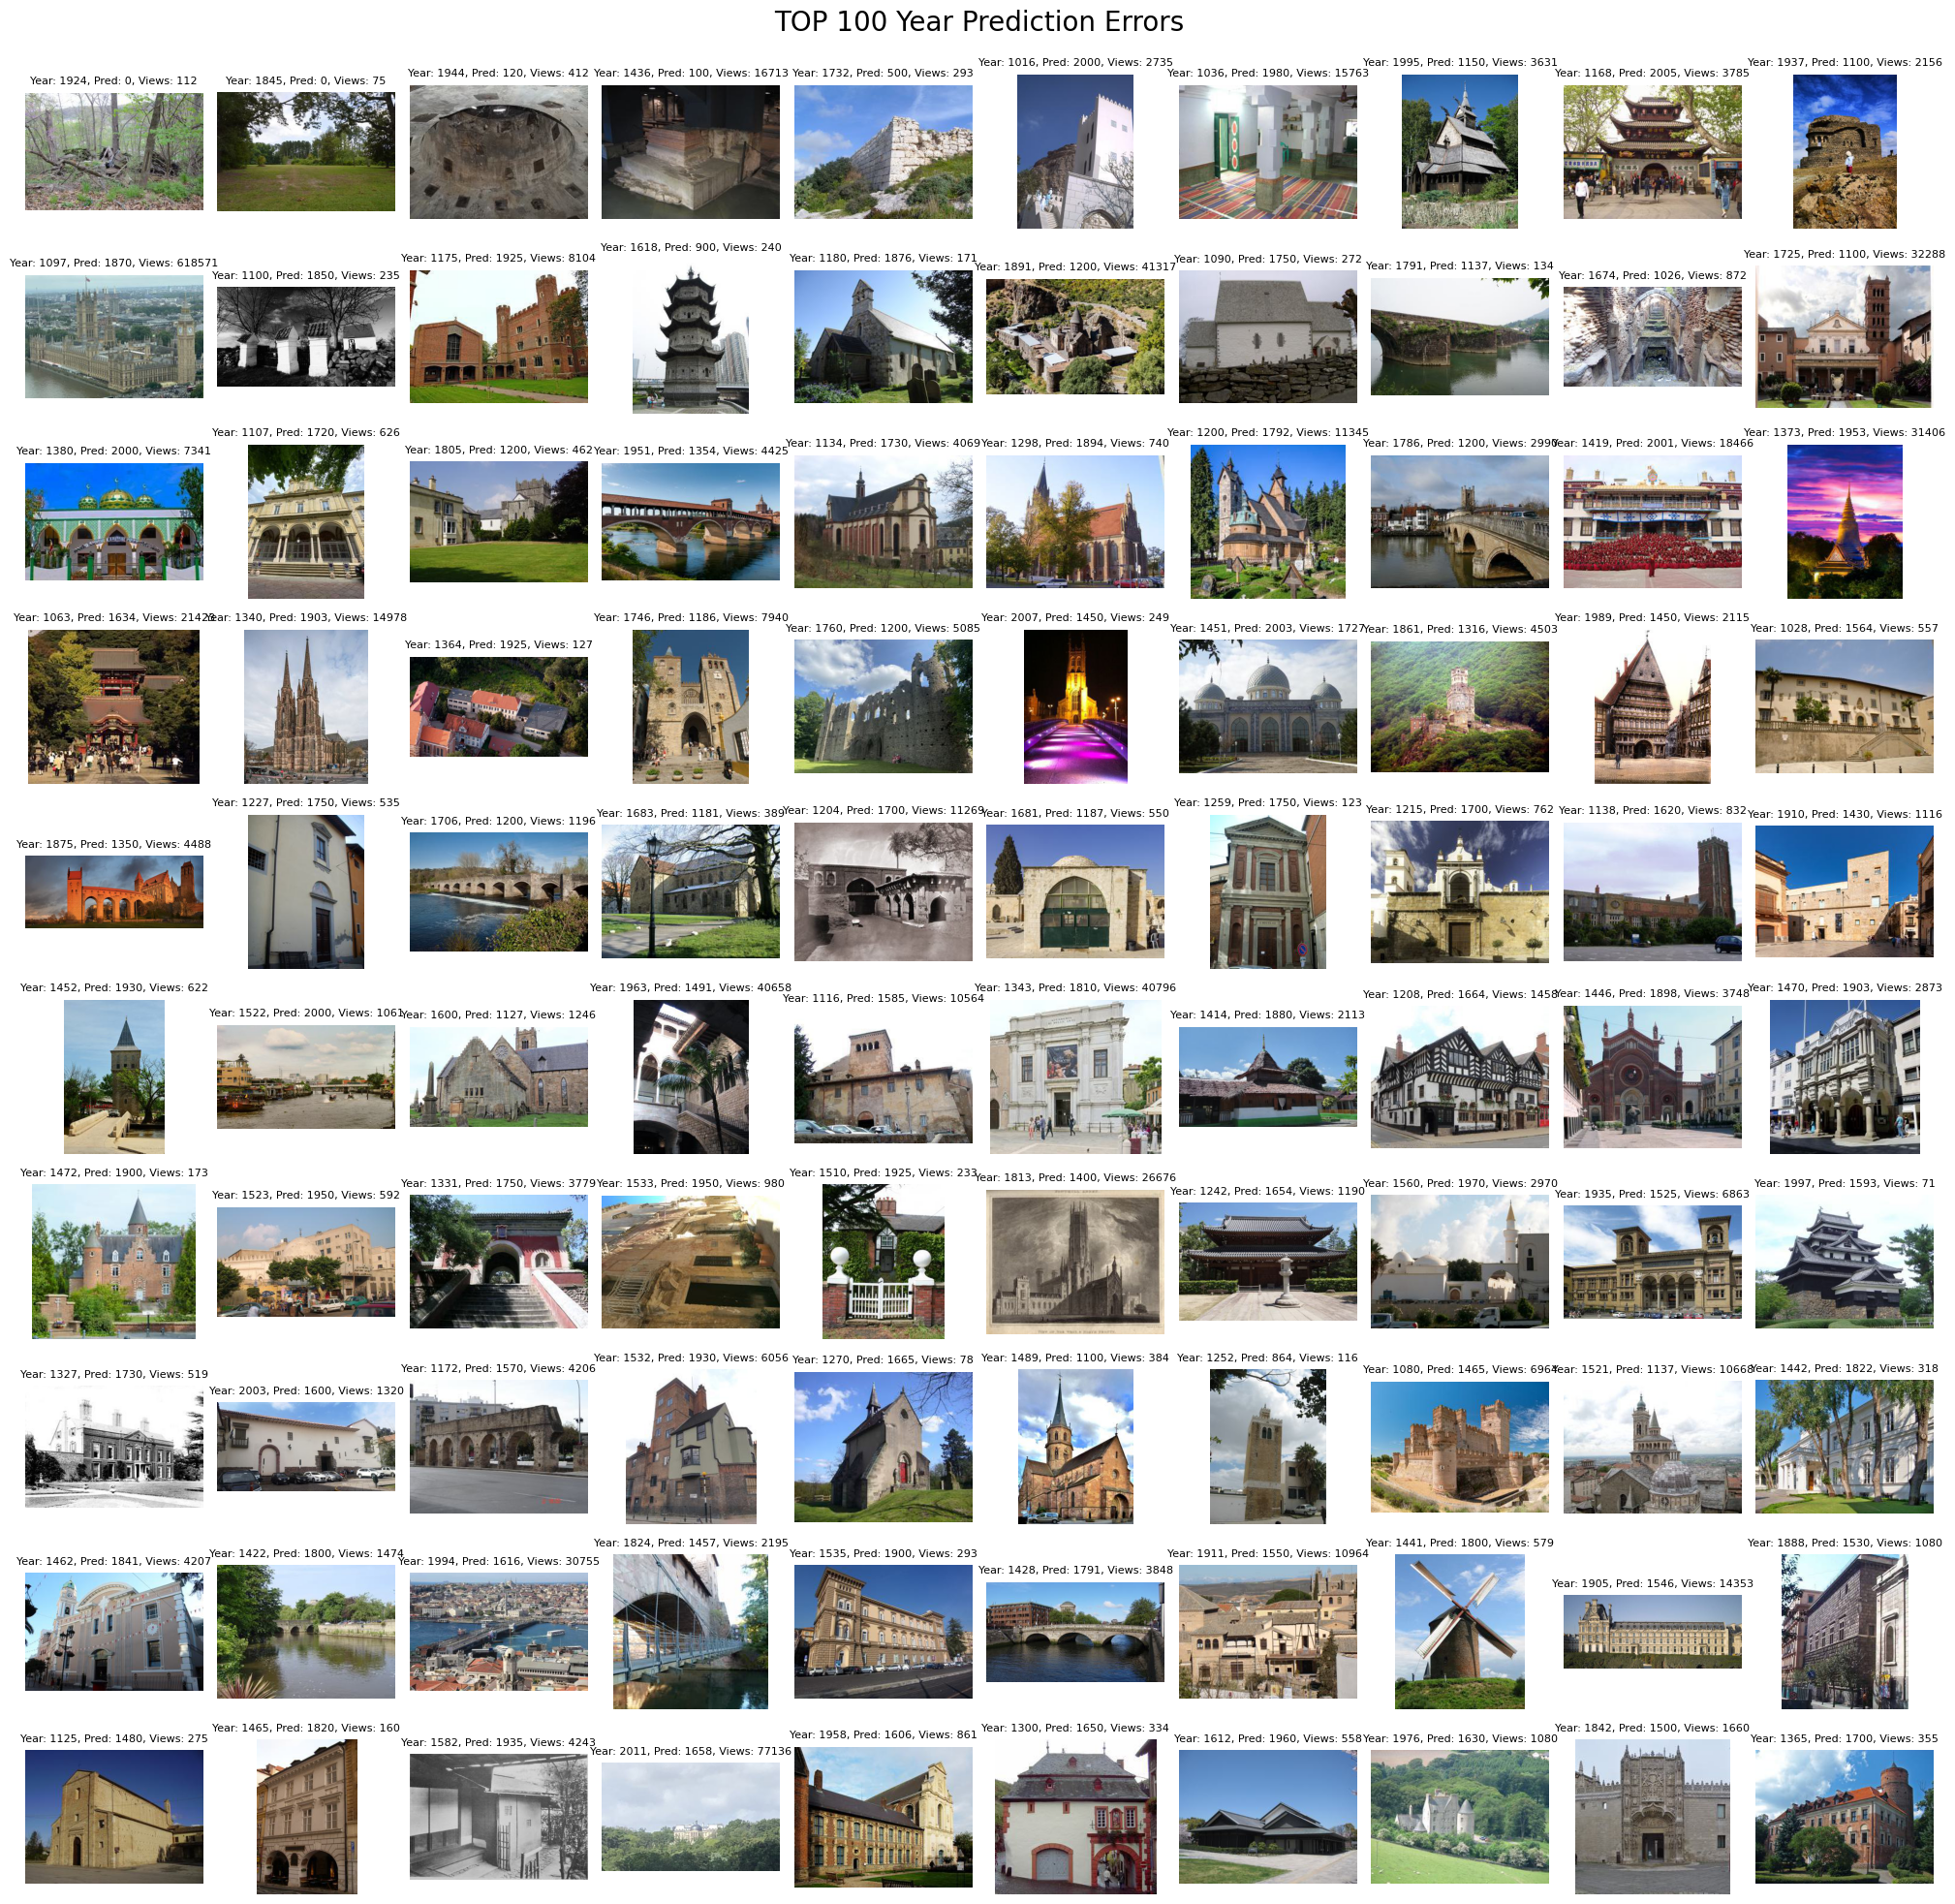
- Models do best on newer buildings (there’s more data and clearer styles) and worst on very old ones (fewer examples and more variation).
- Results vary by continent. Accuracy is generally better in the Americas and Australia and worse in Africa and parts of Europe and Asia, reflecting uneven data coverage and pretraining biases.
- Renovation and setting change difficulty.
- Buildings that were never renovated are easier to date. Rebuilt or heavily renovated buildings are harder, since their appearance may not match the original construction year.
- Semi-urban areas were often easier than dense cities or very rural places, possibly because city skylines mix styles from many eras, and rural data is more sparse.
What this means going forward
- Be careful trusting VLMs for real-world heritage or planning tasks.
- If a model “knows” famous buildings but struggles with ordinary ones, it could be unreliable for large-scale building surveys, preservation work, or disaster assessments.
- Open, global benchmarks like YearGuessr are essential.
- This dataset lets researchers fairly test models across countries and centuries and measure popularity bias directly. It encourages better, more generalizable AI.
- Explainability matters.
- Models like YearCLIP that point to features (e.g., domes, brick types, window shapes) help people understand and trust the predictions—and spot when the model might be guessing based on the wrong clues.
- There’s still bias to fix.
- The dataset is skewed toward certain regions and recent time periods. The authors plan to add more underrepresented regions and older buildings, and to label renovations more precisely.
- Practical impact.
- With better, less-biased models, cities could estimate building ages at scale to plan energy upgrades, preserve history, and assess risks after disasters. But researchers and policymakers should build in safeguards, check for bias, and use explainable tools when decisions affect people and places.
Knowledge Gaps
Unresolved gaps, limitations, and open questions
Below is a single, concrete list of knowledge gaps and open questions to guide future work:
- Dataset coverage: Quantify and mitigate the heavy geographic skew (63.3% Americas, 22.5% Europe) and temporal skew toward post‑1700 buildings via targeted collection in Africa, Asia, and pre‑1600 periods; release per‑region sampling weights for fair training.
- Popularity proxy validity: Validate Wikipedia pageviews as a memorization/popularity proxy (multi‑year windows, language normalization, per‑project aggregation, seasonality); compare against alternative signals (Wikidata sitelinks, backlinks, interwiki count, Google Trends).
- Confounding control: Re-estimate popularity bias while controlling for region, period, renovation status, and image quality using stratified analyses or causal models (e.g., propensity scoring, mixed‑effects regression).
- Landmark recognition vs. architectural reasoning: Design identity‑scrambling tests (tight crops, background removal, silhouette/feature masking, style‑preserving texture randomization) to distinguish landmark recognition from architectural reasoning in VLMs.
- Text leakage checks: Determine whether VLMs implicitly rely on memorized textual descriptors (e.g., engraved names, signage) by conducting OCR‑based filtering and text‑redaction experiments; document prompt and input policies to avoid leakage.
- Label uncertainty and multi‑phase construction: Replace single-year labels with intervals or distributions where sources report ranges or phased construction; evaluate models with interval losses and calibration metrics for uncertainty quantification.
- Renovation/rebuild labeling quality: Audit and validate LLM-derived renovation labels with expert annotators; measure precision/recall and inter‑rater agreement; expand to multiple renovation timestamps and scope (façade-only vs. structural).
- GPS accuracy and leakage: Verify coordinate accuracy (cross‑check with OSM/Wikidata); assess leakage by swapping/shuffling coordinates, country‑level masking, and low‑precision rounding; quantify performance drop to estimate reliance on location priors.
- Fairness metrics: Add group fairness measures (per‑continent/per‑country errors, parity gaps, equalized MAE/IA across bins); test bias mitigation (reweighting, domain adaptation, adversarial debiasing) and report their efficacy.
- Style taxonomy completeness: Document the seven coarse style classes; assess cross‑cultural coverage (vernacular/non‑Western styles) and expand taxonomy with region‑specific styles and hybrid forms; measure style classification accuracy and its impact on year prediction.
- Reasoning prompt coverage and bias: Evaluate whether pre-defined prompts (roof, wall, height, materials) miss salient cues in non‑Western or vernacular architecture; extend prompts with region‑ and era‑specific features and quantify gains.
- Rationale faithfulness: Move beyond anecdotal examples to systematic human evaluation of YearCLIP rationales (expert scoring, faithfulness via deletion/insertion tests, feature‑grounding with segmentation/parts).
- Robustness to visual noise: Benchmark sensitivity to occlusion, viewpoint changes, illumination, resolution, compression, and seasonal effects using controlled perturbations; report robustness curves for all model families.
- Multi‑view and temporal imagery: Extend the benchmark to multi‑view per building and longitudinal imagery (pre‑ and post‑renovation); evaluate fusion models (video/sequence encoders, graph across views) for improved dating.
- Domain shift: Test generalization to non‑Wikipedia imagery (Street View, smartphone, archival photographs); quantify cross‑domain transfer and propose adaptation strategies.
- Metric completeness: Release code and exact definition for the “popularity‑aware MAE” mentioned in the abstract; add rank‑based metrics (Spearman, Kendall), quadratic weighted kappa, and calibration curves (reliability diagrams, ECE for year intervals).
- Closed‑source VLM evaluation reproducibility: Standardize prompts, input modalities, and temperature settings; quantify output variance across runs; release prompt templates and evaluation scripts to ensure reproducibility.
- Ablation of location fusion: Provide full ablation of zero‑convolution vs. fixed‑α fusion across seeds and datasets; report statistical significance and analyze over‑reliance on GPS in different regions/periods.
- Data cleaning audit: Extend manual audit beyond the test split; release an annotated “noise subset” (non‑building/ambiguous cases) and quantify remaining label/image errors.
- Image selection bias: Investigate bias from choosing the “first infobox image” (e.g., iconic angles, professional photos); compare against random or diverse image sampling per building.
- Period‑specific modeling: Develop era‑aware submodels or mixture‑of‑experts to address extreme errors in early periods (1000–1600); incorporate historical style priors and region‑specific timelines.
- Textual metadata integration: Explore using curated textual descriptions while preventing leakage (redacted names, controlled vocabularies); measure incremental gains and the risk of memorization.
- Uncertainty reporting: Require models to output confidence intervals or predictive distributions over years; evaluate decision quality under uncertainty (e.g., abstention policies).
- Ethical impact assessment: Elaborate the “responsible‑use data card” (use cases, misuse risks, geographic equity, cultural sensitivities); add bias monitoring dashboards and mitigation guidelines.
- Open baselines breadth: Include dedicated ordinal regression baselines (CORAL/CORN variants, probabilistic ordinal models) and non‑CLIP multimodal fusers; report competitiveness under the same protocol.
- Cross‑factor analyses: Publish multi‑factor error tables (region × period × popularity × renovation × density) to reveal interaction effects and prioritize mitigation targets.
- Synthetic augmentation validity: Define procedures and fidelity checks for generating ancient/vernacular façades (style‑conditional diffusion with expert verification); test whether synthetic data reduces early‑period MAE without introducing artifacts.
- Data and code release details: Provide complete training settings (currently “in supplementary”), release scripts for crawling/licensing checks, de‑duplication, CLIP buildingness thresholds, and all evaluation splits to enable full replication.
Practical Applications
Overview
The paper introduces YearGuessr, a large-scale, CC BY-SA 4.0 dataset of 55,546 building facades from 157 countries annotated with construction year (1001–2024 CE), GPS, captions, and Wikipedia pageviews (popularity). It frames building age prediction as ordinal regression, proposes popularity-aware evaluation metrics, and presents YearCLIP, a CLIP-based model that fuses location encodings and reasoning prompts to produce both year estimates and human-verifiable rationales. A key finding is that many VLMs exhibit strong popularity bias (substantially better on famous landmarks), suggesting memorization rather than generalizable architectural understanding. The following lists outline practical applications across industry, academia, policy, and daily life, grouped by immediate and long-term deployment potential.
Immediate Applications
The following applications can be piloted or deployed now with the dataset, baseline model, and evaluation protocol provided.
- Industry (real estate, insurance, energy audits): Rapidly enrich property databases with approximate construction years where records are missing
- Sector: Finance, PropTech, Energy
- Tool/product/workflow: YearCLIP batch inference integrated into QGIS/ArcGIS; an “AgeGuess API” for property data platforms; pre-screening for energy retrofits and underwriting
- Assumptions/dependencies: Sufficient facade visibility; acceptable MAE (~40 years) for triage; licensing clearance for imagery; human-in-the-loop QA for high-stakes use
- Municipal planning and sustainability: City-scale mapping of building stock age to prioritize retrofit subsidies and weatherization campaigns
- Sector: Energy, Urban planning, Public policy
- Tool/product/workflow: “Retrofit Prioritizer” pipeline combining YearCLIP with parcel GIS, producing heatmaps and IA thresholds (e.g., IA20 for period-level accuracy)
- Assumptions/dependencies: Data skew toward Americas/modern stock; cross-checking with cadastral records to avoid overreliance on visual inference
- Heritage preservation triage: Flag potentially older buildings for expert review and archival updates
- Sector: Culture/heritage
- Tool/product/workflow: “HeritageLens” dashboard that surfaces candidates with explainable rationales (roof/wall/material cues) and confidence bands
- Assumptions/dependencies: Renovation/rebuild status can invalidate original-year cues; require curator validation and local guidelines
- Disaster risk pre-assessment: Use age distributions as a proxy to identify potentially vulnerable structures before events (e.g., seismic, wind)
- Sector: Emergency management, Insurance
- Tool/product/workflow: Risk layers merging age estimates with hazard maps; stratification by rural/urban density as in the paper’s analysis
- Assumptions/dependencies: Age is an imperfect proxy; structural integrity and compliance records still required; avoid post-event operational deployment without validation
- MLOps bias auditing: Add “popularity-aware interval accuracy” to AI evaluation suites to detect and mitigate memorization bias in VLMs
- Sector: Software/AI
- Tool/product/workflow: “Popularity Bias Monitor” that reports IA5 by pageview bins and gain metrics, used during model selection/procurement
- Assumptions/dependencies: Availability of proxy popularity signals (pageviews or equivalent); reproducible splits and seeds
- Academic benchmarking and coursework: Reproducible experiments on ordinal regression, geo-aware fusion, and explainability in architecture
- Sector: Academia/education
- Tool/product/workflow: Assignments/labs using YearGuessr and YearCLIP; comparative studies on MAE/IA across regions/periods; debiasing experiments
- Assumptions/dependencies: Compute and storage for training; adherence to CC BY-SA 4.0 licensing; acknowledgment of dataset skew
- Tourist and educational AR apps: Interactive “YearGuessr” experiences that overlay estimated construction year and rationale on live camera views
- Sector: Education, Tourism
- Tool/product/workflow: Mobile AR app using a lightweight YearCLIP model and local GPS; “why” explanations via reasoning prompts
- Assumptions/dependencies: On-device performance; accurate geolocation; clear facade views; disclaimers for uncertainty
- Open mapping contributions: Community tasks to suggest approximate construction years where none exist (with confidence labels)
- Sector: Open data/OSM
- Tool/product/workflow: Moderated “suggested_year” flag with confidence intervals; review queue for mappers/municipal editors
- Assumptions/dependencies: Platform policies; safeguards against automated bulk edits; human verification
- Facility management triage: Prioritize inspection and maintenance scheduling for older building segments in large portfolios (campuses, hospitals, retail chains)
- Sector: Facilities/healthcare/retail
- Tool/product/workflow: Portfolio dashboards with estimated age buckets and explainable cues; integration with CMMS
- Assumptions/dependencies: Internal imagery coverage; organizational data governance; QA for mission-critical sites
Long-Term Applications
These applications require further research, debiasing, global scaling, multi-sensor fusion, or policy integration before widespread deployment.
- City-scale retrofit planning with regulatory adoption: Standardize visual age estimation in municipal energy models and retrofit mandates
- Sector: Energy, Public policy
- Tool/product/workflow: “Retrofit Map” integrating building age with envelope characteristics, utility usage, and subsidy targeting
- Assumptions/dependencies: Expanded datasets (non-Western, pre-1600), calibration against ground-truth registers, public consultation and legal frameworks
- Real-time disaster assessment from aerial/ground robots: Drones or inspection robots estimating building age to triage structural risk during response
- Sector: Robotics, Emergency management
- Tool/product/workflow: On-board YearCLIP variants fused with damage detectors; prioritized inspection workflows
- Assumptions/dependencies: Robust on-device models; domain shift handling (debris/occlusion); operational approval and safety protocols
- Cultural heritage discovery at scale: Automatic identification of candidate heritage assets (e.g., pre-1900) for conservation registries
- Sector: Culture/heritage, Public policy
- Tool/product/workflow: “Conservation Finder” that flags potential listings with explainability and renovation segmentation
- Assumptions/dependencies: Expert validation; improved handling of renovated/rebuilt cases; inclusive coverage of underrepresented regions/styles
- Circular economy in construction/demolition: Infer likely materials and systems from estimated age to inform recycling and hazard handling (e.g., asbestos)
- Sector: Construction, Environmental services
- Tool/product/workflow: “Deconstruction Planner” combining age with material/style classifiers to plan salvage and waste streams
- Assumptions/dependencies: Multi-modal fusion (RS, SVI, permits); local regulations; model extensions beyond year estimation
- Digital twin enrichment: Add time layers (construction and renovation epochs) to urban digital twins for planning, simulation, and code compliance analytics
- Sector: Smart cities, Software
- Tool/product/workflow: Time-aware digital twins with uncertainty-aware layers and popularity-aware debiasing
- Assumptions/dependencies: Continuous data ingestion; temporal segmentation labels; governance for public data exposure
- Debiased, geo-temporal VLMs: New training regimes that reduce popularity bias and improve generalization across continents and eras
- Sector: AI/ML research
- Tool/product/workflow: Standardized “BiasAudit for VLMs” benchmark suite; improved ordinal losses and location fusion; synthetic augmentation
- Assumptions/dependencies: Expanded, balanced corpus; active learning; fairness auditing and reporting standards
- Integration with street-level and satellite platforms: Auto-populate construction year fields using Mapillary/Street View and remote sensing for areas lacking records
- Sector: GIS/RS, Mapping
- Tool/product/workflow: Cross-view fusion pipelines with hierarchical geo-cells, climate and land-cover priors
- Assumptions/dependencies: Platform partnerships; privacy/compliance; robust cross-sensor generalization
- Financial products and ESG reporting: Age-informed green financing, mortgage risk scoring, and REIT portfolio analytics
- Sector: Finance/ESG
- Tool/product/workflow: “Age-adjusted ESG” scoring; retrofit loan targeting; insurance premium adjustment signals
- Assumptions/dependencies: Regulatory acceptance; model transparency; human oversight and dispute processes
- Architecture and history education at scale: MOOC modules that teach architectural styles and temporal reasoning with explainable AI
- Sector: Education
- Tool/product/workflow: Interactive curricula using YearGuessr; student projects on debiasing and ordinal regression
- Assumptions/dependencies: Pedagogical design; access to compute for labs; localized content for global diversity
- Governance and safeguards: Policies that mandate popularity-aware bias reporting in public-sector AI procurements and protect sensitive heritage/vulnerability data
- Sector: Public policy/ethics
- Tool/product/workflow: Procurement checklists including IA5 gains by popularity bins; data cards; responsible-use guidelines
- Assumptions/dependencies: Standards bodies engagement; stakeholder buy-in; continuous monitoring and red-teaming
In all cases, feasibility depends on data availability (clear facade imagery and accurate GPS), addressing dataset skew and early-period sparsity, robust handling of renovations/rebuilds, transparency and human oversight (especially for policy and finance), and careful consideration of privacy, ethics, and potential misuse (e.g., identifying vulnerable sites).
Glossary
- AddressCLIP: A CLIP-based model that aligns visual features directly with street address text for geo-related tasks. "AddressCLIP~\citep{xu2024addressclip} aligns directly with street addresses."
- CC BY-SA 4.0: A Creative Commons license allowing sharing and adaptation with attribution and share-alike terms. "will be the first open, CC BY-SA 4.0 corpus with global coverage, large-scale ordinal labels, GPS, and rich textual descriptions."
- Chain-of-thought prompting: A prompting technique that elicits step-by-step reasoning in models. "visual chain-of-thought prompting~\citep{chen2024visual}"
- CLIP: Contrastive Language-Image Pretraining; a multi-modal model aligning image and text embeddings. "CLIP~\citep{radford2021learning}, a multi-modal framework pre-trained to align image and text"
- CORAL/CORN losses: Ordinal regression loss functions designed for ordered categories. "Ordinal regression evolved from CORAL/CORN losses~\citep{niu2016ordinal,cao2020rank}"
- Cross-view supervision: Training using pairs of views (e.g., ground and satellite) to improve geo-related tasks. "cross-view supervision~\citep{zhu2022transgeo,bastani2023satlaspretrain,lee2025skyfall}"
- Deduplication: A data-cleaning process that removes duplicate items to improve dataset quality. "refined through deduplication, a CLIP-based building filter, and a light manual audit,"
- EXIF: Exchangeable Image File Format; embedded image metadata used as auxiliary signals. "EXIF-as-language~\citep{zheng2023exif}"
- GeoCLIP: A CLIP-based approach that incorporates geospatial signals to improve alignment and prediction. "GeoCLIP~\citep{vivanco2023geoclip}"
- GeoReasoner: A framework that integrates geographic reasoning into vision-LLMs. "GeoReasoner~\citep{li2024georeasoner}"
- Geolocalization: Predicting the geographic location of an image. "Image geolocalization foundations."
- GPWv4.11: Gridded Population of the World v4.11; a population density dataset used for spatial context. "GPWv4.11 population density."
- Heavy-tailed distribution: A distribution with many low-frequency items and a few high-frequency outliers. "a heavy-tailed distribution: a large number of images have low annual views,"
- Hierarchical cells: Spatial partitioning into nested regions for efficient globe-scale localization. "later refined via hierarchical cells~\citep{vo2017revisiting,seo2018cplanet}"
- Im2GPS: A pioneering method for planet-scale image geolocalization via scene matching. "Im2GPS~\citep{hays2008im2gps} and PlaNet~\citep{weyand2016planet}"
- Interval Accuracy: An accuracy metric measuring whether predicted values fall within specified error ranges. "Interval Accuracy: IA = $\frac{1}{N}\sum_{i=1}^{N}\mathbbm{1}[|y_i-\hat{y}_i|\le k]$ for years."
- LLMGeo: A large-language-model approach tailored for geospatial reasoning tasks. "LLMGeo~\citep{wang2024llmgeo}"
- LOD1 3-D GIS: Level of Detail 1 three-dimensional GIS models representing building volumes. "LOD1 3-D GIS"
- Mean Absolute Error (MAE): The average absolute difference between predictions and ground truth. "Mean Absolute Error: MAE = ."
- NeRF: Neural Radiance Fields; a 3D representation technique used for rendering and feature encoding. "Inspired by NeRFâs RFFs~\citep{mildenhall2021nerf}"
- NumCLIP: A CLIP extension that encodes numeric order using language priors for ordinal prediction. "adopt NumCLIP~\citep{du2024teach}, which uses language priors for a coarse-to-fine strategy."
- OpenStreetMap (OSM): A collaborative mapping platform often used as a geospatial data source. "OSM, 2-D urban form"
- Ordinal regression: Modeling ordered targets where the relative ranking between classes matters. "we cast the problem as ordinal regression rather than hard classification or naïve regression."
- OrdinalCLIP: A CLIP variant that integrates ordinal information into text representations. "Vision-language extensions (OrdinalCLIP~\citep{li2022ordinalclip}, NumCLIP~\citep{du2024teach}) encode order in text."
- Popularity bias: Systematic performance improvement on popular items due to memorization rather than reasoning. "We expose a significant popularity bias in state-of-the-art vision-LLMs (VLMs),"
- Popularity-based MAE metric: An evaluation that measures MAE across popularity strata to quantify bias. "a new popularity-based MAE metric to quantify memorization bias."
- Random Fourier Features (RFFs): A technique to approximate kernel mappings using random Fourier transforms. "Inspired by NeRFâs RFFs~\citep{mildenhall2021nerf}"
- Reasoning prompts: Predefined textual cues (e.g., roofs, walls) that guide the model’s architectural reasoning. "pre-defined reasoning prompts (e.g., Roof (spire, dome), Wall (brick, stone))"
- Reverse-geocoding: Converting latitude/longitude into human-readable location names. "country name (via reverse-geocoding)"
- Spatial priors: Prior knowledge or constraints about geographic context used to inform predictions. "Contrastive VLMs lack strong spatial priors."
- Swin Transformer: A hierarchical vision transformer architecture for image understanding. "Swin-B \citep{liu2021swin}"
- Temporal ordinality: The inherent ordered nature of time labels that should be respected in modeling. "ignoring temporal ordinality, while licensing restrictions impede reproducibility."
- Vision Transformer (ViT): A transformer-based architecture operating on image patches. "ViT-B/16 \citep{dosovitskiy2020image}"
- Vision-LLM (VLM): A model that jointly processes and reasons over visual and textual inputs. "vision-LLMs (VLMs)"
- Wikimedia Pageviews API: An API for retrieving page view statistics to proxy popularity. "We then query the Wikimedia Pageviews API (right) to record one-year visit counts as a popularity signal."
- YearCLIP: A CLIP-based model that fuses location and reasoning prompts for ordinal age estimation. "YearCLIP (ours)"
- Zero convolution: A learnable fusion layer initialized to zero for modality integration without initial bias. "a fused location encoder with zero-convolution."
- Zero-shot: Evaluating a model on a task without fine-tuning on that specific task’s data. "CLIP (zero-shot) \citep{radford2021learning}"
Collections
Sign up for free to add this paper to one or more collections.