A Rosetta Stone for AI Benchmarks
Abstract: Most AI benchmarks saturate within years or even months after they are introduced, making it hard to study long-run trends in AI capabilities. To address this challenge, we build a statistical framework that stitches benchmarks together, putting model capabilities and benchmark difficulties on a single numerical scale. This acts as a "Rosetta Stone", allowing us to compare models across a wide range of abilities and time, even if they are not evaluated on the same benchmarks. Moreover, this works without assuming how capabilities evolve across time or with training compute. We demonstrate three applications of this framework. First, we use it to measure the speed of AI progress over time, and to forecast future AI capabilities. Second, we estimate the rate of improvements in algorithmic efficiency, finding estimates that are higher, but broadly consistent with prior work. Finally, we find that our approach can be used to detect rapid accelerations in AI progress.
Paper Prompts
Sign up for free to create and run prompts on this paper using GPT-5.
Top Community Prompts
Explain it Like I'm 14
Overview: What this paper is about
This paper tackles a big problem in AI research: most tests (called “benchmarks”) get solved quickly, so it’s hard to track AI progress over many years or compare different models that weren’t tested on the same things. The authors build a simple “translator” for benchmarks — like a Rosetta Stone — that puts both model ability and test difficulty on the same scale. That lets us compare many AI models across time, even if they were measured on different tests.
Key questions the paper asks
- Can we create one shared scale that tells us how capable an AI model is and how hard each benchmark is?
- Can this scale help us track AI progress over time and make simple predictions?
- Can it help estimate how much of AI improvement comes from smarter methods (algorithms), not just more computing power?
- Can it spot sudden “jumps” or accelerations in AI progress?
How they did it (in plain language)
The authors gathered many scores from many AI models on many benchmarks (179 models, 38 benchmarks, 1,324 scores). Some of these came from their own tests, others from public results. Then they fit a simple statistical model that treats:
- each model as having a single “capability score” (how strong it is overall), and
- each benchmark as having a “difficulty score” (how hard it is), plus a “slope” (how sharply scores jump as models get better).
Think of it like this:
- Models are students with a single overall skill level.
- Benchmarks are tests with a difficulty level (how tough) and a sharpness (how quickly scores climb from failing to acing as students get better).
They assume scores follow an S-shaped pattern:
- If a test is too easy, strong models all get near 100%.
- If a test is too hard, weaker models all get near 0%.
- In the middle, small changes in ability lead to big score changes.
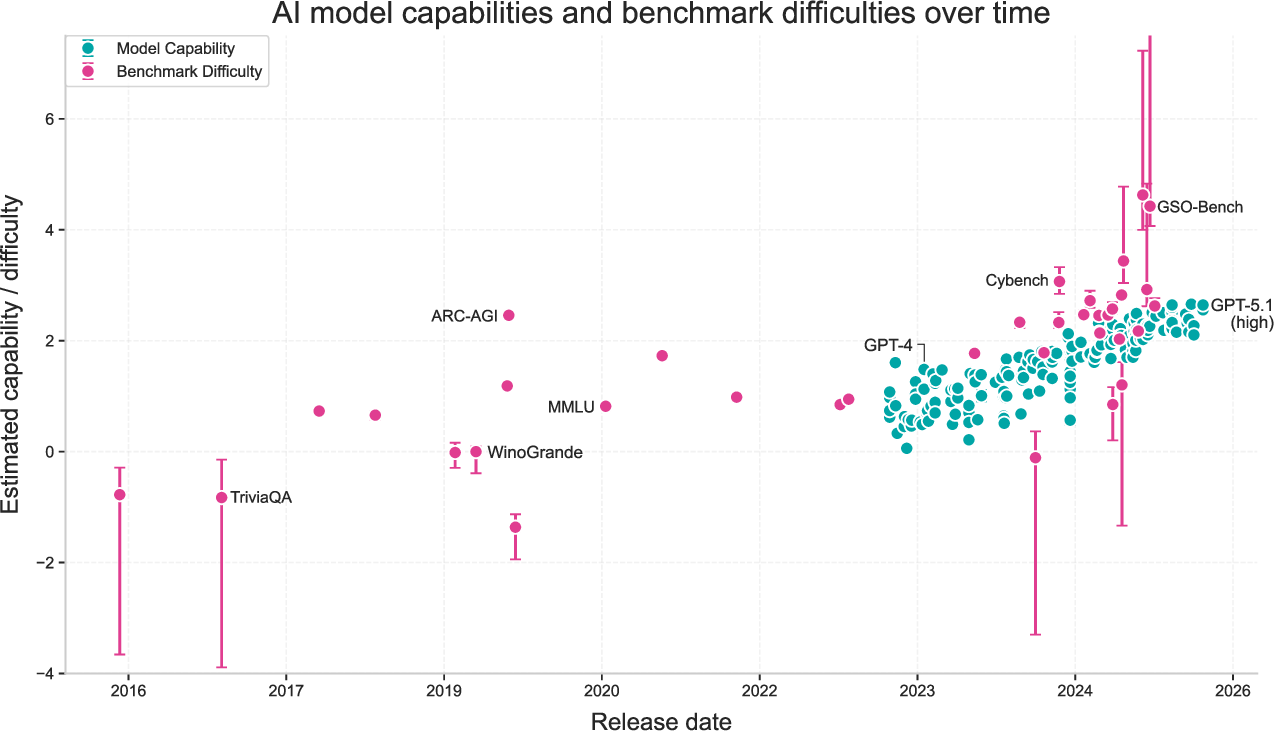
By fitting this S-shaped pattern across many model–benchmark pairs, they can “stitch” everything together onto one shared ruler: higher numbers mean stronger models; higher benchmark numbers mean harder tests.
Technical choices, explained simply:
- They use a standard curve-fitting method (least squares with a small regularizer) to find the numbers that best match all the observed scores.
- Because the scale could be shifted or stretched in many equally good ways, they pin it down by choosing one benchmark (WinoGrande) as the anchor: they set its difficulty to 0 and its slope to 1. This makes the numbers comparable across runs.
Main findings and why they matter
Here are the most important takeaways from the stitched-together scale.
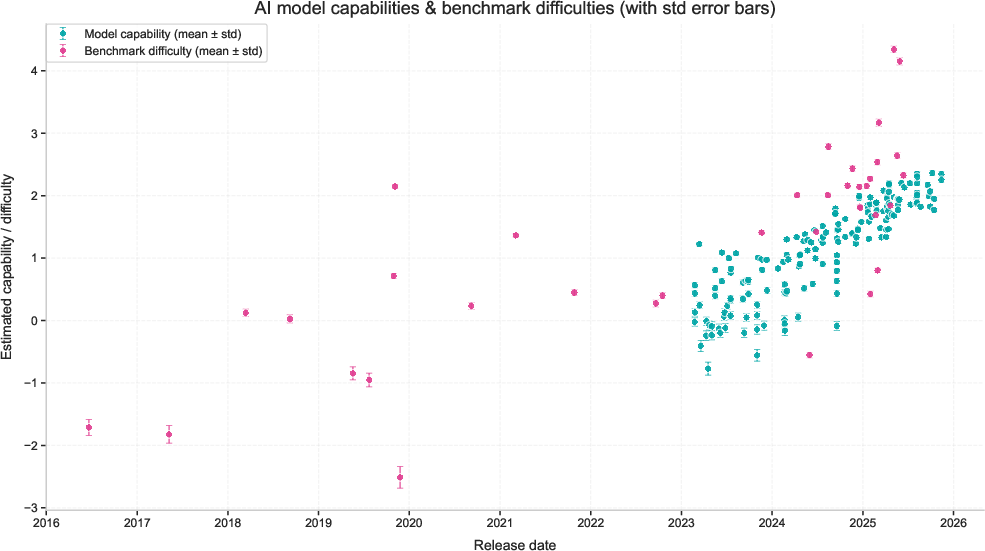
- Models and benchmarks both got tougher over time
- Newer models have higher capability scores.
- New benchmarks are increasingly difficult (which is good, because they keep challenging new models).
- The rankings make sense
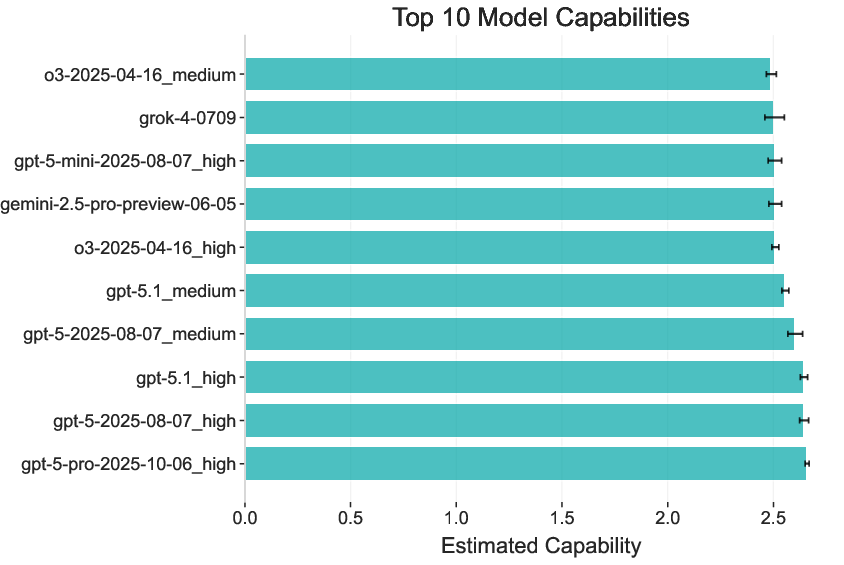
- Stronger modern models (like GPT-5-level systems) rank above earlier ones, matching everyday experience.
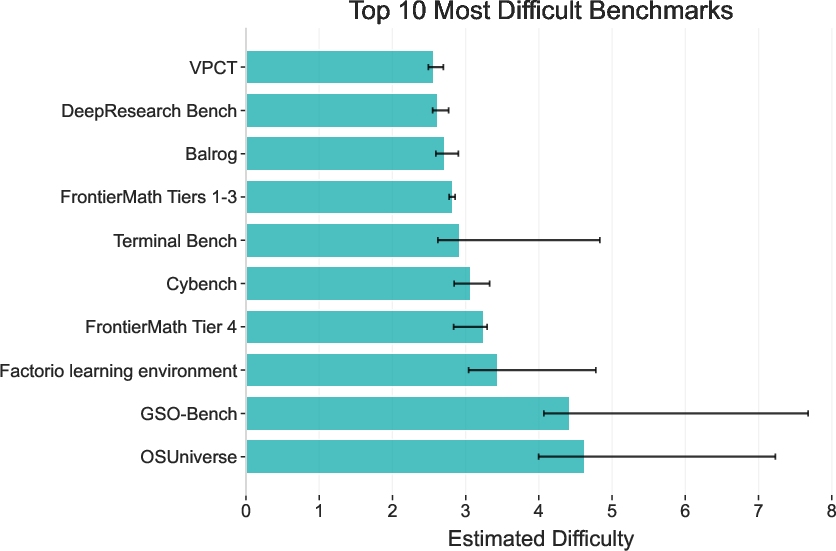
- Harder tests (like FrontierMath Tier 4) rank as tougher than easier ones.
- A single number surprisingly predicts “how big” tasks are
- The model’s capability score strongly predicts a “time horizon” — roughly, how long tasks take humans to do at the same success rate. Higher capability → longer, harder tasks.
- Their stitched capability score predicts time horizons better than most individual benchmarks.
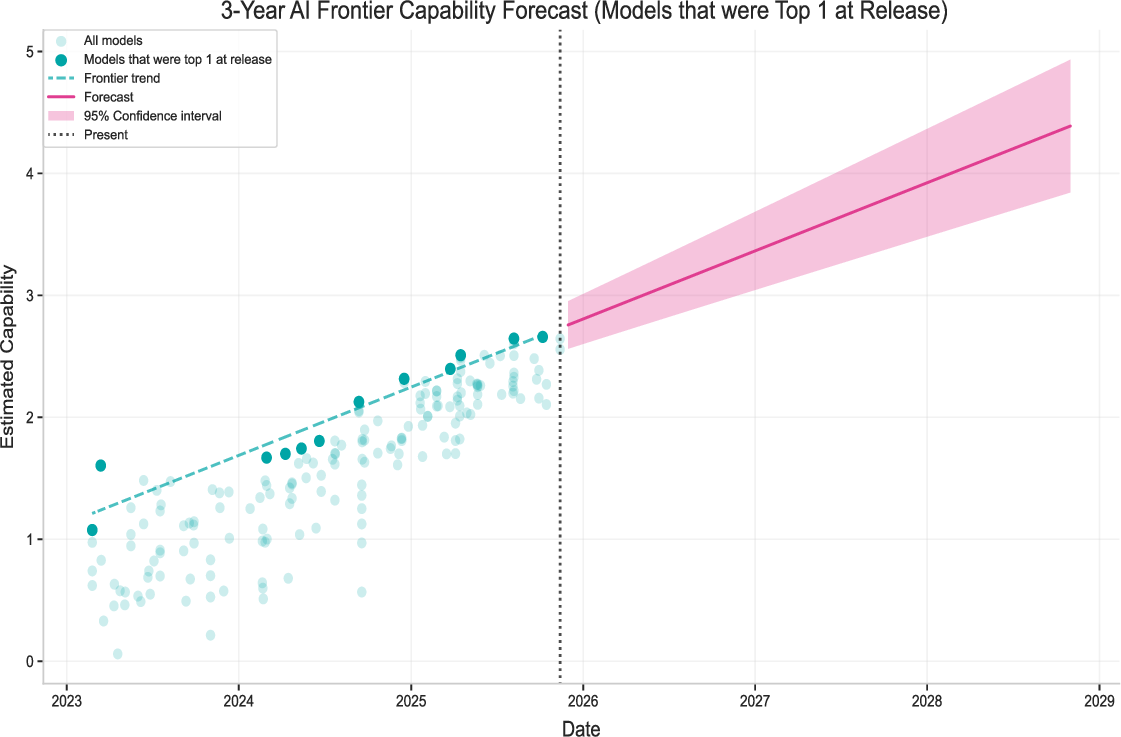
- Simple, real-world progress trend and forecast
- The strongest (frontier) models have improved by about 0.55 “capability units” per year — roughly the jump from GPT-4.5 to GPT-5 in a year.
- If that kept up, we’d expect around 1.6–1.8 more units in three years (a big jump), roughly matching a move toward tasks that take weeks for humans to complete.
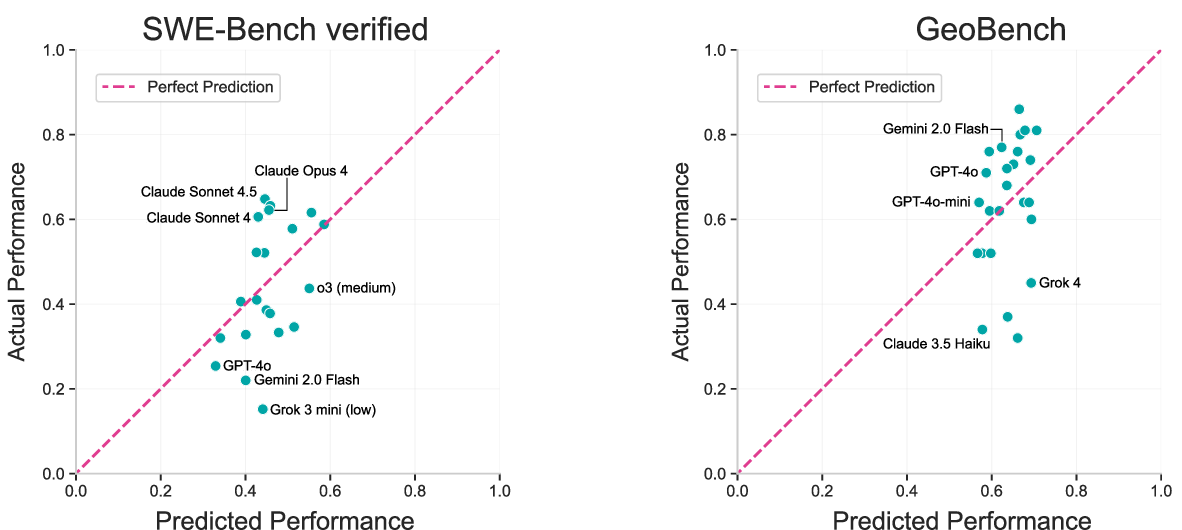
- Labs may specialize
- Some models do a bit better than expected on coding (e.g., some Claude models on SWE-Bench Verified), while others do better on multimodal tasks (e.g., some Gemini models on GeoBench). That suggests different labs optimize for different strengths.
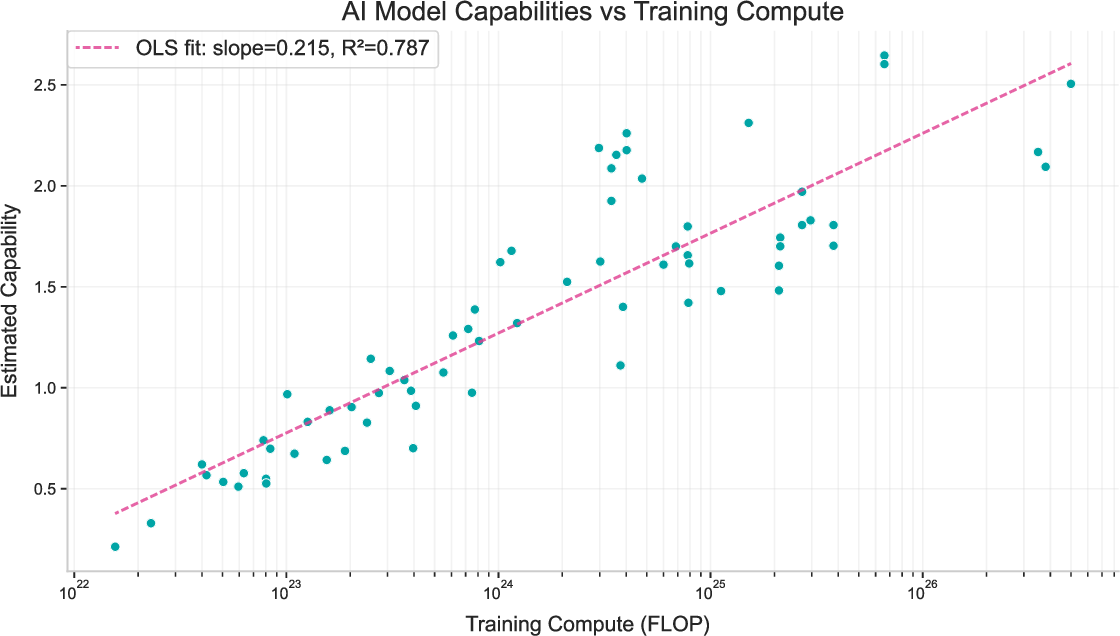
- Algorithmic progress (smarter methods) looks fast, but uncertain
- They relate capability to training compute and find that, for frontier models, the compute required to reach a fixed ability seems to drop by around 6× per year on average (with big uncertainty).
- Put another way: even if you didn’t increase compute, smarter training alone could raise capability notably each year.
- Because results depend on limited families of models and assumptions, these numbers come with wide error bars.
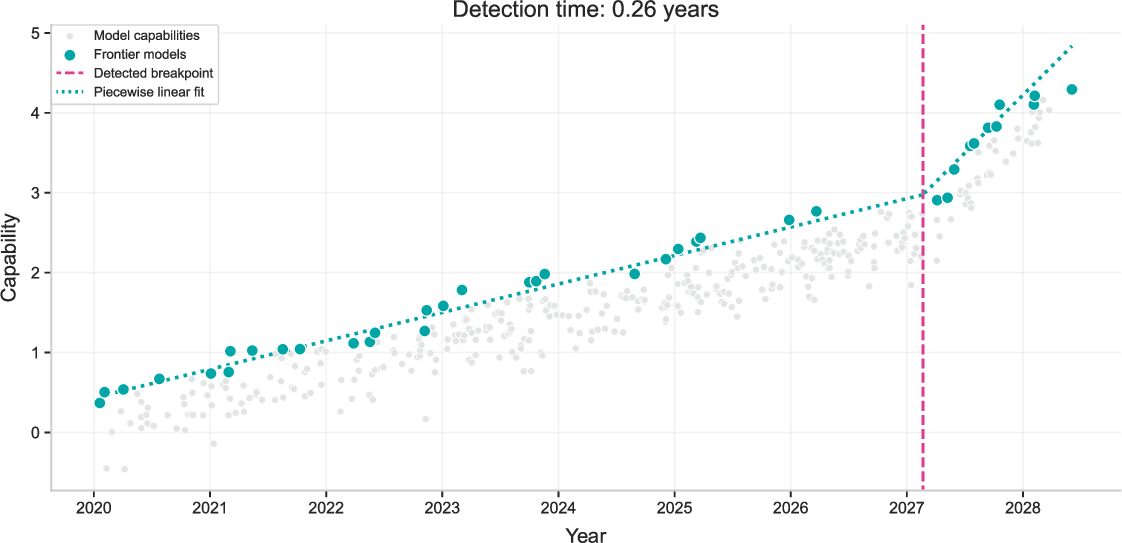
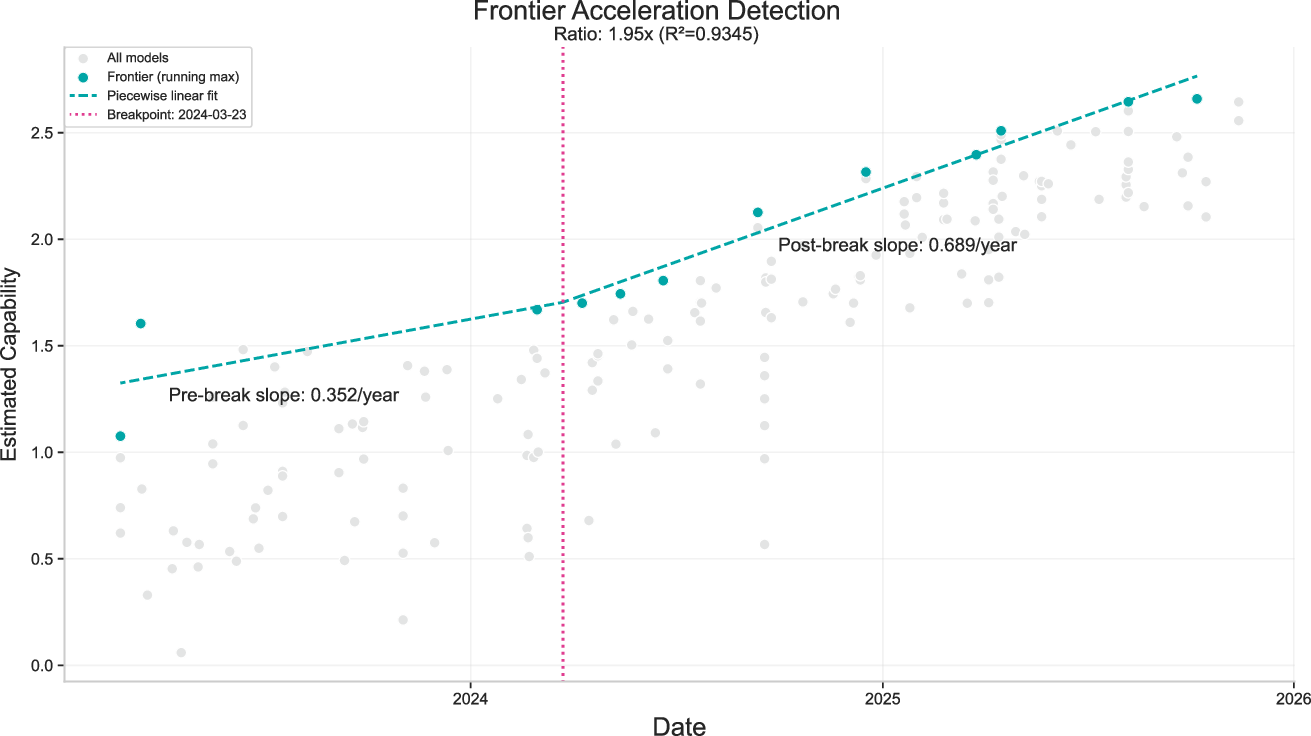
- Detecting “accelerations” in progress is possible
- In simulated tests, their method can typically spot a 2× acceleration within 2–3 months when noise is moderate.
- On real data, they see a notable acceleration around spring 2024 (about 1.95×), which lines up with the rise of “reasoning” models and other evidence from independent studies.
What this research could change
- Better long-term tracking: Because benchmarks saturate fast, this stitched scale gives a stable way to track progress over years, not just months.
- Clearer comparisons: It helps compare models tested on different benchmarks — a common real-world problem.
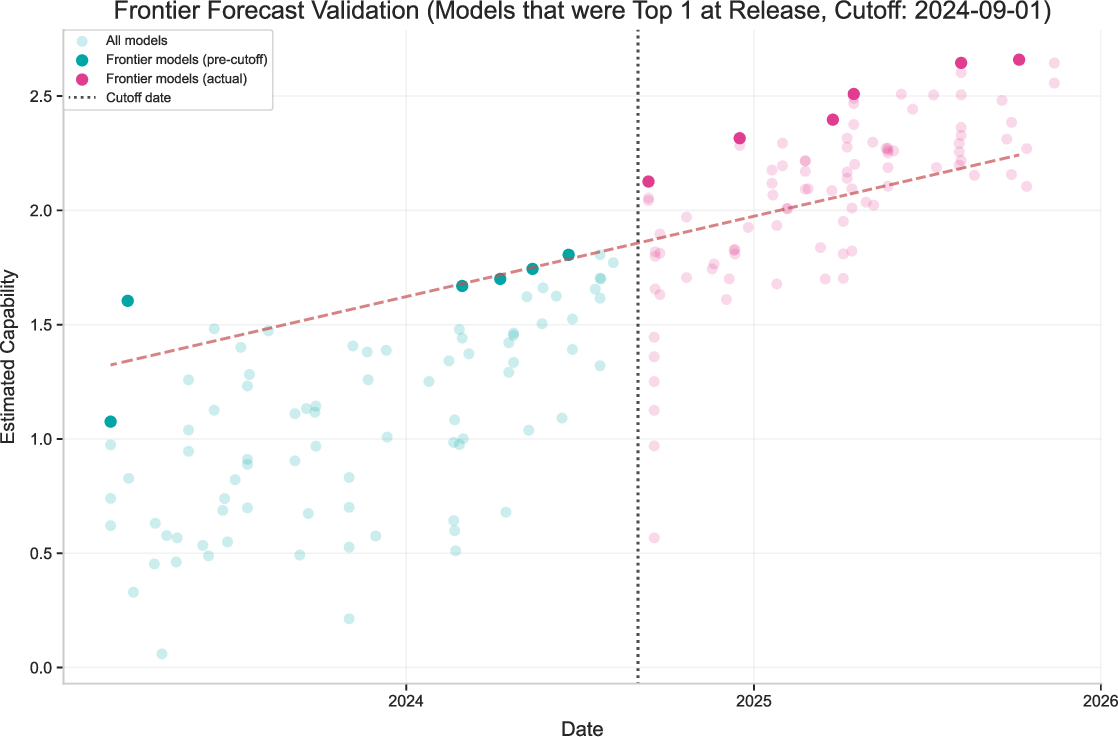
- Practical forecasting: Even a simple trendline on the stitched scale produces useful, interpretable forecasts and can warn us if progress speeds up suddenly.
- Smarter measurement: It shows which benchmarks are too easy or too hard, guiding where new tests are needed.
- Policy and planning: If capabilities are climbing steadily (and sometimes accelerating), companies, researchers, and policymakers can plan evaluations, safety checks, and deployments more responsibly.
Important notes and limits
- One number can’t capture all abilities
- Real AI skills are multi-dimensional (e.g., coding vs. vision). The single capability score works surprisingly well overall, but some models specialize.
- Benchmarks have flaws
- Some tests have errors, don’t reflect real-world tasks, or depend heavily on prompts and scaffolding. The stitched results inherit these issues.
- Early data can mislead
- Very new, very hard benchmarks often show many low scores, which can make them look even harder than they really are until more models improve.
- Acceleration alarms need confirmation
- The detection method is a helpful early-warning tool, but it can raise false alarms. It works best when combined with other evidence.
In short: The authors propose a simple, cheap, and surprisingly powerful way to “translate” many AI benchmarks onto one shared scale. That makes it much easier to understand how fast AI is improving, compare different models fairly, estimate the role of smarter algorithms, and notice when progress speeds up.
Knowledge Gaps
Unresolved gaps, limitations, and open questions
Below is a concise, actionable list of what remains missing, uncertain, or unexplored in the paper’s framework and results.
- Validate the single-dimensional capability assumption by building and comparing multidimensional latent ability models (e.g., domain-specific components for coding, math, multimodal), and test whether they significantly reduce residuals on specialized benchmarks.
- Quantify how much lab-specific optimization (e.g., Anthropic for code, Google DeepMind for multimodal) biases the single-score capability estimates; develop methods to correct for systematic specialization.
- Replace aggregate benchmark scores with item-level data where available and adapt the model toward question-level Item Response Theory to avoid arbitrary weighting artifacts (e.g., splitting one benchmark into two inflates its influence).
- Develop a principled benchmark weighting scheme (e.g., based on reliability, coverage, domain importance, error rates) and evaluate how weights affect capability and difficulty estimates.
- Measure and correct for evaluation setting heterogeneity (prompting, scaffolding, inference compute, temperature, tools) across “external” benchmarks; provide sensitivity analyses showing how these factors shift capability scores.
- Improve uncertainty quantification beyond the current sensitivity-based “error bars” and 5% loss threshold (e.g., via Bayesian hierarchical modeling, bootstrapping across models/benchmarks, and posterior intervals for C, D, α).
- Test alternative link functions and heteroscedastic error models beyond a single sigmoid per benchmark (e.g., mixture of sigmoids, probit, spline-based link) to capture non-sigmoidal score dynamics and plateaus.
- Assess whether benchmark slope parameters αb are stable over time and across evaluation protocols; investigate dynamic αb that adapt to evolving benchmark composition and scoring procedures.
- Systematically evaluate the impact of anchoring on WinoGrande (αWinoGrande=1 and DWinoGrande=0): perform anchor-swap experiments to test scale and shift invariance and to quantify anchor-induced bias in C and D.
- Report sensitivity of results to the L2 regularization strength (default = 0.1) and justify its choice; provide a hyperparameter sweep and demonstrate convergence stability under different initializations.
- Address potential overestimation of difficulties for new, unsaturated benchmarks (flat tail of sigmoid): propose calibration strategies (e.g., adaptive sampling to target mid-sigmoid regions, human/legacy model baselines).
- Expand benchmark coverage to reduce domain bias (e.g., economically relevant tasks, software engineering beyond SWE-Bench, multimodal grounded tasks, robotics/control, non-English and cross-lingual tasks).
- Introduce explicit treatment of benchmark ceilings/floors and error rates (label noise, ambiguous items) to avoid misinterpreting plateaued performance as capability limits.
- Validate out-of-sample predictive power by training on a subset of benchmarks and predicting performance on held-out benchmarks and models; report predictive metrics and failure modes.
- Incorporate speed, latency, cost, and energy as auxiliary axes of “capability” to better align the unified scale with practitioner-relevant trade-offs; explore multi-objective capability indices.
- Improve the mapping from capability to “time horizon” by expanding overlap with METR data, testing robustness across more models and domains, and validating temporal stability of the mapping as reasoning models change trends.
- Clarify and improve compute data quality: detail sources, uncertainty bounds, treatment of synthetic data generation, distillation, curriculum, and inference-time compute used during evaluation; propagate compute measurement error into algorithmic progress estimates.
- Move beyond estimating k from only three LLaMA families; add more families with documented training recipes to reduce variance and test whether k is algorithm- and scale-dependent.
- Test scale dependence of algorithmic progress explicitly (does k vary across 1021–1025 FLOPs?), rather than assuming a constant k across scales and time; quantify how this affects annual “×” estimates.
- Separate the effects of algorithmic progress and training compute more rigorously (e.g., instrumental variables, matched pairs, or controlled ablation studies) to address endogeneity and confounding.
- Reassess exclusion of distilled models: quantify how distillation and synthetic data alter the C–log(F) relation and provide corrected estimates or separate progress curves for distilled vs non-distilled lines.
- Formalize the definition of “frontier models” and test how different frontier-selection criteria affect trend slopes, breakpoints, and forecasting (e.g., top-k, Pareto front across capability/cost).
- Strengthen acceleration detection with change-point and sequential testing methods (e.g., CUSUM, Bayesian online change detection) to reduce false positives (~38% reported) and provide calibrated thresholds (targeting e.g., 5% FPR).
- Evaluate detection latency and specificity under real-world noise by integrating benchmark reliability scores, model-release cadence, and observation-window constraints; provide operational guidance for monitoring.
- Provide a plan for continuous, incremental updates (online fitting) with principled handling of identifiability, anchor stability, and time-varying benchmark properties as new models/benchmarks arrive.
- Explore cross-lab comparability audits: run standardized, replicated evaluations to reconcile internal vs external results and quantify lab-level systematic offsets or variance.
- Examine geographic, language, and modality coverage gaps and assess whether capability scores transfer across languages/cultures; add multilingual/multimodal anchors to improve generality.
- Test the forecasting method under structural breaks (e.g., paradigm shifts like reasoning models) using scenario-based and mechanistic models tied to drivers (compute trends, data availability, algorithmic innovations) rather than pure linear extrapolation.
- Publish detailed reproducibility kits: datasets, compute estimates, evaluation scripts, and benchmark metadata to enable independent replication and robust sensitivity checks across different research teams.
Practical Applications
Below are practical applications derived from the paper’s “benchmark stitching” framework, organized by deployment horizon. Each item notes sectors, potential tools/products/workflows, and assumptions or dependencies that affect feasibility.
Immediate Applications
- Unified capability index for model selection and procurement
- Sectors: software, healthcare, education, finance, government, enterprise IT
- Tools/products/workflows: Capability dashboard/API (e.g., a “Benchmark Stitching API” or the Epoch Capabilities Index); procurement checklists that reference unified scores; model cards and SLAs that include capability units and uncertainty intervals; internal evaluation portals that weight benchmarks by relevance
- Assumptions/dependencies: Requires sufficient overlap across models/benchmarks; single-dimensional capability assumption; benchmark quality (error rates, prompt/scaffold variance) affects fidelity; identifiability handled via fixed baseline (e.g., WinoGrande) doesn’t change relative comparisons
- Benchmark portfolio management and design (difficulty calibration and tiering)
- Sectors: academia, labs, benchmark creators, evaluation platforms
- Tools/products/workflows: Difficulty catalog with α (slope) and D (difficulty) to avoid saturation; tiered benchmark suites that span the “steep part of the sigmoid”; internal policies to retire saturated tasks; workflow to add new tasks where the model score is in the linear range
- Assumptions/dependencies: Sigmoidal score model; enough data per benchmark to estimate α and D; ongoing curation mitigates domain bias (math/reasoning-heavy in current set)
- Early-warning monitoring for capability accelerations
- Sectors: safety teams, policy-makers, risk officers, governance boards
- Tools/products/workflows: “Acceleration Watch” service with frontier-only monitoring, breakpoint detection, and alert thresholds; monthly fits with human-in-the-loop triage
- Assumptions/dependencies: Detection has non-trivial false positive rates on synthetic data; noise level and breadth of models evaluated strongly affect detection latency; alerts should be corroborated (e.g., with training compute, datasets, algorithmic changes)
- Roadmapping and compute budgeting using unified forecasts and algorithmic progress estimates
- Sectors: industry R&D, product management, cloud/compute planning, finance (CAPEX/OPEX), VC/PE due diligence
- Tools/products/workflows: “Capability Forecast Service” projecting frontier capability growth (e.g., ~0.55 units/year central estimate); “Algorithmic Progress Tracker” quantifying efficiency gains (central ~6× per year, with wide uncertainty); scenario planning spreadsheets and Monte Carlo ranges
- Assumptions/dependencies: Trends are naive extrapolations; future shifts in compute scaling or algorithmic breakthroughs can accelerate or slow progress; requires access to training FLOP estimates and release dates
- Task automation planning via time-horizon mapping
- Sectors: operations, BPO, enterprise transformation, education (curriculum redesign), HR/L&D
- Tools/products/workflows: Task inventory mapped to capability-derived time horizons (using time horizon ≈ exp(3.69·C − 4.58)); gating rules for which tasks to automate when models cross thresholds; pilot studies and staged rollouts
- Assumptions/dependencies: Mapping to METR time horizons is statistical (R² ~0.85) but remains an approximation; real-world deployment conditions and guardrails (cost, latency, reliability) are not captured in benchmark scores
- Model specialization detection for routing and ensemble design
- Sectors: MLOps, AI platform teams, multimodal/app builders, software engineering tooling
- Tools/products/workflows: Residual analysis reports to reveal specializations (e.g., Anthropic stronger on code, Gemini stronger on vision/multimodal); dynamic routers that select model by capability profile; evaluation A/B tests per subtask
- Assumptions/dependencies: Requires benchmarks that capture the target domains; specialization signals depend on sufficient model coverage per benchmark; scalar capability score is averaged across domains—use residuals to correct for domain-specific performance
- Transparency and communication: capability labels in public artifacts
- Sectors: model vendors, AI marketplaces, standards bodies
- Tools/products/workflows: Model cards annotated with unified capability units, benchmark coverage, uncertainty bars, and time-horizon equivalents; standardized disclosure templates for procurement and compliance
- Assumptions/dependencies: Community acceptance of a unified scale; clear caveats about benchmark limitations and domain relevance
- Research synthesis and cross-paper comparability
- Sectors: academia, research labs, meta-analysts
- Tools/products/workflows: Aggregated capability-scale comparisons across heterogeneous studies; standardized reporting of C and D with confidence intervals; replication packets that include stitched metrics
- Assumptions/dependencies: Access to benchmark scores and evaluation setups; consistent pre-processing to control for prompt/scaffold differences
- Risk management and governance triggers tied to capability units
- Sectors: safety, compliance, internal controls, audit
- Tools/products/workflows: Governance playbooks that escalate red-teaming, sandboxing, and deployment gates when unified capability crosses predefined thresholds; risk registers updated on acceleration alerts
- Assumptions/dependencies: Thresholds must be empirically validated; ability to integrate alerts into decision processes; adequate coverage of high-risk domains in benchmark portfolio
- Consumer/daily-life guidance on AI use and expectations
- Sectors: education (students/teachers), small businesses, knowledge workers
- Tools/products/workflows: Practical guidance on what tasks current models can handle (via time-horizon mapping) and where human oversight remains essential; selection tips for multimodal vs coding-heavy use cases
- Assumptions/dependencies: Public-facing explanations should include domain caveats; localized benchmark relevance (language, regulations) may vary
Long-Term Applications
- Multidimensional capability modeling (beyond a single scalar)
- Sectors: academia, labs, evaluation consortia, platform teams
- Tools/products/workflows: Multi-factor capability vectors (e.g., code, math, multimodal, tool use), PCA/IRT-style latent factors, domain-specific routers optimized for vectors rather than a scalar
- Assumptions/dependencies: Requires richer, domain-balanced benchmarks and item-level data; community consensus on factor definitions
- Item-level IRT and invariance-standardized benchmarking
- Sectors: benchmark maintainers, standards bodies, research infrastructures
- Tools/products/workflows: Question-level repositories; IRT modeling to ensure invariance to benchmark splitting/weighting; shared schemas for item metadata and evaluation provenance
- Assumptions/dependencies: Access to item-level results (often proprietary or missing); alignment on licensing; additional compute and data engineering to store/share granular outcomes
- Capability-linked regulatory frameworks and licensing
- Sectors: government, regulators, policy think tanks
- Tools/products/workflows: Risk tiers and compute permits keyed to capability thresholds; dynamic guardrails (e.g., sandbox, monitoring) that tighten when capability growth accelerates; audit protocols using stitched indices
- Assumptions/dependencies: Acceptance that unified capability correlates with real-world risk; robust governance to mitigate false positives in acceleration detection; cross-jurisdiction harmonization
- Economic forecasting and workforce planning based on capability/time-horizon trajectories
- Sectors: economics, labor ministries, HR strategists, education policy
- Tools/products/workflows: Sector-level automation models; curriculum redesign roadmaps tied to time-horizon shifts; reskilling budgets synchronized to capability growth forecasts
- Assumptions/dependencies: Translating benchmark-derived capability to economic task performance requires careful validation; external shocks (policy, hardware, data) may change trajectories
- Market infrastructure: AI ratings, insurance, and warranties
- Sectors: finance, insurance, legal, enterprise procurement
- Tools/products/workflows: Rating agencies that certify capability tiers with uncertainty; insurance products priced by capability and specialization; warranty clauses keyed to capability thresholds and benchmark coverage
- Assumptions/dependencies: Legal recognition of rating methodologies; periodic audits; transparent data feeds from vendors
- Benchmark standards and a shared marketplace
- Sectors: open-source communities, consortia, industry alliances
- Tools/products/workflows: Registry of vetted benchmarks with difficulty and slope metadata; incentives for sharing item-level results; reproducibility awards and quality badges
- Assumptions/dependencies: Governance and funding to maintain neutral infrastructure; mitigation of domain skew (e.g., more real-world tasks and tool-use benchmarks)
- Robust acceleration detection with sequential testing and multi-signal fusion
- Sectors: safety, regulators, labs
- Tools/products/workflows: Sequential analyses (e.g., CUSUM) combining stitched capabilities with signals on compute, datasets, training recipes; tiered alerting with confidence scores; public transparency reports
- Assumptions/dependencies: Access to timely, trustworthy telemetry (compute, data scale, recipe); statistical methods tuned to reduce false positives
- Compute–capability decomposition and scale-sensitive algorithmic progress modeling
- Sectors: academia, labs, forecasters
- Tools/products/workflows: Decomposition models that estimate k and b at different scales; recipe-level attribution to disentangle algorithm and compute; scenario analysis for future efficiency regimes
- Assumptions/dependencies: Transparent model families with consistent recipes; accurate FLOP accounting; enough points per family to fit scale-sensitive trends
- Compliance and contracts standardized on unified capability scales
- Sectors: enterprise IT, legal, procurement
- Tools/products/workflows: Contract templates that reference capability levels, benchmark coverage, and update cadences; obligations to re-evaluate when capability crosses thresholds; SLAs for evaluation reproducibility
- Assumptions/dependencies: Cross-industry acceptance of the scale; defined recertification cadence; legal frameworks to resolve disputes
- Continuous benchmarking in MLOps
- Sectors: software, ML platforms, DevOps
- Tools/products/workflows: CI/CD plugins that ingest benchmark results, update stitched capability scores, trigger evaluation routing and regression alarms; dataset drift detection via benchmark difficulty changes
- Assumptions/dependencies: Stable pipelines for evaluation; consistent scaffolds/prompts; mechanisms to control inference compute and tool-use variations
Notes on cross-cutting dependencies and assumptions
- Data quality and coverage: Reliable, overlapping benchmark evaluations are essential. External scores vary in scaffold/prompt; internal consistency improves fit quality.
- Modeling choices: The sigmoid form and single-dimensional capability are pragmatic simplifications; multidimensional extensions will better capture specialization.
- Mapping to real-world performance: Time-horizon mapping provides interpretability but is statistical; deployment constraints (latency, cost, reliability, tools) are not encoded.
- Forecast risk: Extrapolations do not model causal drivers (compute, algorithms, data); expect deviations if compute growth slows or agentic R&D accelerates.
- Detection specificity: Acceleration detection is useful for monitoring, not adjudication; pair with additional evidence before policy or deployment changes.
Glossary
- Additive shift: An identifiability issue where adding the same constant to both capabilities and difficulties yields the same predictions. "Additive shift: The model fits the data equally well independent of the absolute values of and ."
- Algorithmic efficiency: How effectively algorithms use compute, often measured by the reduction in compute needed to reach a given performance. "Second, we estimate the rate of improvements in algorithmic efficiency, finding estimates that are higher, but broadly consistent with prior work."
- Algorithmic progress: Improvements in algorithms over time that reduce the compute needed for a target capability or increase capability at fixed compute. "Another use case of our approach is to develop long time-series of model performance, which we can use to analyze the rate of algorithmic progress."
- Algorithmic quality: A measure of how favorable an algorithm is with respect to compute requirements for achieving a capability level. "the higher the value, the better the ``algorithmic quality" of a model, since it means less compute is needed to achieve the same ."
- Benchmark saturation: The phenomenon where benchmarks quickly reach near-maximum scores, limiting their usefulness for tracking progress. "Most AI benchmarks saturate within years or even months after they are introduced"
- Benchmark slopes: Parameters controlling how rapidly scores transition with capability on a benchmark. "We initialize the model capabilities and benchmark difficulties at 0, and the benchmark slopes at 1."
- Breakpoint: A point in time where a trend changes, such as a shift in the slope of capability growth. "we observe a breakpoint in April 2024, with a pre-break slope of 0.352/year and a post-break slope of 0.689/year."
- Compute scaling: The relationship between performance and the amount of compute used during training. "benchmark scores generally do show a roughly sigmoidal relationship with compute scaling and with time"
- Distillation: A training technique where a smaller model learns from a larger or ensemble model, often affecting compute accounting. "additional compute sources, such as from distillation or substantial quantities of synthetic data generation"
- ELO scores: A rating system originally for chess, sometimes adapted to evaluate comparative performance in AI. "unlike approaches based on ELO scores (\cite{lmarena_leaderboard}) our framework does not require crowdsourcing data collection."
- Frontier model capabilities: The highest observed capabilities at the time among released models. "Frontier model capabilities have been improving at 0.55 capability units per year"
- Item Response Theory: A statistical framework modeling latent abilities and item difficulties, often using logistic curves. "similar in spirit to Item Response Theory (\cite{ColumbiaIRT}; see \Cref{appendix:relatedwork})"
- L2 regularization: A regularization technique adding a penalty proportional to the squared magnitude of parameters to prevent overfitting. "together with regularization with a default regularization strength of 0.1."
- Least squares regression: A method that fits model parameters by minimizing the sum of squared errors between predictions and observations. "using standard least squares regression using scipy's optimize.least_squares function"
- Logit: The inverse of the logistic function, mapping probabilities to the real line for linear modeling. "fit a linear model between the logit of GPQA diamond performance and the log time horizon"
- Multiplicative rescale: An identifiability issue where scaling certain parameters by a factor and inversely scaling others yields equivalent fits. "Multiplicative rescale: The model fits the data equally well with and a rescaled version "
- Multimodal: Involving multiple input modalities (e.g., text and images) within the same model or benchmark. "on the multimodal GeoBench benchmark we see Gemini models doing better than predicted"
- Piecewise linear model: A model composed of linear segments, often used to capture changes in trend with breakpoints. "we fit a piecewise linear model with a single breakpoint"
- Principal components analysis: A dimensionality-reduction technique that identifies orthogonal directions of maximal variance. "which performs a principal components analysis using essentially the same data source as we do in this paper."
- Scaffold: The evaluation setup or procedural wrapper (e.g., prompts, tools) used when running models on benchmarks. "These generally do not use the same scaffold for different models on the same benchmark"
- Scale-independence: An assumption that relationships hold similarly across different compute scales. "for the purposes of this paper we present our results assuming scale-independence."
- Sensitivity analysis: A method to assess how changes in inputs affect outputs, used here to derive error bars. "We determine error bars through sensitivity analysis."
- Sequential testing: Statistical techniques for analyzing data as it arrives to detect changes or events in time series. "More principled methods drawing from the time series or sequential testing literatures might improve the specificity and reliability of acceleration detection."
- Sigmoidal relationship: A smooth S-shaped mapping (e.g., logistic) capturing transitions from low to high performance. "we approximate this behavior using a sigmoidal relationship."
- Slope parameter: A parameter controlling how steeply a sigmoid transitions, affecting sensitivity to capability differences. "Finally, the slope parameter controls the spread in difficulty of the tasks on benchmark ."
- Synthetic data: Data generated programmatically to simulate scenarios for analysis or testing. "In this section, we run synthetic data experiments to test whether our model can detect rapid capability accelerations."
- Time horizon: A measure of the typical human effort duration of tasks that models can perform at a given success rate. "For simplicity, we'll refer to this metric as the ``time horizon"."
- Training compute: The amount of computation used during model training, often measured in FLOPs. "it does not postulate any relationship between training compute or task length and model performance."
- Trust Region Reflective algorithm: An optimization method used for constrained least squares problems. "using the function's default optimization algorithm (Trust Region Reflective algorithm)."
- t-statistic: A statistic used to quantify the significance of an estimated parameter relative to its variability. "looking at the associated t-statistic and standard error."
- Standard error: An estimate of the variability of a parameter estimate across hypothetical repeated samples. "looking at the associated t-statistic and standard error."
Collections
Sign up for free to add this paper to one or more collections.