- The paper demonstrates that firm size and valuation drive LLM confidence, indicating a substantial representation bias in financial AI.
- The methodology employs round-robin prompting and token-logit aggregation across 150 U.S. firms to quantify model preferences.
- Statistical tests reveal that industry classification and sector anchoring significantly affect bias stability, underscoring the need for calibration.
Systematic Analysis of Representation Bias in Open-Source Financial LLMs
Introduction
This paper presents a rigorous empirical investigation into representation bias in open-source Qwen LLMs applied to investment decision support. The study addresses a critical gap in financial AI research: the extent to which LLMs encode and propagate biases related to firm size, sector, and financial characteristics, potentially distorting risk assessment and capital allocation. The authors introduce a balanced round-robin prompting protocol over a curated universe of U.S. equities, leveraging constrained decoding and token–logit aggregation to quantify firm-level confidence scores across multiple financial contexts. The analysis spans several Qwen model variants and employs robust statistical inference to dissect the determinants, stability, and empirical grounding of LLM confidence in investment scenarios.
Methodology
The experimental design encompasses approximately 150 U.S.-listed firms from 2017–2024, with monthly standardized financial features covering valuation, health, profitability, risk, market structure, growth, dividend, and technical metrics. Firms are classified by sector and industry using GICS codes. The core protocol involves pairwise firm comparisons under multiple prompt categories (e.g., fundamentals, technicals, risk, growth), with two prompt variants to control for phrasing effects. Each model returns a ticker selection and a confidence score derived from token-level log-probabilities, aggregated to yield firm-level preference intensities.
Statistical analysis includes Pearson, Spearman, and Kendall correlations (with BH-FDR correction), one-way ANOVA for categorical effects, and dispersion metrics (SD, MAD) for cross-context stability. The study addresses three research questions: (1) Which firm-level features most influence LLM confidence? (2) How stable are LLM preferences across financial contexts? (3) Do high-confidence outputs align with superior empirical financial performance?
Determinants of LLM Confidence
The results demonstrate that LLM confidence is most strongly and consistently driven by firm size and valuation proxies—market capitalization, enterprise value, shares outstanding, float shares, and free cash flow. These features exhibit robust positive correlations with model confidence across all Qwen variants and correlation methods, whereas profitability, technical indicators, risk, and growth metrics show weaker or inconsistent associations.
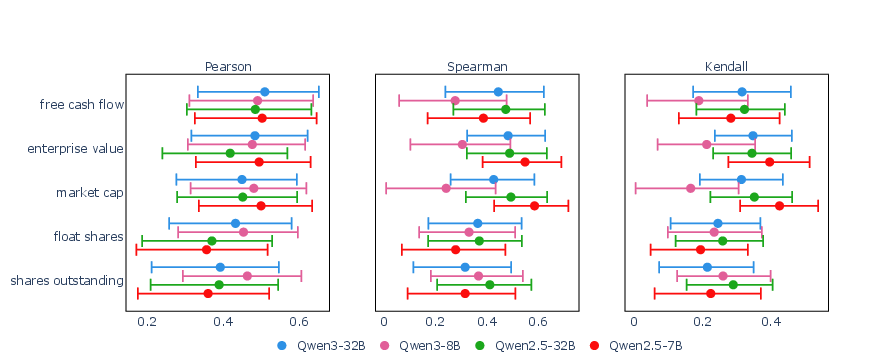
Figure 1: Determinants of LLM confidence by model and correlation type, highlighting the dominance of size and valuation features.
One-way ANOVA reveals that industry classification explains a substantial share of variance in LLM confidence (η2≈0.52–$0.67$), with sector effects also significant but more modest (η2≈0.16–$0.31$). This indicates that LLMs are particularly sensitive to industry category, with sector playing a secondary role. Communication Services and Technology sectors elicit higher confidence, while Consumer Defensive and Energy are less favored. At the industry level, Capital Markets, Entertainment, Internet Content, and Software Infrastructure are preferred over Tobacco, Packaged Foods, and Lodging.
Cross-Context Stability and Sectoral Anchoring
Analysis of within-firm dispersion in confidence scores across prompt categories reveals pervasive anchoring effects, with sectoral ordering highly consistent across models. Technology exhibits the highest within-sector dispersion (SD and MAD), indicating lower cross-context stability and greater heterogeneity in LLM preferences. Sectors such as Consumer Discretionary, Industrial, and Financial display tighter stability.
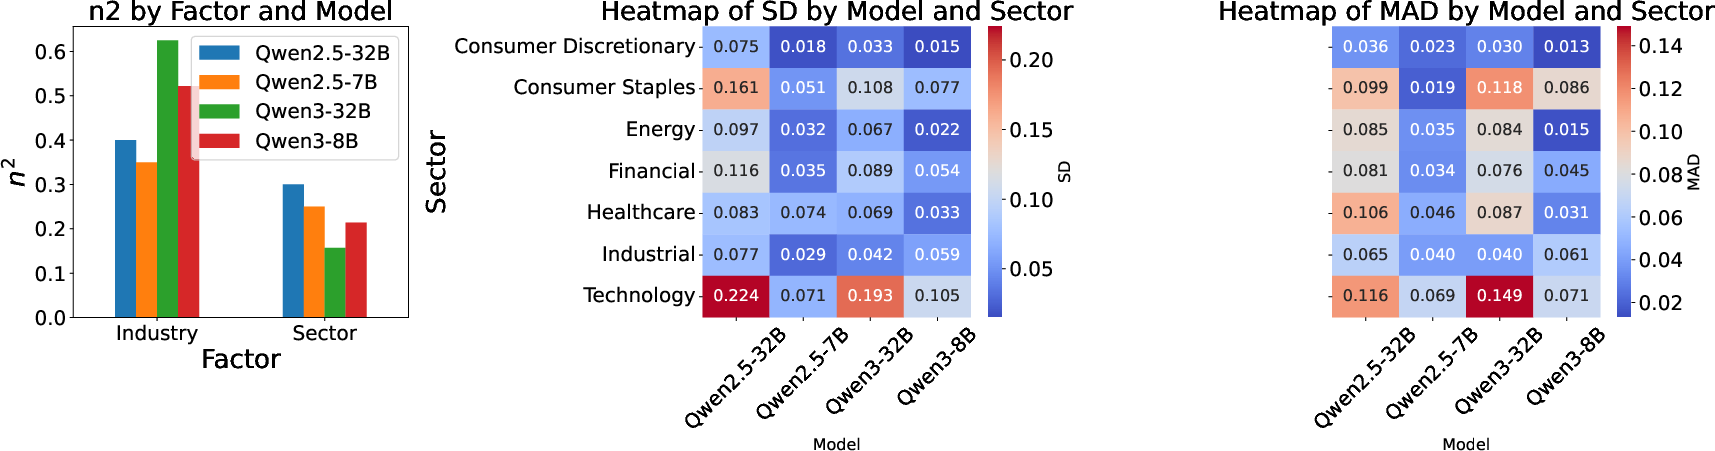
Figure 2: (Left) Effect sizes across models and factors; (Middle, Right) Heatmap of cross-context stability across sectors and models, showing sectoral anchoring and variability.
Model scale influences stability: Qwen2.5-32B displays the greatest context sensitivity, suggesting that larger models adapt more flexibly to different financial contexts, while smaller models anchor more tightly. This is consistent with scaling-law effects, where increased model capacity enables more nuanced context-dependent behavior.
Alignment with Empirical Financial Metrics
Under category-specific prompts, LLM ranking preferences align most strongly with fundamental metrics, particularly free cash flow, which shows significant positive correlations across all models. Technical metrics such as average trading volume also exhibit moderate positive associations, confirming model sensitivity to market activity. Risk features (e.g., beta, volatility) display negative or weak correlations, indicating higher LLM confidence for lower-risk firms. The strength and direction of these relationships vary by model, with no clear advantage in scale or architecture.
These findings indicate that, when explicitly guided by context-specific prompts, LLMs can partially ground their preferences in relevant empirical financial data. However, the alignment is incomplete and variable, underscoring the influence of representation bias and the need for targeted calibration.
Implications and Future Directions
The evidence demonstrates that open-source Qwen LLMs internalize economically meaningful financial structures but are also shaped by representation biases favoring firm size, visibility, and sector-specific priors. For practical deployment in financial decision support, model governance should incorporate:
- Bias Calibration: Adjust outputs to mitigate size and sector biases, especially in portfolio and risk management applications.
- Category-Specific Prompting: Employ targeted prompts and post-hoc consistency checks to enhance reliability and fairness.
- Stability Diagnostics: Monitor dispersion measures (SD/MAD on the logit scale) alongside performance metrics to assess model robustness.
The current analysis is limited to a specific universe of U.S. firms and pre-specified feature sets; results may differ with broader sampling or in non-U.S. markets. Correlations are descriptive, not causal, and out-of-sample trading performance is not evaluated. Future research should explore debiasing pipelines, counterfactual and mechanistic explanations of category priors, and the interplay of model scale versus architecture under controlled data curation.
Conclusion
This study provides a systematic, multi-method assessment of representation bias in open-source financial LLMs, revealing that firm scale, valuation, and market structure are the primary drivers of model confidence, with sector and industry effects exerting substantial influence. LLMs exhibit partial grounding in empirical financial metrics under category-specific prompts but remain susceptible to biases that may compromise fairness and reliability in high-stakes investment applications. Sector-aware calibration, prompt engineering, and stability diagnostics are recommended for safe and effective deployment. The findings motivate further research into bias mitigation, model interpretability, and the development of governance frameworks for financial AI.