CoDA: Agentic Systems for Collaborative Data Visualization
Abstract: Deep research has revolutionized data analysis, yet data scientists still devote substantial time to manually crafting visualizations, highlighting the need for robust automation from natural language queries. However, current systems struggle with complex datasets containing multiple files and iterative refinement. Existing approaches, including simple single- or multi-agent systems, often oversimplify the task, focusing on initial query parsing while failing to robustly manage data complexity, code errors, or final visualization quality. In this paper, we reframe this challenge as a collaborative multi-agent problem. We introduce CoDA, a multi-agent system that employs specialized LLM agents for metadata analysis, task planning, code generation, and self-reflection. We formalize this pipeline, demonstrating how metadata-focused analysis bypasses token limits and quality-driven refinement ensures robustness. Extensive evaluations show CoDA achieves substantial gains in the overall score, outperforming competitive baselines by up to 41.5%. This work demonstrates that the future of visualization automation lies not in isolated code generation but in integrated, collaborative agentic workflows.
Paper Prompts
Sign up for free to create and run prompts on this paper using GPT-5.
Top Community Prompts
Explain it Like I'm 14
A simple explanation of “Agentic Systems for Collaborative Data Visualization”
Overview
This paper is about building an AI “team” that can turn plain-English requests (like “show sales trends by region”) into clear, correct, and good-looking charts—without a human writing all the code. The system, called CoDA (Collaborative Data Visualization Agents), uses several specialized AI helpers that work together, like a group project, to understand what you want, examine the data, plan the chart, write the code, fix mistakes, and check the final picture.
Key questions the paper asks
Here are the main things the researchers wanted to find out:
- Can a team of specialized AI agents make better charts than a single AI working alone?
- Can the AI handle messy, complex data—especially when it’s spread across multiple files?
- Is it smarter to first look at “metadata” (summary info about the data) instead of trying to load all the raw data at once?
- Do feedback loops (where the AI checks its own work and tries again) lead to better results?
How they did it (in everyday language)
The “team of AI helpers” idea
Instead of one AI doing everything, CoDA uses multiple agents, each with a job—like a well-organized classroom project. They pass notes to each other and improve the work step by step. The process has four phases:
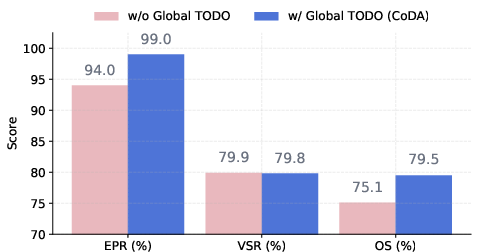
- Understanding: The AI reads your request and figures out what kind of chart and data steps are needed. It makes a “global TODO list” to keep everyone aligned.
- Planning: The AI picks chart types, styling, and finds helpful code examples (like looking up how to make a heatmap in a cookbook).
- Generation: The AI writes Python code to make the chart, runs it, and fixes errors if something breaks.
- Self-Reflection: The AI scores the generated image for clarity, accuracy, and look-and-feel. If the score isn’t good enough, it tells the team what to improve and tries again.
To keep things efficient, the system focuses on metadata—quick summaries like “what columns exist,” “how many rows,” or “basic statistics.” Think of metadata as a book’s table of contents and blurb. You don’t need to read the whole book to decide if it’s relevant. This avoids overwhelming the AI with too much raw data at once.
What the agents do (short and simple)
- Query Analyzer: Understands your request and lists all the tasks needed.
- Data Processor: Reads data summaries (metadata) and spots patterns or needed steps (like “we should average by month”).
- VizMapping Agent: Chooses chart types and maps data to visuals (like “X-axis is time, Y-axis is sales”).
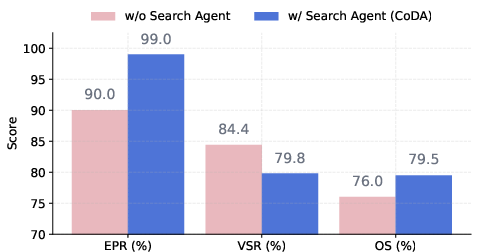
- Search Agent: Finds useful code examples from libraries (like Matplotlib) to guide coding.
- Design Explorer: Suggests colors, layouts, and design tweaks to make the chart clearer and nicer.
- Code Generator: Writes the Python code and explains what it does.
- Debug Agent: Runs the code, finds errors, and fixes them.
- Visual Evaluator: Looks at the final image and gives scores and feedback.
Main findings and why they matter
Results
The researchers tested CoDA on popular visualization benchmarks:
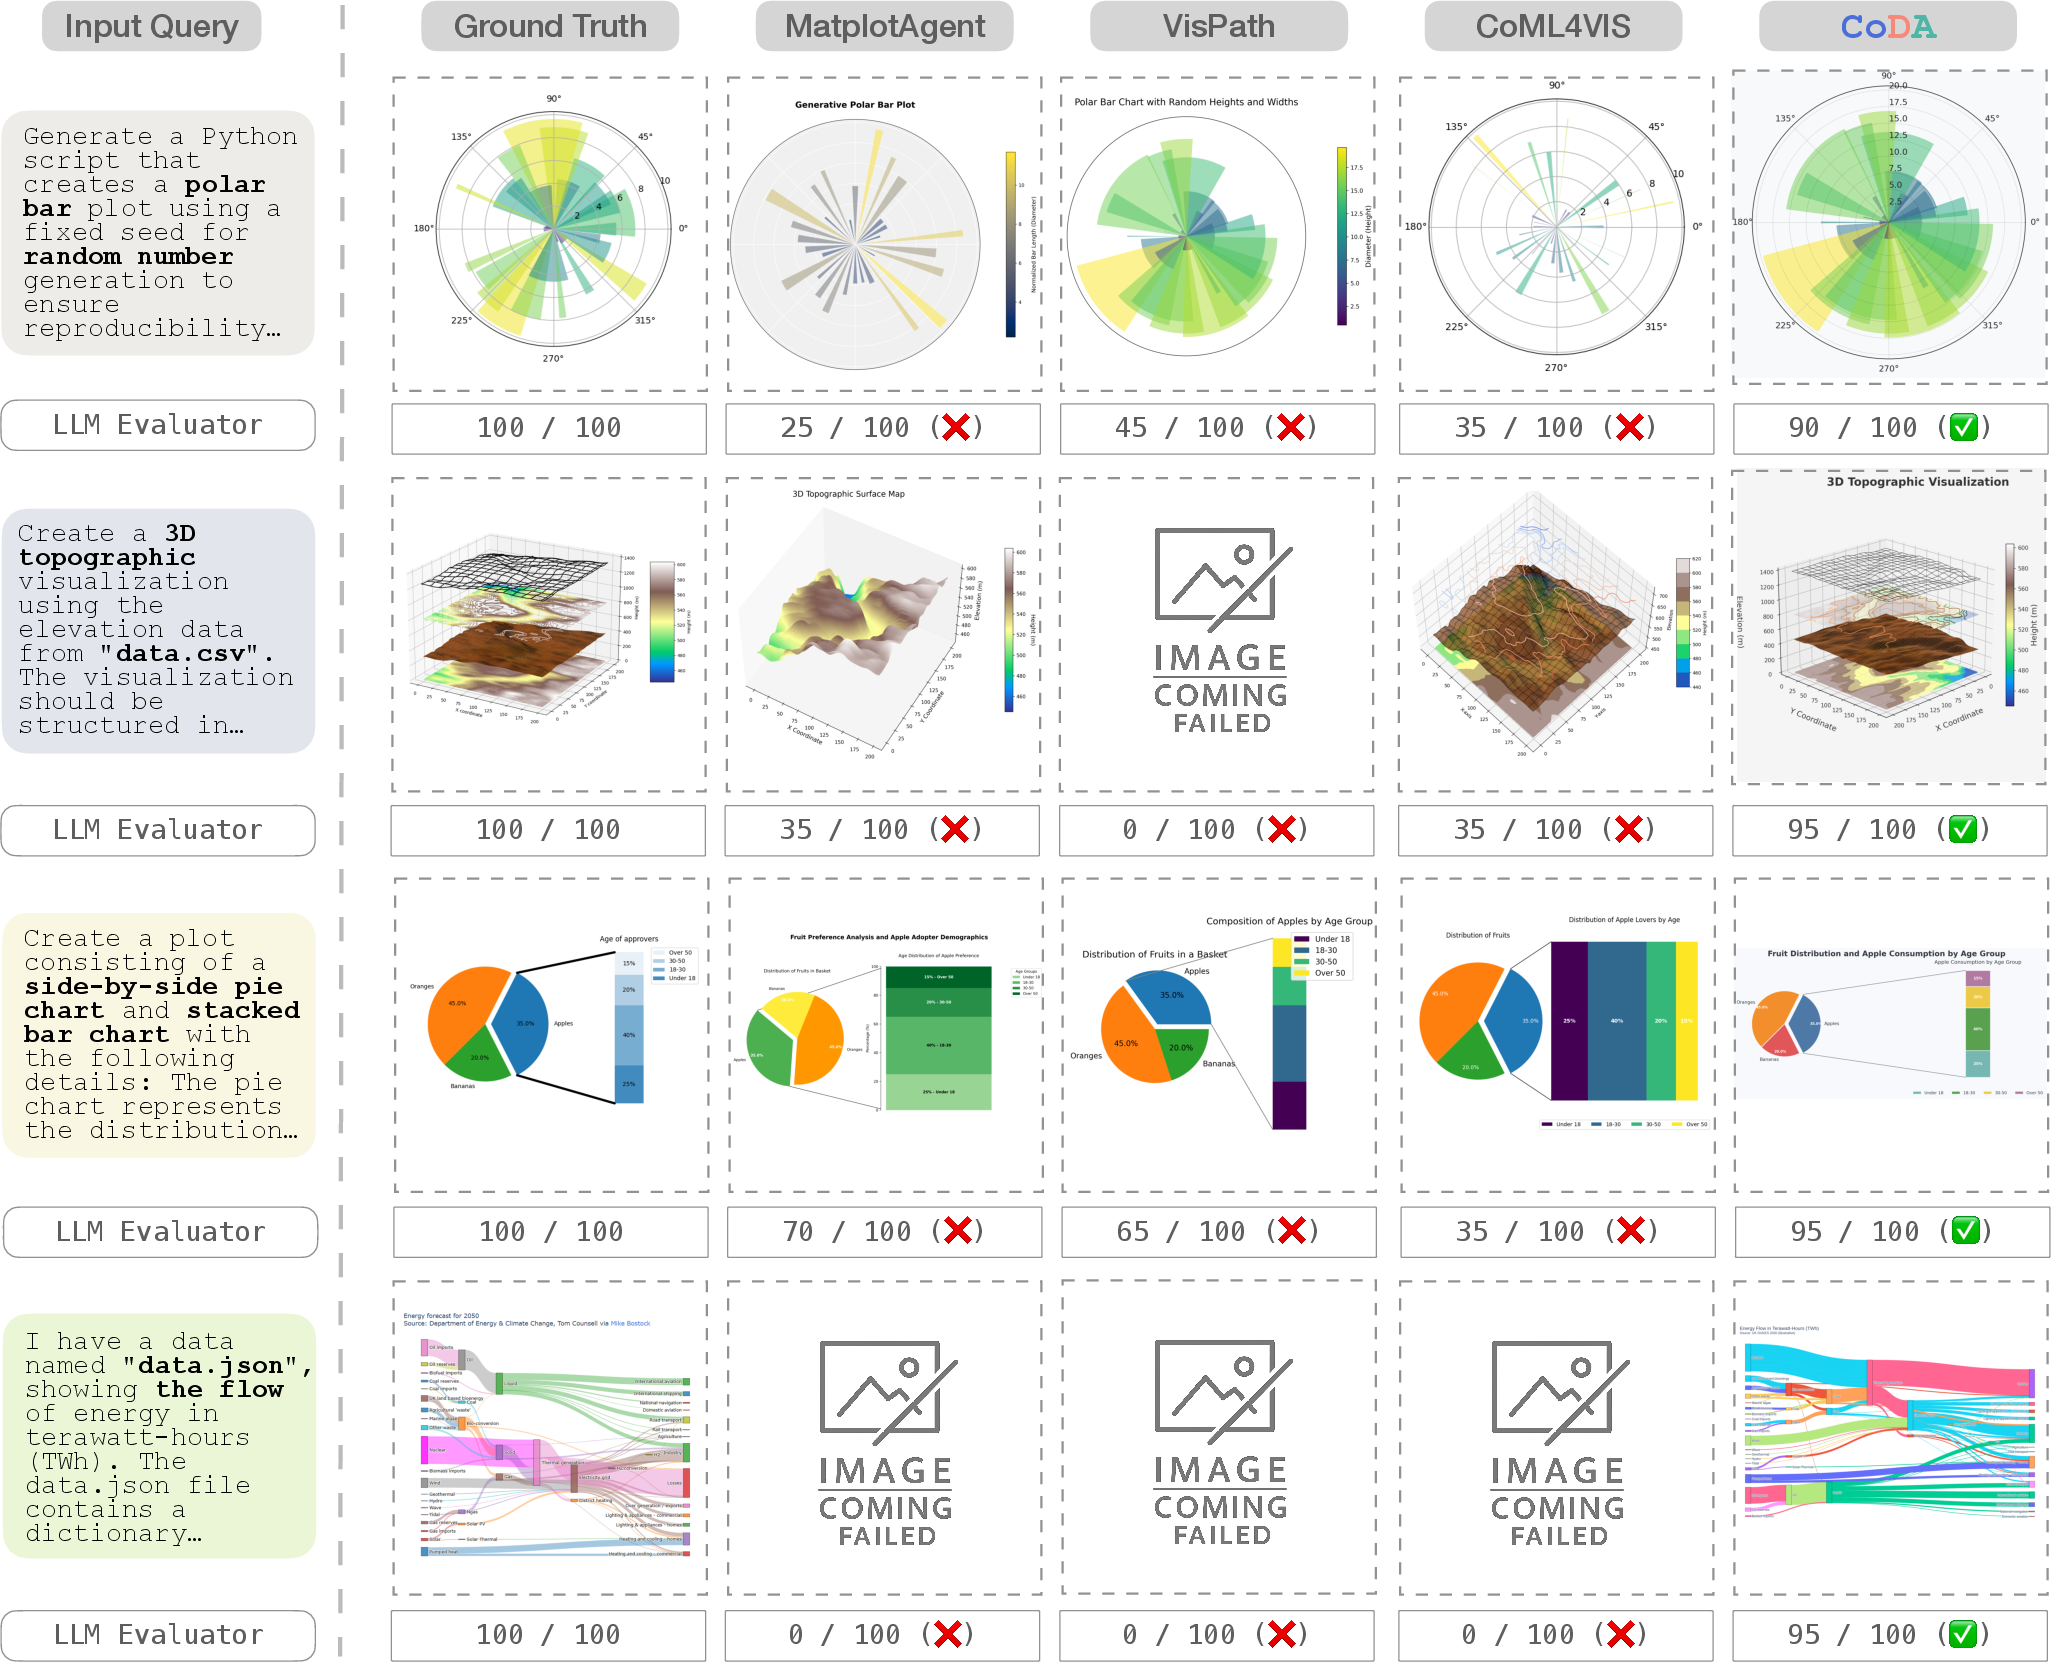
- MatplotBench and the Qwen Code Interpreter (visualization subset): CoDA’s charts ran successfully more often and matched the intended design better than other systems.
- Overall performance gains were big—up to 41.5% better than strong baselines on some tests.
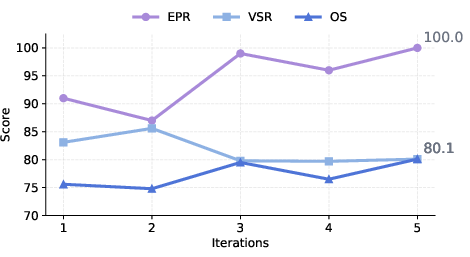
- On MatplotBench, CoDA reached very high code execution reliability (up to 99%) and strong visualization quality (around 80%).
- On DA-Code (a tougher, real-world software engineering benchmark), CoDA scored 39%, clearly beating the best competing system using the same AI backbone (about 19%).
Why it’s important
- It saves time: Data analysts often spend much of their day preparing data and refining charts. CoDA cuts down on this “unseen tax.”
- It handles complexity: Real-world data can be messy and spread across multiple files. CoDA’s metadata-first strategy and team workflow cope with this better than single-shot systems.
- It improves quality: The AI doesn’t just generate code—it also checks the final image and iterates until it meets quality standards.
Implications and impact
- A team beats a solo player: The future of chart-making automation likely won’t rely on one “giant” AI doing everything at once. Instead, multiple specialized agents collaborating and self-correcting will produce better, more reliable results.
- Beyond visualization: This teamwork approach could help in other data tasks—like data cleaning, reporting, dashboards, and even parts of software engineering where visuals must integrate into larger projects.
- What’s next: The main trade-off is extra computation (more AI calls and messages). Future work could make the agents lighter, faster, and more multimodal (using both text and images). Even so, the paper shows a clear path forward: smarter, collaborative AI workflows that focus on quality, not just code generation.
Knowledge Gaps
Knowledge gaps, limitations, and open questions
Below is a focused list of what remains missing, uncertain, or unexplored in the paper, framed to guide concrete future research:
- Human-centered evaluation is absent: no user studies on usability, trust, interpretability, or satisfaction across realistic analyst workflows and collaborative, iterative refinement.
- Reliance on LLM-based image judging (VSR/OS) without human raters or ground-truth references risks evaluation bias; no inter-rater reliability, calibration, or agreement metrics reported.
- Potential judge–generator coupling: unclear if the same or closely related LLM family is used for both generation and evaluation, risking optimistic bias; no cross-model, blinded judging baseline.
- Limited task coverage: benchmarks emphasize matplotlib-style static plots; no evaluation on interactive dashboards, narrative visualizations, animation, or cross-tool ecosystems (e.g., Altair/Vega-Lite, Plotly, D3, ggplot2).
- Geospatial, network, very high-dimensional, and truly 3D/volumetric visualization tasks are not systematically evaluated despite claims about handling complexity.
- Metadata-only preprocessing is underspecified: how summaries are computed, validated, and how much information loss occurs vs. raw data ingestion remains unclear; no tests on scenarios where critical insights are only visible in raw distributions or local anomalies.
- No analysis of robustness when metadata is noisy, incomplete, inconsistent, or adversarially corrupted (e.g., mismatched schemas across files).
- Ambiguity handling remains anecdotal: no controlled study measuring when and how agents solicit clarifying questions, resolve vague intents, or recover from contradicting requirements.
- Absence of principled guarantees for multi-agent coordination (convergence, stability, avoidance of oscillation); the reflection threshold and iteration limits are heuristic with no sensitivity analysis beyond iteration count.
- Efficiency analysis omits wall-clock latency, dollar cost, and tool execution overhead; only token I/O and call counts are reported, limiting operational relevance and deployment planning.
- Scalability is untested for truly large-scale settings (e.g., multi-GB datasets, thousands of files, large monorepos) where metadata extraction and tool execution latency dominate.
- Debug and Search Agents rely on web retrieval without detailing security, sandboxing, provenance, or licensing compliance; risks from executing externally sourced snippets are not mitigated or measured.
- Reproducibility concerns: network-dependent retrieval and “web-searched fixes” may yield non-deterministic runs; no caching, version pinning, or provenance tracking strategy is described.
- Environment management is unspecified: no details on dependency resolution, Python/library version pinning, environment isolation, or cross-platform reproducibility.
- Failure modes are not systematically analyzed (e.g., incorrect statistical transformations, misleading encodings, color mapping errors, accessibility issues like colorblind safety).
- Ethical and safety considerations are not addressed: avoiding misleading visualizations, disclosure of uncertainty, bias amplification, privacy of ingested data, and governance for sensitive datasets.
- Limited ablations: while iterations, global TODO, and Search Agent are studied, there is no role-by-role ablation for VizMapping, Design Explorer, Visual Evaluator, or Data Processor to quantify each module’s marginal utility.
- OS metric design and “code quality score” are insufficiently specified; no transparency on rubric, component weights, or external validation correlating OS with end-user utility.
- Cross-domain generalization is untested: no evidence the system adheres to domain-specific visualization conventions (medical, finance, climate) or statistical best practices.
- Language and locale generalization is not explored: performance on non-English queries, multilingual metadata, region-specific formats (dates, numerals), or right-to-left scripts is unknown.
- Handling of non-tabular data modalities (images, logs, PDFs, unstructured text, time-series with irregular sampling, event streams) is not evaluated; integration remains an open design question.
- Human-in-the-loop control is missing: mechanisms for incorporating user edits, constraints, and domain knowledge mid-iteration (and their impact on quality/latency) are not studied.
- Agent memory design is underspecified: no details on memory schema, conflict resolution, stale context detection, or memory bloat mitigation during long runs.
- Overfitting risk to chosen benchmarks: iteration limits and thresholds appear tuned on validation without cross-benchmark generalization analysis; no leave-one-benchmark-out testing.
- Robustness to dependency/version drift in target projects (e.g., DA-Code repos) is not assessed; how agents detect and adapt to environment conflicts remains unclear.
- Limited baseline breadth: comparisons exclude strong single-agent/tool-augmented code interpreters and state-of-the-art commercial code-assistants; unclear if simpler tool-augmented single models can close the gap.
- Accessibility and inclusivity are not evaluated (colorblind palettes, font sizes, contrast ratios, screen-reader compatibility), despite Design Explorer claims on aesthetics.
- No analysis of catastrophic or silent failure: how the Visual Evaluator detects semantically incorrect yet plausible-looking plots, and how such risks are mitigated.
- Unclear licensing/open-source status: availability of code, prompts, agent configs, and evaluation harnesses for replication is not specified.
- Limited exploration of adaptive halting/policies: no learning-based controller or cost–quality trade-off optimization for choosing when to reflect, which agents to invoke, or how to allocate tokens.
Practical Applications
Overview
The paper proposes CoDA (Collaborative Data-visualization Agents), a multi-agent LLM framework that automates data visualization from natural language across complex, multi-file datasets. CoDA uses specialized agents for metadata analysis, planning, code generation, debugging, and image-based evaluation, achieving substantial gains over baselines on multiple benchmarks. Below are actionable applications derived from CoDA’s findings, methods, and innovations, grouped by deployment horizon and linked to relevant sectors, potential tools, and dependencies.
Immediate Applications
The following applications can be deployed now with existing tools, Python runtimes, and enterprise integrations.
- Business Intelligence and Analytics
- A “CoDA Plug-in” for BI tools (e.g., Looker, Tableau, Power BI) that converts business queries into accurate, aesthetically consistent charts, even from multiple CSVs or spreadsheet tabs.
- Sector: software, finance, operations
- Potential products/workflows: Looker-CoDA Extension, Tableau VizCopilot, Power BI CoDA Connector
- Assumptions/dependencies: Python/LLM backend, corporate data connectors, access-controlled metadata reading, organizational style guides
- Notebook Copilot for Data Scientists
- Jupyter/Colab extension that turns natural language prompts into executable plotting code with iterative refinement and a visualization QA pass.
- Sector: software, research, education
- Potential products/workflows: “CoDA Notebook Copilot,” VS Code extension; hooks for pandas/Matplotlib/Plotly/Seaborn
- Assumptions/dependencies: Python environment, package management (pip/conda), local or hosted LLM, GPU/CPU resources
- Visualization QA Linter in CI/CD
- A GitHub Action that builds plots in PRs and uses CoDA’s Visual Evaluator to flag clarity, accuracy, layout, and style issues before merge.
- Sector: software engineering, research reproducibility
- Potential products/workflows: “viz-check” GitHub Action, GitLab CI templates, pre-commit hooks
- Assumptions/dependencies: reproducible environments (requirements.txt), test data fixtures, style policies, image diffing
- ChatOps for Fast Ad-hoc Charting
- Slack/Teams bot that accepts files (CSV/Excel) and prompts, returns refined charts and code; supports iterative feedback loops in conversation.
- Sector: business operations, media/journalism
- Potential products/workflows: “SlackPlotBot,” Teams-CoDA Bot
- Assumptions/dependencies: bot permissions, secure file handling, rate limits, access to LLM and Python runtime
- Report Generation and Automation
- Scheduled pipelines that produce weekly executive dashboards and PDF visuals from operational data using CoDA’s planning and evaluation loop.
- Sector: finance, retail, operations
- Potential products/workflows: Airflow “CoDAOperator,” dbt post-run visualization, templated reporting notebooks
- Assumptions/dependencies: data access policies, Airflow/dbt integration, auto-scaling compute, chart templating
- Metadata-Driven Data Catalog Exploration
- CoDA’s metadata-centric analyzer integrated with a data catalog to suggest chart types, transformations, and quality checks without exposing raw data to LLM context.
- Sector: data governance, enterprise analytics
- Potential products/workflows: “CatalogViz Assist” within Collibra/Alation; schema-to-viz helpers
- Assumptions/dependencies: catalog APIs, schema/stats extraction, privacy guardrails, PII masking
- Education and Instructional Support
- Autograder and tutor that evaluates student plots for correctness and readability; suggests improvements tied to course rubrics.
- Sector: education
- Potential products/workflows: LMS plug-ins (Canvas, Moodle), grading notebooks with Visual Evaluator
- Assumptions/dependencies: curated datasets, grading criteria, sandboxed execution
- Newsroom Data Visualization Assistant
- Tool for data journalists to rapidly generate publication-ready charts from sources like public datasets, FOIA releases, or spreadsheets.
- Sector: media/journalism
- Potential products/workflows: newsroom “CoDA Desk,” CMS integration for chart reuse
- Assumptions/dependencies: editorial style guides, proofing workflows, fact-checking scripts
- Healthcare Operations Dashboards (Non-clinical)
- Rapid creation of operational visuals (e.g., wait times, throughput, capacity) from EHR exports while using metadata-centric preprocessing to reduce PHI exposure.
- Sector: healthcare administration
- Potential products/workflows: on-prem “CoDA for Ops,” scheduled metrics dashboards
- Assumptions/dependencies: strict data governance, de-identification, local deployment, audit logging
- Energy/IoT Time-Series Visuals
- Automated plotting for sensor data across sites and device types with iterative refinement for multi-source alignment and readability.
- Sector: energy, manufacturing, smart infrastructure
- Potential products/workflows: SCADA-to-Chart helper, anomaly summary visuals, site-level comparison dashboards
- Assumptions/dependencies: connectors to time-series stores (InfluxDB/TimescaleDB), data normalization, latency budgets
- Accessibility and Branding Enforcement
- Design Explorer used as a “style and accessibility linter” to enforce WCAG contrast, brand palettes, and layout standards in organizational charts.
- Sector: enterprise governance, public-sector communications
- Potential products/workflows: Accessibility QA pipeline, brand style enforcement in CI
- Assumptions/dependencies: defined brand/style libraries, accessibility criteria, templating
Long-Term Applications
These applications require further validation, scaling, domain-specific extensions, or regulatory alignment before widespread deployment.
- Autonomous Data-to-Dashboard Systems
- End-to-end agents that generate entire dashboards (multiple linked charts, filters, narratives) from natural language requests and evolving multi-source data.
- Sector: enterprise analytics, product analytics
- Potential products/workflows: “CoDA Dashboard Studio,” interactive refinement loops with persistent global TODO
- Assumptions/dependencies: robust cross-source data joining, real-time updates, user-in-the-loop guardrails, performance SLAs
- Real-Time Agentic Visualization on Streaming Data
- Low-latency agents for streaming telemetry (e.g., IoT, financial ticks) producing continuous visual narratives with alert-driven refinements.
- Sector: energy, manufacturing, finance (trading ops)
- Potential products/workflows: “StreamViz Agents,” event-triggered chart updates and quality checks
- Assumptions/dependencies: high-throughput event processing, fast LLMs (Flash/edge), stateful agents, observability
- Policy and Open Data Portals
- Citizen-facing portals where natural language requests yield transparent, validated charts from public datasets, with accessibility and bias checks.
- Sector: government, NGOs
- Potential products/workflows: “Ask-Open-Data” portals with CoDA; viz provenance records and reproducibility bundles
- Assumptions/dependencies: trust frameworks, audit trails, domain-specific validations, multilingual support
- Clinical Decision Support Visualizations
- Agentic visualization embedded into clinician workflows for explainable, standardized views of outcomes, cohorts, and trends (non-diagnostic to start).
- Sector: healthcare
- Potential products/workflows: EHR-integrated “CoDA Viz Panels,” cohort exploration assistants
- Assumptions/dependencies: rigorous validation, HIPAA/PHI compliance, clinical governance, human oversight, FDA/regulatory pathways
- Regulated Financial Reporting and Stress Test Visuals
- Automated generation of compliance-grade charts with audit trails, scenario controls, and reproducibility guarantees.
- Sector: finance, insurance
- Potential products/workflows: “RegViz Agents,” automated stress-test visuals for CCAR/Solvency II submissions
- Assumptions/dependencies: policy-aligned templates, strict provenance, versioning, attestation mechanisms
- Cross-Modal Visualization Agents
- Extending beyond tabular plotting to geospatial maps, network graphs, 3D plots, images, and multimodal dashboards.
- Sector: geospatial intelligence, logistics, scientific modeling
- Potential products/workflows: “Geo-CoDA,” 3D/AR visualization composer, multimodal evaluators
- Assumptions/dependencies: domain libraries (GIS/Carto), spatial joins, multimodal LLMs, rendering pipelines
- Distilled/Edge-Deployed Agent Teams
- Lightweight, cost-efficient agents running on-prem or edge devices to preserve privacy and reduce inference cost.
- Sector: regulated industries, field operations
- Potential products/workflows: “CoDA-Lite,” model distillation kits, hardware-aware schedulers
- Assumptions/dependencies: agent distillation research, hardware constraints, offline example stores
- Standardized Visualization QA Frameworks
- Industry-wide standards for automated chart evaluation (clarity, accuracy, aesthetics, accessibility), with certification and automated enforcement.
- Sector: cross-industry governance
- Potential products/workflows: “VizQA Standard Suite,” auditor dashboards, scorecards
- Assumptions/dependencies: consensus metrics, third-party evaluators, benchmarking datasets, policy acceptance
- Multilingual and Cross-Cultural Visualization Assistants
- Agents that parse and generate visualizations across languages and adapt styles for cultural conventions (number formats, color semantics).
- Sector: global enterprises, public-sector communications
- Potential products/workflows: multilingual “CoDA Global,” locale-aware style libraries
- Assumptions/dependencies: multilingual LLMs, cultural UX research, locale-aware rendering
- Knowledge Graph and Data Lineage Integration
- Agents that leverage lineage and semantic metadata to select appropriate transformations and guard against misinterpretation.
- Sector: data governance, enterprise analytics
- Potential products/workflows: “Lineage-Aware Viz Agents,” semantic typing and constraint checks
- Assumptions/dependencies: maintained knowledge graphs, lineage tracking, schema ontologies
- Co-Creative Teammate for Analytics Squads
- Persistent agent collaborators that track team context, shared TODOs, and design choices over time, reducing cognitive load and rework.
- Sector: enterprise analytics, product teams
- Potential products/workflows: “Analytics Co-Worker,” workspace memory, team-level style and goal alignment
- Assumptions/dependencies: shared memory stores, privacy/permissions, team workflow integration
- Research Reproducibility Pipelines
- Automated figure generation with provenance artifacts (code, data hashes, config) for papers and grants.
- Sector: academia, R&D labs
- Potential products/workflows: “Repro-Viz Bundles,” DOI-linked figure regeneration
- Assumptions/dependencies: archival storage, metadata completeness, journal acceptance of automated provenance
Cross-Cutting Assumptions and Dependencies
- LLM performance and cost: quality depends on capable models (e.g., Gemini 2.5, Claude); iterative loops incur token and latency costs; distillation or caching may be needed.
- Execution environment: consistent Python stack with plotting libraries (Matplotlib/Seaborn/Plotly), sandboxed code execution, dependency management.
- Data access and privacy: secure connectors; metadata-centric preprocessing reduces LLM token exposure but still requires robust governance for PHI/PII.
- Retrieval quality: example search requires curated repositories or internet access; offline corpora and ranking improve reliability.
- Evaluation robustness: image-based evaluation and LLM scoring can misjudge; thresholds and human-in-the-loop checkpoints mitigate risks.
- Domain extensions: specialized chart types (geospatial, networks, 3D) need additional toolchains and agents.
- Organizational adoption: style guides, accessibility standards, and compliance frameworks should be formalized to realize QA and governance benefits.
Glossary
- Ablation: A controlled removal or modification of components to assess their impact on performance. "we conduct controlled ablation experiments on the MatplotBench dataset"
- Agentic alignment: The degree to which an agent-based system's behaviors and coordination mechanisms are appropriately aligned to the task and context. "This shallow agentic alignment contributes to vulnerabilities in complex scenarios"
- Agentic systems: Systems composed of autonomous agents collaborating to solve complex tasks. "Agentic systems mark a paradigm shift in visualization for data science"
- Backbone LLM: The primary LLM that underpins a system or pipeline. "Performance with Different Backbone LLMs"
- Backbone-agnostic design: An approach that works across different underlying models without being tied to any single one. "backbone-agnostic design"
- Binary-scored benchmark: An evaluation where outcomes are scored as strictly correct or incorrect. "On a binary-scored benchmark (e.g., Qwen Code Interpreter)"
- Chain-of-thought prompting: A prompting technique that elicits step-by-step reasoning from LLMs to improve problem solving. "leverage chain-of-thought prompting to generate visualizations"
- Collaborative multi-agent paradigm: A design pattern where multiple specialized agents coordinate to complete a task. "The Collaborative Multi-Agent Paradigm"
- Context window limit: The maximum sequence length (in tokens) that an LLM can process at once. "we circumvent context window limit of LLMs"
- DA-Code benchmark: A benchmark of repository-based software engineering tasks, including visualization components. "DA-Code benchmark"
- Data-to-visual bindings: Mappings that connect data fields to visual encodings (e.g., axes, color). "defines data-to-visual bindings"
- Emergent capabilities: Higher-level, often unexpected abilities that arise from large-scale model training. "emergent capabilities of LLMs"
- Execution Pass Rate (EPR): The proportion of tasks whose generated code runs without errors. "Execution Pass Rate (EPR):"
- Feedback loops (quality-driven): Iterative cycles where outputs are evaluated and used to guide further improvements based on quality metrics. "quality-driven feedback loops"
- Global TODO list: A structured, cross-agent plan that enumerates subtasks and priorities for the pipeline. "global TODO list"
- Hallucinations: Fabricated or incorrect outputs produced by an LLM that are not grounded in input data. "risking token limit violations, hallucinations"
- Image-based evaluation: Assessing visualization quality using the rendered image rather than only code or text. "image-based evaluation verifies the completion"
- Iterative refinement: Repeatedly improving outputs through cycles of feedback and modification. "iterative refinement"
- LLMs: Transformer-based models trained on vast text corpora to perform language understanding and generation. "LLMs"
- MatplotBench: A benchmark of natural-language visualization tasks targeting matplotlib-based plotting. "MatplotBench"
- Metadata schemas: Structured descriptions of data (e.g., fields, types, shapes) used to guide processing without loading raw data. "metadata schemas and statistics"
- Metadata-Centric Preprocessing: A strategy that focuses on summarizing data structure and stats rather than ingesting raw data. "Metadata-Centric Preprocessing:"
- Multi-agent frameworks: Systems that organize multiple agents with specialized roles into a coordinated workflow. "Multi-agent frameworks, such as VisPath and MatplotAgent"
- Multi-path reasoning: Exploring multiple reasoning paths or solution candidates before selecting or aggregating the best. "multi-path reasoning"
- Multimodal inputs: Inputs that combine different data types or modalities (e.g., text, images, code). "multimodal inputs"
- Natural Language to Visualization (NL2Vis): Methods that convert natural-language queries into target visualizations. "Natural Language to Visualization (NL2Vis)."
- Overall Score (OS): An aggregate metric combining code and visualization quality. "Overall Score (OS):"
- Quality threshold: A predefined score level that determines whether the system halts or continues refining. "a quality threshold of "
- Quality-driven halting: Stopping criteria based on meeting or exceeding target quality scores. "quality-driven halting"
- Qwen Code Interpreter Benchmark: A benchmark subset focused on visualization tasks within code interpretation. "Qwen Code Interpreter Benchmark (Visualization)"
- Search Agent: A retrieval component that finds relevant code examples to guide generation. "Search Agent (as a tool) retrieves relevant code examples"
- Self-reflection: An internal evaluation mechanism where agents assess and revise their own outputs. "self-reflection"
- SWE scenarios: Software Engineering contexts that require integrating visualization within larger codebases. "real-world SWE scenarios"
- Token limit violations: Attempts to process inputs exceeding an LLM’s maximum context length. "token limit violations"
- Visualization primitives: Fundamental elements of visualization design (e.g., marks, channels) used to construct charts. "maps query semantics to visualization primitives"
- Visualization Success Rate (VSR): The quality score (or proportion correct) of rendered visualizations among executable cases. "Visualization Success Rate (VSR):"
- VizMapping Agent: An agent responsible for mapping query semantics to chart types and visual encodings. "VizMapping Agent"
Collections
Sign up for free to add this paper to one or more collections.

