- The paper provides robust quantitative evidence that accurate visualizations significantly improve LVLM performance in complex data analysis tasks.
- The study uses controlled experiments with synthetic datasets across clustering, parabolic, and outlier tasks to demonstrate how misleading visuals degrade performance.
- The findings underscore the need for enhanced multimodal fusion in AI systems and motivate designing visualizations optimized for AI data comprehension.
Visualization as an Aid for Data Understanding in Vision-LLMs
Introduction
This paper investigates whether visualization enhances the data analysis capabilities of large vision-LLMs (LVLMs), specifically GPT 4.1 and Claude 3.5. The study is motivated by the central role of visualization in human data analysis and the increasing integration of LVLMs into analytical workflows. The authors design controlled experiments using synthetic datasets to systematically evaluate the impact of visualizations—both accurate and misleading—on model performance across three canonical data analysis tasks: cluster detection, parabolic trend identification, and outlier detection. The results provide quantitative evidence that accurate visualizations can significantly improve LVLMs' analytical accuracy, especially as task subtlety increases, and that misleading visuals can degrade performance.
Experimental Design
Synthetic Dataset Construction
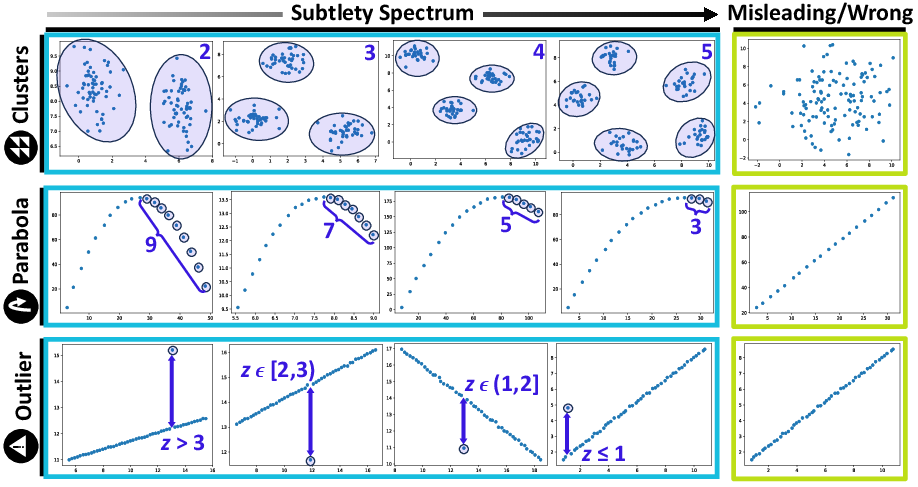
Three types of synthetic datasets are generated to represent common analytical tasks:
Each dataset is presented to the models under five conditions:
- Data Only: Raw numerical data.
- Data + Blank Visual: Data with an all-white image.
- Data + Wrong Visual: Data with a misleading visualization.
- Data + Correct Visual: Data with an accurate scatterplot.
- Correct Visual Only: Only the accurate scatterplot.
This design isolates the effect of visualization content from the mere presence of an image and allows assessment of both synergistic and conflicting information between modalities.
Evaluation Protocol
Task-specific success criteria are defined: explicit cluster enumeration, use of parabolic keywords, and correct outlier identification. For clustering and outlier tasks, a third LVLM (Gemini 2.5) is used as an automated judge, with manual verification for a subset of responses.
Results
Clustering Task
Accurate visualizations substantially improve cluster enumeration accuracy, particularly as the number of clusters increases. For 4- and 5-cluster datasets, GPT 4.1 and Claude 3.5 are at least 2.3x and 1.7x more accurate, respectively, when provided with correct visuals compared to data alone. Both models tend to underestimate cluster count in the absence of visuals, and misleading visuals further degrade performance, with models rarely flagging the discrepancy between data and image.
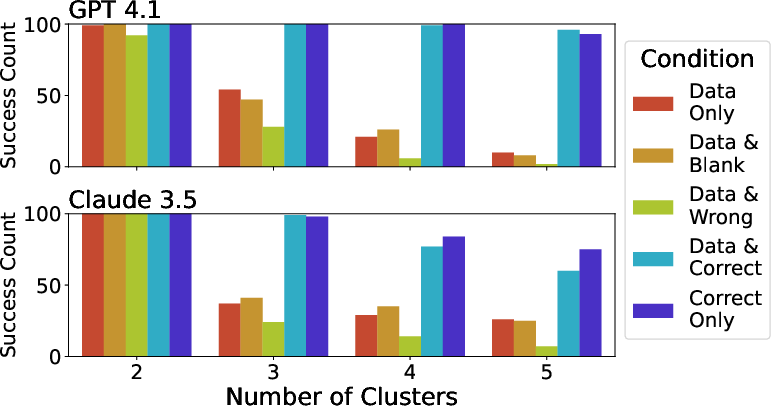
Figure 2: Visualization improves GPT 4.1 and Claude 3.5's ability to detect the number of clusters, with the benefit increasing for more subtle (higher-cluster) datasets.
Parabolic Trend Task
Both models show maximal performance in parabolic trend identification when given accurate visuals, especially for subtle datasets (fewer points beyond the vertex). Misleading visuals (linear best-fit plots) halve success rates compared to other conditions and suppress the use of correct trend descriptors. Notably, for the most subtle cases, providing only the correct visual outperforms the combination of data and visual, suggesting that conflicting modalities can hinder model reasoning.
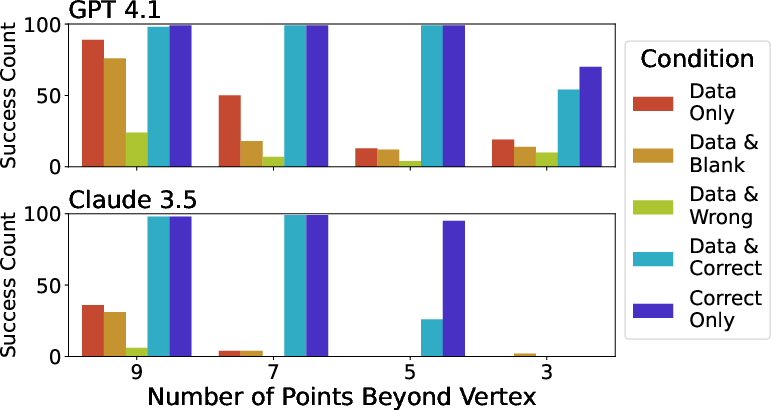
Figure 3: Visualization improves parabolic trend identification, with correct visuals alone sometimes outperforming combined data and visual input at high subtlety.
Outlier Detection Task
Visualization also aids outlier identification, with the benefit increasing as the outlier becomes less prominent. Unlike the other tasks, models perform comparably or better when given both data and correct visual, likely due to the need for precise value retrieval. Misleading visuals again result in the lowest performance.
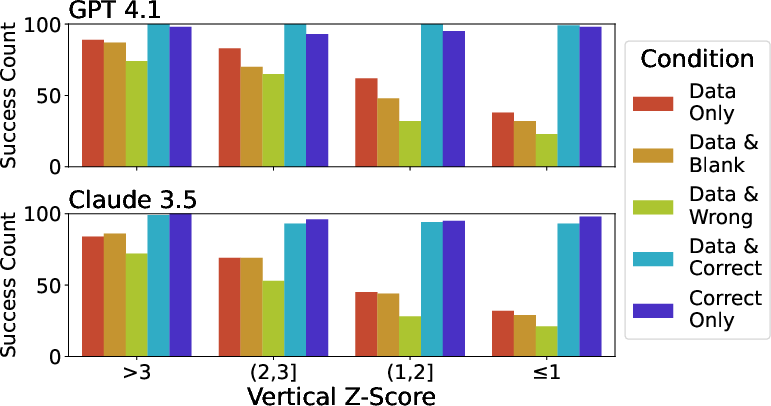
Figure 4: Visualization improves outlier identification, with performance declining as outlier subtlety increases, especially without accurate visuals.
Response Length and Reasoning Patterns
Model responses are more concise when provided with visuals alone. GPT 4.1, in particular, tends to output the entire dataset before analysis when only data is provided, resulting in longer responses. The presence of any visual input, even a blank image, reduces GPT's output length, while Claude's response length is less affected.
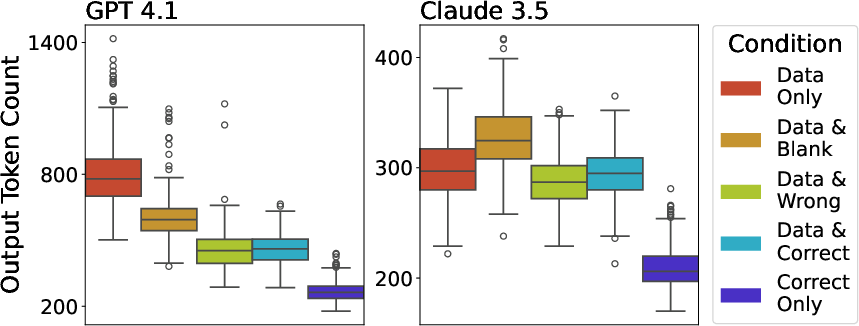
Figure 5: Representative output token counts in the outlier detection setting, showing that correct visuals lead to the most concise answers.
Discussion
Implications for AI-Assisted Data Analysis
The results demonstrate that LVLMs, like humans, benefit from visualization in data analysis tasks, particularly as task complexity increases. Accurate visuals enhance pattern recognition and reduce error magnitude, while misleading visuals can override correct data interpretation and induce silent failures. The finding that visuals alone can sometimes outperform combined modalities suggests that current LVLMs may not optimally integrate visual and numerical information, especially when the modalities are in conflict.
Theoretical and Practical Considerations
These findings have several implications:
- Model Design: There is a need for improved multi-modal fusion architectures that can reconcile conflicting information and leverage complementary strengths of each modality.
- Visualization for AI: The results motivate a new research direction in designing visualizations optimized for AI consumption, which may differ from those optimized for human perception.
- Evaluation Metrics: Automated LVLM-based judging is scalable but may require further validation for logical consistency and robustness to adversarial inputs.
- Human-AI Collaboration: Visualizations that benefit both AI and human users could facilitate more transparent and interpretable AI-assisted workflows.
Limitations and Future Directions
The study is limited to two commercial LVLMs and synthetic datasets. Future work should extend the analysis to a broader range of models, real-world datasets, and more complex analytical tasks. Systematic exploration of visualization design parameters and their effect on AI understanding is warranted. Additionally, investigating the internal mechanisms by which LVLMs process and integrate visual and numerical data could inform both model and visualization design.
Conclusion
This work provides quantitative evidence that visualization enhances the data analysis capabilities of state-of-the-art LVLMs, with the effect magnified for subtle and complex tasks. The results highlight both the promise and current limitations of multi-modal AI systems in analytical workflows. The findings open new avenues for research at the intersection of visualization, AI model design, and human-AI interaction, with the potential to inform both practical tool development and theoretical understanding of multi-modal reasoning.