- The paper introduces DeepSupp, a novel deep-learning model that uses multi-head attention to dynamically identify support and resistance levels in financial time series.
- It integrates feature engineering, Spearman rank correlation, autoencoder representation, and DBSCAN clustering to extract nuanced market patterns.
- Experimental results demonstrate state-of-the-art performance with a score of 0.554 ± 0.039, underlining its potential for improved algorithmic trading strategies.
DeepSupp: Attention-Driven Correlation Pattern Analysis for Dynamic Time Series Support and Resistance Levels Identification
The paper "DeepSupp: Attention-Driven Correlation Pattern Analysis for Dynamic Time Series Support and Resistance Levels Identification" (2507.01971) introduces a novel deep-learning approach, named DeepSupp, for identifying financial support levels by integrating @@@@1@@@@ mechanisms to analyze spatial correlations and market microstructure relationships. This method addresses the limitations of traditional technical analysis techniques, which often struggle to adapt to the complexities of modern, volatile markets. The authors present a comprehensive evaluation framework using six fundamental financial metrics, demonstrating that DeepSupp captures subtle price-volume relationships and achieves state-of-the-art performance in support level detection.
Methodology
The DeepSupp methodology combines feature engineering with volume-weighted indicators, dynamic correlation analysis using Spearman rank correlation, multi-head attention processing for parallel relationship analysis, autoencoder-based representation learning, and DBSCAN clustering for market regime identification (Figure 1).
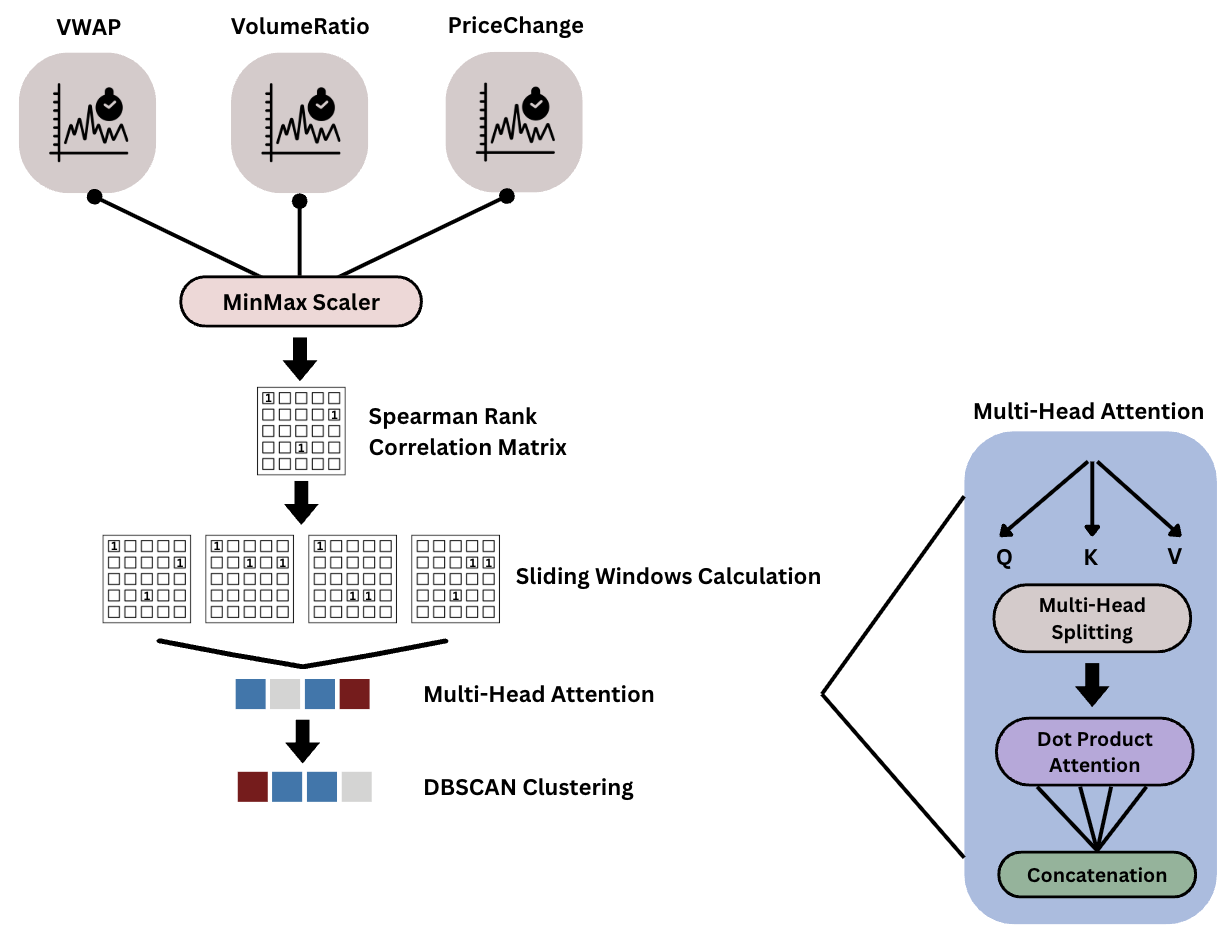
Figure 1: DeepSupp Architecture Overview: The methodology integrates feature engineering with volume-weighted indicators, dynamic correlation analysis using Spearman rank correlation, multi-head attention processing for parallel relationship analysis, autoencoder-based representation learning, and DBSCAN clustering for market regime identification.
The feature engineering process constructs a feature vector Ft that includes closing price (Closet), Volume Weighted Average Price (VWAPt), volume (Vt), price change weighted by volume (PriceChangeVolumet), and volume ratio (VolumeRatiot). These features are normalized using MinMax scaling to ensure numerical stability during training. The dynamic correlation analysis module captures evolving relationships between market variables using Spearman rank correlation within sliding windows of length n=32. The Spearman rank correlation ρij(t) is calculated as:
ρij(t)=1−n(n2−1)6∑k=1ndk2
where dk represents the difference between ranks of observations i and j at time k. This generates a sequence of correlation snapshots that are then fed into the attention mechanism.
A multi-head attention autoencoder processes the correlation matrices, leveraging the permutation invariance property of multi-head attention. This architecture employs 4 attention heads with an embedding dimension of 32, allowing each head to specialize in different types of market relationships. The encoder component consists of two linear layers with ReLU activations, compressing the attention-enhanced features from 32 dimensions to 16 dimensions. The decoder mirrors the encoder structure, reconstructing the original correlation matrices from the compressed embeddings using a symmetric architecture. Finally, support levels are extracted through unsupervised clustering of the learned embeddings using DBSCAN with parameters ϵ=0.1 and a minimum samples threshold equal to 10% of the dataset size.
Experimental Results
The paper provides a standardized comparison framework for evaluating support level detection methods using six fundamental financial metrics. These metrics include Support Accuracy, Price Proximity, Volume Confirmation, Market Regime Sensitivity, Support Hold Duration, and False Breakout Rate.
DeepSupp was evaluated against six baseline methods: Hidden Markov Models (HMM), Local Minima detection, Fractal analysis, Fibonacci retracement, Moving Average analysis, and Quantile Regression. The experiments were conducted using S{content}P 500 tickers with historical price and volume data over a 2-year period.
The results, summarized in Table 1, demonstrate that DeepSupp achieves the highest overall score of 0.554 ± 0.039, indicating superior and consistent performance across the weighted combination of all metrics evaluated.
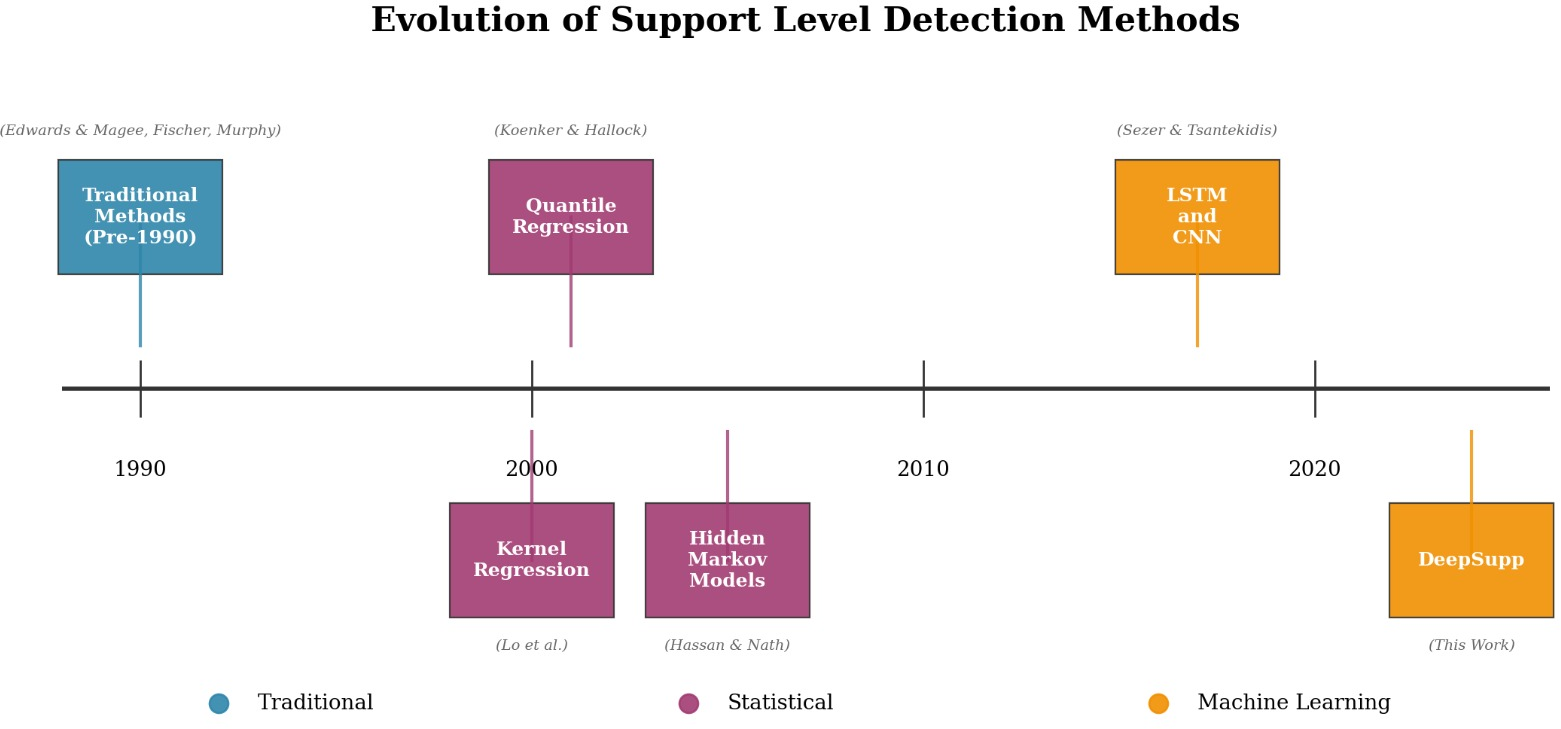
Figure 2: Evolution of Support Level Detection Methods.
DeepSupp's balanced performance across multiple metrics, combined with the lowest performance variability, underscores its robustness. The study also analyzes the attention weights, revealing that DeepSupp automatically discovers the fundamental structure of market behavior without being explicitly programmed with financial theory.
Implications and Future Work
DeepSupp's capacity to capture complex non-linear temporal dependencies and market microstructure relationships has significant implications for algorithmic trading. The framework demonstrates the potential of attention-based architectures to uncover nuanced market patterns and improve technical trading strategies. Future research directions include experimenting with less liquid equities, fixed-income products, and cryptocurrencies to confirm portability. Additionally, the authors suggest inference time speedup for easier practical deployment scenarios.


