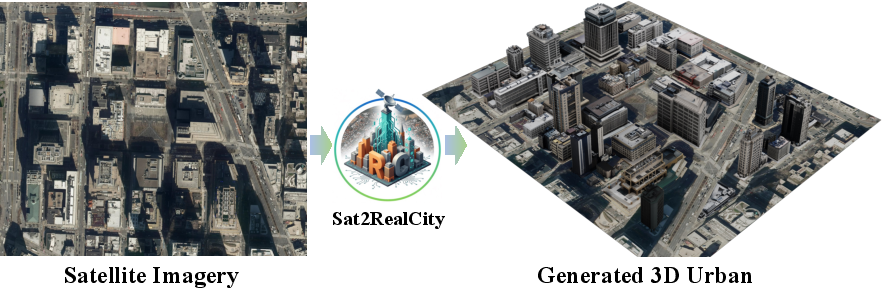
Sat2RealCity: Geometry-Aware and Appearance-Controllable 3D Urban Generation from Satellite Imagery
Abstract: Recent advances in generative modeling have substantially enhanced 3D urban generation, enabling applications in digital twins, virtual cities, and large-scale simulations. However, existing methods face two key challenges: (1) the need for large-scale 3D city assets for supervised training, which are difficult and costly to obtain, and (2) reliance on semantic or height maps, which are used exclusively for generating buildings in virtual worlds and lack connection to real-world appearance, limiting the realism and generalizability of generated cities. To address these limitations, we propose Sat2RealCity, a geometry-aware and appearance-controllable framework for 3D urban generation from real-world satellite imagery. Unlike previous city-level generation methods, Sat2RealCity builds generation upon individual building entities, enabling the use of rich priors and pretrained knowledge from 3D object generation while substantially reducing dependence on large-scale 3D city assets. Specifically, (1) we introduce the OSM-based spatial priors strategy to achieve interpretable geometric generation from spatial topology to building instances; (2) we design an appearance-guided controllable modeling mechanism for fine-grained appearance realism and style control; and (3) we construct an MLLM-powered semantic-guided generation pipeline, bridging semantic interpretation and geometric reconstruction. Extensive quantitative and qualitative experiments demonstrate that Sat2RealCity significantly surpasses existing baselines in structural consistency and appearance realism, establishing a strong foundation for real-world aligned 3D urban content creation. The code will be released soon.
Paper Prompts
Sign up for free to create and run prompts on this paper using GPT-5.
Top Community Prompts
Explain it Like I'm 14
What is this paper about?
This paper introduces Sat2RealCity, a new way to build realistic 3D cities on a computer using real satellite photos. Instead of needing huge, expensive 3D city datasets, it uses freely available map data and smart AI tricks to create cities that look real and match the actual layout of buildings in the real world.
What questions were the researchers trying to answer?
- How can we generate believable 3D cities without collecting massive, hard-to-get 3D city models?
- How can we make the 3D buildings match the true positions, shapes, and orientations seen from above in satellite images?
- How can we give buildings realistic appearances (like materials and colors) that are consistent across a neighborhood, not just random per building?
How did they do it?
Think of building a city like assembling LEGO. Instead of making a whole city at once, they generate one building at a time and then place each building exactly where it belongs on the map.
Here’s the approach, explained in everyday terms:
1) Start from “map outlines” to get building shapes right
- They use OpenStreetMap (OSM), a free world map, to get each building’s footprint—basically the 2D outline of the building on the ground—and sometimes its height.
- Imagine tracing the shape of each building from the map and then “pushing it up” to make a simple 3D block. These act as “training wheels” that guide the AI to make correct geometry (shape, size, and rotation).
- By mixing these guides with a bit of randomness, the AI can stay accurate but still be creative where needed.
2) Make every neighborhood look consistent
- Satellite images show roofs clearly, but facades (walls, windows, materials) can be hard to see from above.
- To make buildings in the same area look like they belong together, the system uses a shared “style picture” that represents the neighborhood’s front-view appearance (for example, brick walls and narrow windows).
- Inside the model, they combine two kinds of clues:
- Top-down clues (from satellite) to keep geometry and placement correct.
- Front-view clues (style image) to make walls, windows, and materials look consistent across buildings in the same region.
3) Use a smart helper to create the style images
- They group nearby buildings with similar look and height using visual clustering (a way to group similar items).
- A multimodal LLM (an AI that understands images and text) looks at the top views and writes a short description of the shared style (for example, “modern office buildings with glass facades and gray tones”).
- A text-to-image tool then turns that description into a front-view style image. This becomes the shared “style guide” for that group of buildings.
4) A custom 3D building dataset to train on
- Because there isn’t a good public dataset of 3D buildings, they made one: 11,579 detailed building models.
- They created text prompts (like “red-brick apartment building with flat roof”) → generated images → converted those images into 3D models using existing AI tools. This gives the model lots of examples of realistic buildings to learn from.
5) Put it all together
- For each building: 1) Use its OSM footprint (outline and height) to guide the shape. 2) Use the satellite top view to keep the geometry aligned and realistic. 3) Use the cluster’s front-view style image to make the facade look right.
- Finally, place every generated building back on its real-world coordinates from the map, like snapping LEGO pieces onto a board.
Notes on the technical terms (in simple language):
- Chamfer Distance: a score that tells how close two 3D shapes are by comparing their points. Lower is better.
- F-score: a percentage-like score that measures how many points line up closely between two shapes. Higher is better.
- CLIP score: an AI-based “looks-right” score comparing two images (here, the generated city versus real references). Higher is better.
What did they find?
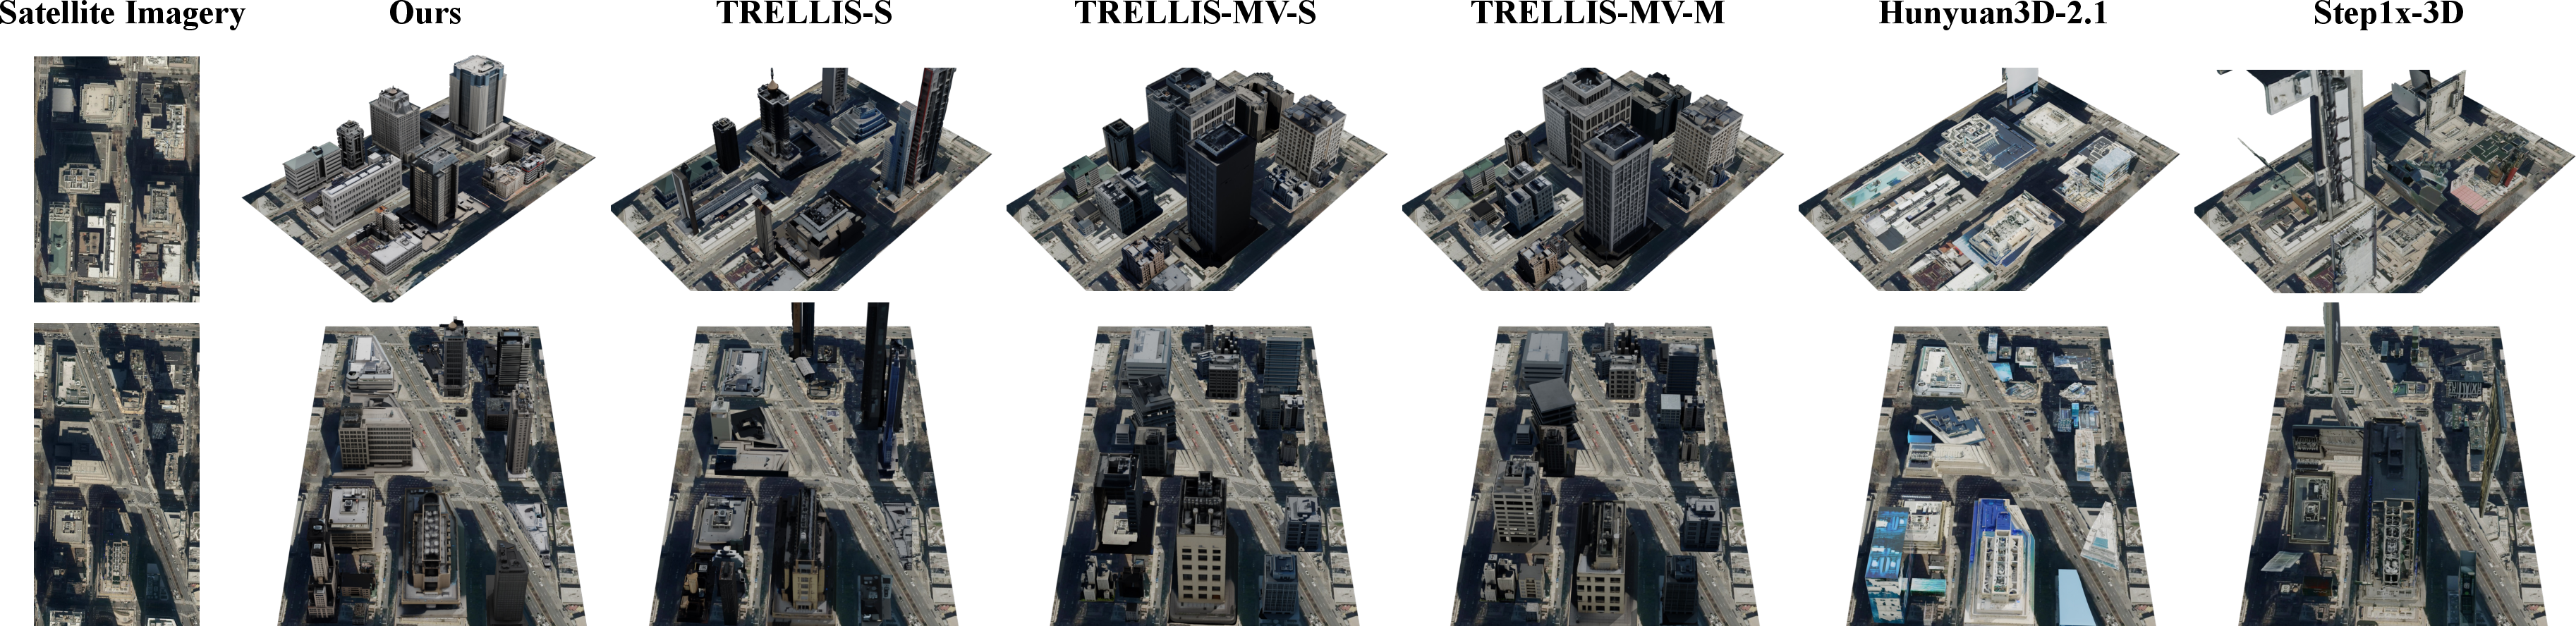
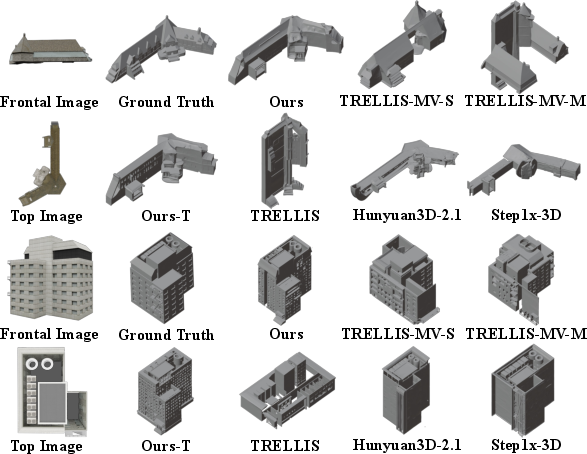
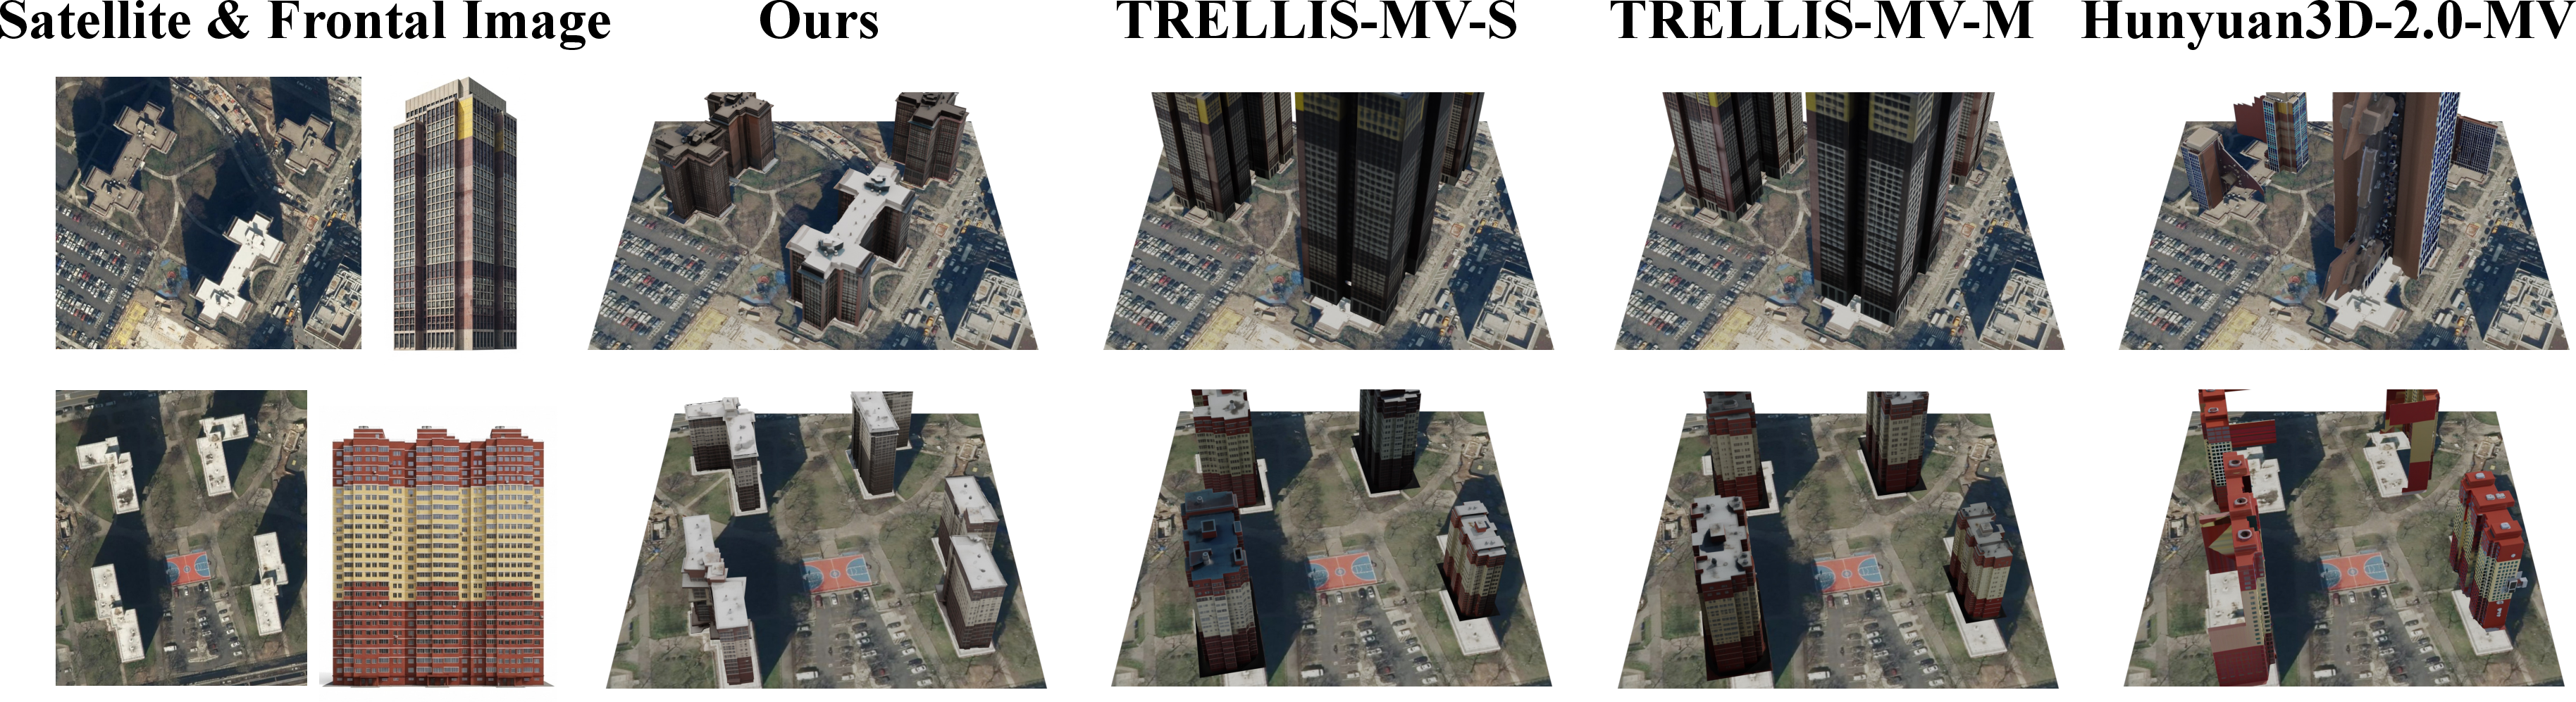
- More accurate shapes: Buildings match their real footprints and orientations better than other methods. Roofs, sizes, and positions line up closely with the map.
- More realistic looks: Facade materials and colors look more believable when judged against real city imagery.
- Consistent neighborhood style: Buildings in the same area share a coherent look (for example, similar window patterns and materials), which makes the whole scene feel real and not patchy.
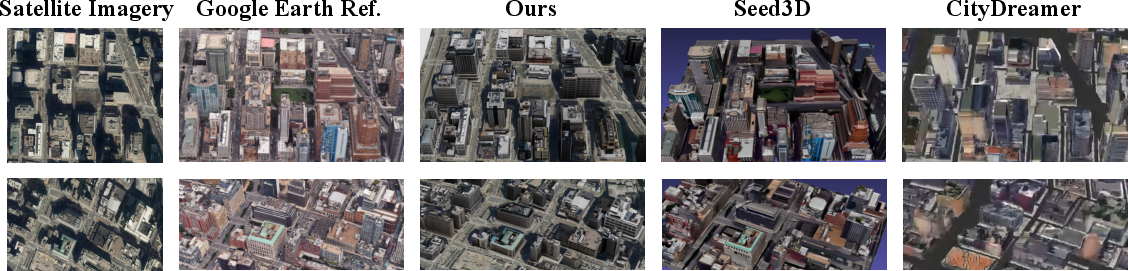
- Works across different regions: The method generalizes well, not just on a single city.
- Needs fewer hard-to-get 3D assets: Because it builds from satellite images and open map data, it avoids the usual cost of collecting large 3D city datasets.
Across multiple tests, Sat2RealCity beat other strong 3D generation systems on both shape accuracy and appearance realism.
Why does this matter?
- Urban planning and digital twins: City planners can quickly create realistic 3D city models aligned with the real world to explore ideas and test changes.
- Autonomous driving and simulation: More accurate virtual cities help train and test self-driving systems safely.
- Games and virtual worlds: Developers can generate believable cities that match real locations without modeling everything by hand.
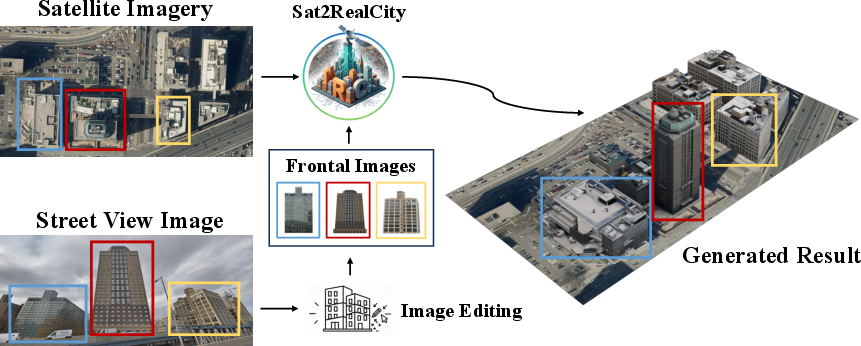
- Scalable and flexible: Because it builds one building at a time guided by maps and satellite images, it can scale to large areas and adapt to different styles (even using real street-view photos, if available).
In short, Sat2RealCity shows a practical path to generating real-world-aligned 3D cities: it uses what we already have (satellite images and open maps), adds smart AI to fill in what we can’t see (facade details and styles), and produces cities that look right and fit the map—without needing massive 3D datasets.
Knowledge Gaps
Knowledge gaps, limitations, and open questions
The paper advances 3D urban generation from satellite imagery, but several aspects remain underexplored or uncertain. Future work could address the following concrete gaps:
- Reliance on OSM footprints and height attributes: many regions lack accurate building heights or have outdated/incomplete footprints; there is no fallback strategy (e.g., shadow-based height inference, stereo/DSM integration, or uncertainty modeling) when OSM height data are missing or noisy.
- Geospatial misalignment between satellite imagery and OSM: the approach assumes precise registration; robustness to registration errors and a systematic correction/quantification of alignment discrepancies are not studied.
- Synthetic training data domain gap: the 11,579 AIGC-generated building assets may not capture real-world structural/material distributions, regional styles, or scale calibrations; the impact of training on synthetic vs. real building datasets is not quantified.
- Coverage and bias in the building dataset: geographic, cultural, and typological diversity (e.g., informal settlements, heritage, rural vernacular, industrial sheds) are not characterized; sampling biases and their effect on generalization remain unmeasured.
- Dependency on proprietary tools (Imagen 4, Earth Studio): reproducibility and licensing constraints limit open benchmarking; alternatives with open-source pipelines and equivalent fidelity are not evaluated.
- Appearance guidance via MLLM+T2I may hallucinate facades: there is no assessment of semantic accuracy of generated frontal images, nor mechanisms to constrain them to verified materials/colors; integrating real street-view imagery at scale remains a proof-of-concept without a robust, automated pipeline.
- Facade orientation ambiguity: the “frontal-view” guidance lacks a principled mapping to a specific facade side; how the model resolves which facade the appearance image applies to (and how it aligns to building orientation) is unspecified.
- Style clustering sensitivity: the DINOv3+HDBSCAN clustering (top-view features + height) may be sensitive to parameters and noise; effects of cluster granularity and stability on regional stylistic coherence are not analyzed.
- Fusion strategy limitations: the simple element-wise averaging of dual cross-attention pathways is not ablated against stronger alternatives (learned gating, spatial masks, confidence-based weighting); how conflicts between structure and appearance signals are resolved remains a hypothesis without interpretability tests.
- Terrain modeling is absent: the approach assumes flat terrain; integration with DEM/DTM to support sloped topography, elevated bases, and proper vertical alignment is not explored.
- Off-nadir/oblique satellite imagery: robustness to varying sensor properties, non-orthorectified imagery, and off-nadir distortions is not discussed or evaluated.
- Non-building urban assets: roads, bridges, terrain, vegetation, water bodies, and street furniture are not generated; extending the entity-level approach to multi-class urban components is an open challenge.
- Footprint adherence and collision handling: guarantees that generated meshes remain within footprints (no overhangs/intersections) are not formalized; differentiable footprint constraints or post-process mesh clipping are not studied.
- Scale and throughput: inference time, memory footprint, and performance for city-scale regions (tens to hundreds of km²) are not reported; strategies for tiling, streaming, and incremental updates are unspecified.
- Uncertainty quantification: the system produces deterministic outputs without confidence measures; mechanisms to estimate and propagate uncertainty from priors and appearance guidance are missing.
- Evaluation metrics: CLIP for appearance is coarse and may reward style similarity over material fidelity; geometry evaluation relies on OSM (not authoritative ground truth) without height error in meters or LiDAR/DSM-based validation; no human perceptual studies are conducted.
- Benchmark comparability: comparisons to CityDreamer/Seed3D differ in inputs and outputs (e.g., missing geometry for CityDreamer); a standardized, open benchmark with unified inputs, metrics, and ground truth is needed.
- Prior strength hyperparameter (λ): the fixed λ=0.5 at inference is not justified; adaptive or per-building scheduling of structural prior strength is uninvestigated.
- Robustness to occlusions/clouds: satellite roof appearances may be occluded by trees/clouds; pre-processing or occlusion-aware conditioning strategies are not discussed.
- Representation-specific artifacts: decoding to mesh/NeRF/3DGS trade-offs (watertightness, topology quality, rendering speed, PBR material support) are not evaluated; material parameterization for physically based rendering is missing.
- Multi-scale style transitions: how styles vary smoothly across districts (avoiding sharp boundaries between clusters) is not addressed; mechanisms for hierarchical or spatially-aware style blending are absent.
- Temporal generalization: handling outdated imagery, urban changes, seasonal/illumination variations, and time-aware updates is not explored.
- Legal/ethical considerations: OSM and Earth Studio licensing, privacy (street-view use), and responsible deployment in simulation/virtualization contexts are not discussed.
- Failure mode analysis: systematic characterization of typical errors (e.g., roof distortions, facade repetition, height misestimation) and their causes is lacking.
- Integration with multimodal geospatial data: incorporating DSM/DTM, multispectral bands, SAR, or cadastral attributes to reduce ambiguity and improve realism is left open.
- Per-building semantic fidelity: validating that generated appearances match inferred building types/materials (from MLLM) is not measured; a facade-material classification or window-layout accuracy metric would improve evaluation.
- Generalization to low-resource regions: performance in areas with sparse OSM, low-resolution imagery, or limited street-view is not assessed; data-scarce adaptation strategies are needed.
Practical Applications
Immediate Applications
Below are actionable use cases that can be deployed now, along with the sectors they impact, the tools/workflows they enable, and key assumptions or dependencies to consider.
- Rapid satellite-to-3D city reconstruction for mapping platforms
- Sectors: software (GIS), geospatial, visualization
- Tools/workflows: “Sat2RealCity API” or QGIS/ArcGIS plugin; pipeline of satellite tiles + OSM footprints/heights → OSM-based structural priors → entity-level 3D generation → export to glTF/3D Tiles → render in CesiumJS/Kepler.gl
- Assumptions/dependencies: OSM coverage and attribute accuracy (heights, footprints); satellite imagery quality; GPU compute; acceptance that output is not survey-grade geometry
- Digital twin bootstrapping for urban planning and stakeholder visualization
- Sectors: urban planning, real estate, government services
- Tools/workflows: scenario visualization where planners apply shared appearance control per district to study neighborhood coherence, street canyon effects, or massing; integration with CityEngine/Unreal/Unity
- Assumptions/dependencies: photorealistic facades via MLLM + T2I are stylistic approximations; use disclaimers for non-engineering decisions
- Cohesive neighborhood style prototyping for architectural concept design
- Sectors: architecture, AEC
- Tools/workflows: “Appearance Control Panel” to impose consistent facade materials, colors, fenestration patterns across a block; export sketches for client review
- Assumptions/dependencies: frontal-view style references generated by MLLM may need human curation; geometry fidelity is sufficient for massing/concept, not detailed BIM
- Synthetic yet geospatially aligned content for robotics and autonomy simulation
- Sectors: robotics, automotive
- Tools/workflows: generate large, diverse, style-consistent city scenes aligned to OSM for camera-based perception training, domain randomization, and path-planning tests in Unity/Unreal
- Assumptions/dependencies: roof/facade fidelity is strong; fine mechanical/physical accuracy (e.g., curb heights) is limited; validate sensor-domain realism before deployment
- First-pass telecom planning (LoS and preliminary RF feasibility)
- Sectors: telecommunications
- Tools/workflows: approximate line-of-sight maps and blockage analysis using entity-aligned 3D; export to RF planning tools (e.g., Atoll/Planet)
- Assumptions/dependencies: OSM heights can be incomplete; materials for RF are not modeled (facade permittivity/attenuation); treat as early-stage visualization, not final RF design
- Solar and shading visualization for early energy assessments
- Sectors: energy, sustainability
- Tools/workflows: roof geometry extraction from generated scenes for solar potential mapping, diurnal shadow visualization, and comparative “what-if” studies
- Assumptions/dependencies: height and roof pitch accuracy may vary; requires validation against local DSM/DTM for quantitative results
- Emergency response and training scenarios
- Sectors: public safety, civil protection
- Tools/workflows: assemble realistic training environments aligned with satellite footprints for evacuation drills, resource placement, and visibility planning
- Assumptions/dependencies: textures and interior details are synthetic; use with caution for precise routing or load calculations
- Rapid game/VR world creation with real-world alignment
- Sectors: gaming, media/entertainment
- Tools/workflows: “Satellite-to-World Kit” to ingest satellite + OSM and export richly textured, stylistically coherent city scenes for open-world construction
- Assumptions/dependencies: license compliance for satellite/OSM data; style references may need creative direction
- Academic benchmarking for building-entity 3D generation and stylistic control
- Sectors: academia, research
- Tools/workflows: use the released 11,579 AIGC building dataset to benchmark geometry fidelity (CD, F-score) and regional stylistic consistency metrics; ablation of OSM priors and dual-pathway cross-attention
- Assumptions/dependencies: dataset licensing; forthcoming code release; reproducibility relies on model weights and prompts provided
- Immersive property marketing and neighborhood tours
- Sectors: real estate, consumer apps
- Tools/workflows: derive 3D neighborhood previews with realistic facades and alignments; integrate with web map frontends for listings and “walk-through” experiences
- Assumptions/dependencies: appearance is representative rather than exact; indoor features are not modeled
- Tourism and education geovisualization
- Sectors: education, tourism
- Tools/workflows: create city-scale 3D views for guided learning or virtual sightseeing; layer historical facts, architectural styles, and urban morphology
- Assumptions/dependencies: completeness varies with OSM coverage; style generalization requires curation for iconic locales
- Urban analytics overlays in 3D
- Sectors: finance, insurance, public sector analytics
- Tools/workflows: display risk indices (flood, heat exposure, accessibility) on generated 3D scenes to improve comprehension
- Assumptions/dependencies: use qualitative visualization; avoid quantitative claims without validation against authoritative 3D basemaps
Long-Term Applications
The following applications are feasible with further research, larger-scale deployment, and integration with additional data sources or tooling.
- Automated, city-scale digital twin maintenance from satellite and street-view
- Sectors: smart cities, municipal IT
- Tools/workflows: continuous pipeline ingesting periodic satellite updates + street-view grounding → entity-level updates → 3D Tiles streaming to operations dashboards
- Assumptions/dependencies: data governance; privacy for street-view ingestion; scalable GPU/cluster resources; change detection and temporal consistency modules
- Regulation-aware zoning and facade compliance “what-if” tools
- Sectors: public policy, urban governance
- Tools/workflows: simulate code-compliant facade/material changes across districts and assess visual impacts; support participatory design engagements
- Assumptions/dependencies: auditability and provenance of generative assets; model bias and misrepresentation risks; legal frameworks for generative planning
- High-fidelity energy and climate modeling (CFD, urban microclimate)
- Sectors: energy, environmental engineering
- Tools/workflows: convert generated meshes to watertight, simulation-grade geometry; assign materials/thermal properties for CFD and UHI analyses
- Assumptions/dependencies: improved geometry accuracy, roof features, material characterization; coupling with DSM/DTM, LiDAR, or photogrammetry
- Insurance and catastrophe risk modeling (flood, wind, seismic)
- Sectors: insurance, reinsurance, disaster risk management
- Tools/workflows: large-area parametric models of buildings for exposure mapping; automated scenario testing
- Assumptions/dependencies: precise elevations and construction attributes (foundation, structural system) not currently modeled; requires enrichment via external datasets
- Telecom-grade ray tracing and mmWave planning
- Sectors: telecommunications
- Tools/workflows: augment facades with material properties and window distributions; support accurate RF propagation/attenuation modeling at high frequencies
- Assumptions/dependencies: materials database; calibrated geometry to surveyed basemaps; validation against drive-test data
- Synthetic data generation at scale for autonomy and vision models
- Sectors: robotics, automotive, AI
- Tools/workflows: “City Domain Randomizer” generating varied yet realistic cities across regions for multi-domain training; controllable appearance for style transfer
- Assumptions/dependencies: closed-loop validation against real sensor logs; domain gap management; simulator integration
- Geospatial asset marketplace of procedurally grounded 3D buildings
- Sectors: software (platforms), media
- Tools/workflows: standardized glTF/USD assets aligned to OSM; APIs for licensing and on-demand generation for specific geographies
- Assumptions/dependencies: IP/licensing models; provenance tracking; quality assurance pipelines
- Participatory AR urban design at district scale
- Sectors: civic tech, architecture
- Tools/workflows: AR overlays to visualize proposed facade/material changes city-wide; crowd feedback ingestion and consensus building
- Assumptions/dependencies: accurate registration; mobile device performance; regulatory acceptance of AR-driven consultation
- Environmental justice and equity mapping (heat islands, access)
- Sectors: policy, NGOs, academia
- Tools/workflows: integrate generative facades/materials (albedo proxies) to explore heat exposure scenarios; overlay demographic data
- Assumptions/dependencies: proxy validity for materials; robust uncertainty communication; ethics of generative visualization in sensitive contexts
- Humanitarian mapping in data-sparse regions
- Sectors: humanitarian aid, NGOs
- Tools/workflows: generate missing 3D basemaps where only satellite + sparse OSM exist; support logistics planning and situational awareness
- Assumptions/dependencies: OSM completeness may be low; prioritize rapid qualitative visualization with clear caveats
- Multimodal urban semantic inference and labeling
- Sectors: academia, geospatial AI
- Tools/workflows: extend MLLM clustering + descriptions for automatic building-type classification and urban morphology taxonomies
- Assumptions/dependencies: MLLM robustness across diverse cultures/architectures; ground-truth validation; bias auditing
- BIM integration and parametric reconstruction
- Sectors: AEC
- Tools/workflows: translate structured latents/meshes to parametric BIM elements (walls, roofs, windows) with inferred attributes
- Assumptions/dependencies: inverse modeling to parametric primitives; tolerance and LOD standards; downstream QA for construction use
Cross-cutting assumptions and dependencies
- Data availability and quality: OSM footprints and height attributes can be incomplete or noisy; satellite imagery varies by region and provider.
- Appearance realism: MLLM + T2I-driven frontal-view references may misinterpret style; human-in-the-loop curation improves outcomes.
- Geometric fidelity: entity-level generation yields strong alignment but is not survey-grade; for engineering decisions, augment with DSM/DTM, LiDAR, or photogrammetry.
- Compute and scalability: training/inference benefit from high-end GPUs; city-scale generation requires tiling, streaming formats (e.g., 3D Tiles), and orchestration.
- Ethics and governance: prevent misrepresentation; ensure provenance, versioning, and model bias documentation; comply with licensing for satellite and OSM data.
- Integration: production use will likely require connectors to GIS (QGIS/ArcGIS), web visualization (CesiumJS), game engines (Unity/Unreal), and simulation tools (CFD/RF/AV).
Glossary
- Chamfer Distance (CD): A metric that measures the average bidirectional distance between two point sets, commonly used to evaluate geometric accuracy of 3D reconstructions. "To evaluate geometric consistency, we compare point clouds from the generated regions against the OSM-based ground truth using the Chamfer Distance (CD) and F-score."
- CLIP Score: The cosine similarity between CLIP embeddings that quantifies perceptual alignment of generated visuals with references. "For appearance realism, we adopt the CLIP Score~\cite{radford2021learning}, defined as the cosine similarity between CLIP (ViT-L/14) embeddings of our rendered city views and those of the Google Earth Studio reference."
- Conditional Flow Matching (CFM): An objective for training rectified flow models by matching a learned vector field to the difference between noise and data across timesteps. "The two-stage model fits this vector field by minimizing the Conditional Flow Matching (CFM) objective:"
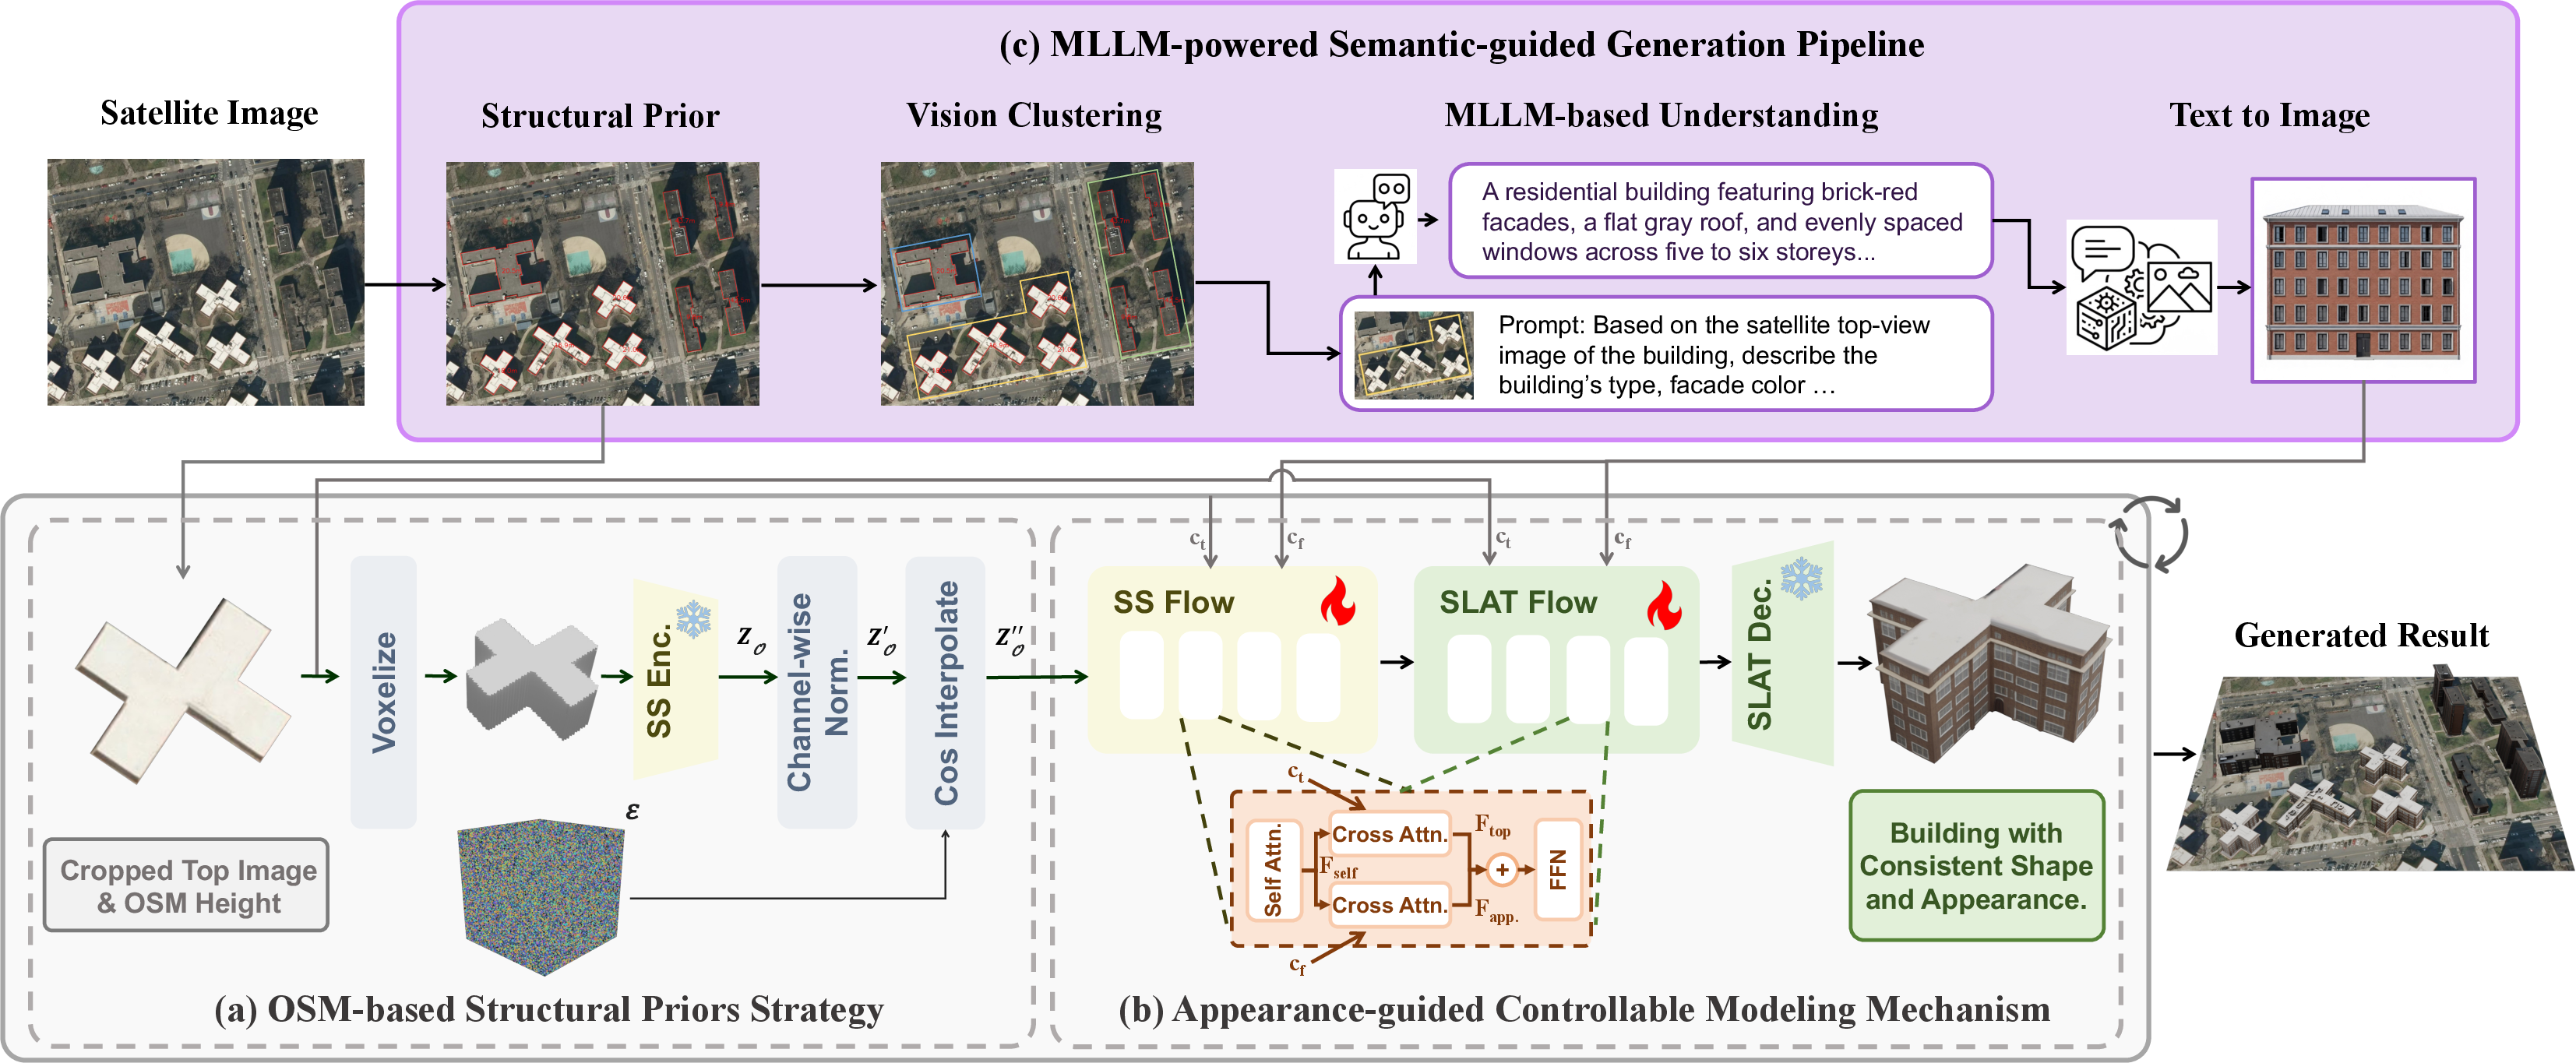
- Cosine Geometric Interpolation: A cosine-scheduled blending of a structured latent with Gaussian noise to control prior strength and stochasticity. "we perform Cosine Geometric Interpolation between $Z'_{\mathcal{O}$ and Gaussian noise :"
- Cross-attention pathways: Parallel attention branches that condition generation on different modality features (e.g., top-view vs. frontal-view) within transformer blocks. "We propose parallel cross-attention pathways, which are incorporated within each SS Flow and SLAT Flow transformer block, following the self-attention and preceding the feed-forward network (FFN), as illustrated in Figure~\ref{fig:framework}:"
- DINOv2: A self-supervised Vision Transformer used to encode image features as conditioning signals for generative models. "Both stages of generation utilize rectified flow transformers, accepting image features encoded by DINOv2~\cite{oquab2023dinov2} as conditional injection."
- DINOv3: A later self-supervised Vision Transformer used for robust feature extraction from images, here for clustering buildings by appearance and height. "Specifically, we employ DINOv3~\cite{simeoni2025dinov3} to extract top-view visual features for each building, resulting in a 1024-dimensional feature vector ."
- F-score: The harmonic mean of precision and recall; in 3D evaluation, it measures the proportion of points within a threshold distance, reflecting reconstruction fidelity. "To evaluate geometric consistency, we compare point clouds from the generated regions against the OSM-based ground truth using the Chamfer Distance (CD) and F-score."
- Geospatial alignment: Ensuring generated 3D assets are aligned to real-world coordinates and orientations derived from geospatial data. "To achieve geometry-aware and geospatially aligned generation, we propose the OSM-based structural priors strategy, which introduces structural priors derived from OpenStreetMap (OSM) as explicit geometric guidance, as shown in Figure~\ref{fig:framework}(a)."
- HDBSCAN: A hierarchical density-based clustering algorithm that groups data points by density without requiring a preset number of clusters. "These representations are then clustered using HDBSCAN, where buildings within the same cluster are considered to share similar geometric and visual characteristics."
- Intersection-over-Union (IoU): A region-overlap metric that quantifies how well a predicted shape matches a ground-truth footprint. "We render the 3D model top-down, binarize it, and compute Intersection-over-Union (IoU) with the ground-truth footprint, averaged over all buildings."
- Levels of Detail (LODs): Discrete tiers of geometric fidelity (e.g., bounding boxes vs. extruded footprints) used to balance complexity and robustness. "During training, we randomly sample among multiple Levels of Detail (LODs) of OSM-derived geometry—such as LOD 0 (bounding boxes) and LOD 1 (extruded footprints)—and pair them with different noise intensities."
- MLLM: A multimodal LLM that integrates vision and language to produce semantic descriptions or guidance from images. "we construct a MLLM-powered semantic-guided generation pipeline, bridging semantic interpretation and geometric reconstruction."
- NeRF: Neural Radiance Fields; a neural representation that models volumetric scenes from viewpoints for photorealistic rendering. "including NeRF~\cite{mildenhall2021nerf}, 3DGS~\cite{kerbl20233d}, and Mesh."
- OpenStreetMap (OSM): A crowd-sourced geospatial database providing building footprints and attributes used as structural priors. "which introduces structural priors derived from OpenStreetMap (OSM) as explicit geometric guidance, as shown in Figure~\ref{fig:framework}(a)."
- Rectified flow: A generative approach that interpolates linearly between data and noise and learns a vector field to reverse the process. "Both stages of generation utilize rectified flow transformers, accepting image features encoded by DINOv2~\cite{oquab2023dinov2} as conditional injection."
- Regional Consistency Score (): A composite metric combining structural alignment and pairwise style similarity to assess region-level coherence. "Finally, the Regional Consistency Score () is defined as:"
- Score Distillation Sampling (SDS): A technique that distills gradients from 2D diffusion models into 3D optimization, enabling text-to-3D generation. "most notably with Score Distillation Sampling (SDS) introduced by DreamFusion~\cite{poole2022dreamfusion}."
- SLAT Flow: The second-stage rectified flow that generates structured latents containing both features and positions for 3D decoding. "In the second stage, it generates a structured latent via SLAT Flow."
- Sparse Structure VAE encoder: A variational encoder that maps sparse volumetric proxies (e.g., extruded footprints) into a latent space for structural priors. "and encode them into a Sparse Structure (SS) latent space using pretrained Sparse Structure VAE encoder~\cite{xiang2025structured}, yielding the prior latent $Z_{\mathcal{O}$."
- SS Flow: The first-stage rectified flow that produces sparse structural indices (activated voxels) indicating surface locations. "In the first stage, it generates a sparse structure $\{p_i}\}^L_{i=1}$ via SS Flow, where is the localization index of an activated voxel in the 3D voxel grid that intersects with the 3D asset's surface."
- SS Latent Norm: A channel-wise normalization applied to the SS latent to align its distribution with a Gaussian prior. "A channel-wise normalization (SS Latent Norm) is applied to align the latent distribution with a Gaussian prior, producing $Z'_{\mathcal{O}$."
- Structured Latent (SLAT) representation: A sparse latent format composed of feature–position pairs that carry explicit 3D spatial information. "We hypothesize this efficacy stems from the spatial nature of the Structured Latent (SLAT) representation~\cite{xiang2025structured}."
- VecSet representations: Representing 3D shapes as unordered sets of vectors, amenable to Transformer-based global relationship modeling. "The first path relies on vector-set (VecSet) representations~\cite{zhang2024clay,li2024craftsman3d,li2025triposg,lai2025unleashing,hunyuan3d22025tencent,hunyuan3d2025hunyuan3d,lai2025hunyuan3d}, as shown in 3DShape2VecSet~\cite{zhang20233dshape2vecset}."
- Voxel-VAE paradigm: Variational autoencoder approaches operating on voxel grids to learn generative 3D representations. "Another research line focuses on the Voxel-VAE paradigm, including works such as XCube~\cite{ren2024xcube}, TRELLIS~\cite{xiang2025structured} and SparseFlex~\cite{he2025sparseflex}."
Collections
Sign up for free to add this paper to one or more collections.