- The paper introduces a novel deviation ratio metric to evaluate LLM responses against cultural ground truths based on Hofstede’s dimensions.
- It employs the Values Survey Module to assess 10 LLMs over 20 countries, highlighting differences due to model origin and prompt language.
- Results reveal a cultural middle-ground bias that underscores the need for diverse training data to improve model cultural alignment.
An Evaluation of Cultural Value Alignment in LLM
Introduction
The paper critically evaluates the cultural alignment of various LLMs, focusing on their ability to represent cultural values across multiple countries and regions. In scenarios where LLMs interface with humans, ensuring that these models align with diverse cultural considerations is essential. The research employs a comprehensive methodology, utilizing the Values Survey Module to benchmark and assess cultural alignment across 20 countries and 10 different LLMs. This study highlights a pronounced alignment towards a "cultural middle ground," with results indicating the potential for cultural bias. Furthermore, it discusses how cultural value alignment can be improved in LLMs, considering factors such as model origin and prompt language.
Methodology
The paper introduces a robust methodology to assess cultural alignment in LLMs. Specifically, it evaluates two core aspects: how well LLMs align with cultural values and which countries are best aligned. The researchers employed the Values Survey Module developed by Geert Hofstede, consisting of 24 items across six cultural dimensions, to provide quantifiable metrics for cultural alignment.
Alignment Measurement Metric
To effectively measure cultural alignment, the paper introduces the deviation ratio, a metric designed to account for the inherent bias of models towards a global average culture. The deviation ratio (DR) is defined as:
Deviation Ratio=n1∑i=1nDifferencei61∑d∈D∣GTd−GTd∣
where D encompasses the six cultural dimensions, GTd is the ground truth for each dimension, GTd is the global average, and Differencei represents individual model deviations from the ground truth.
Experimental Setup
The study conducted evaluations using a set of 10 LLMs (5 US-origin and 5 China-origin) across 20 countries with their primary languages. The models were prompted with culturally specific questions translated into each country's primary language:
- A sample language prompt setup details the mechanism to ensure the model generates responses that reflect the cultural context of a specific country.
Analysis Results
Country and Model Basis Results
The results elucidate significant manifestations of cultural bias across LLM outputs, with the United States ranking highest in alignment:
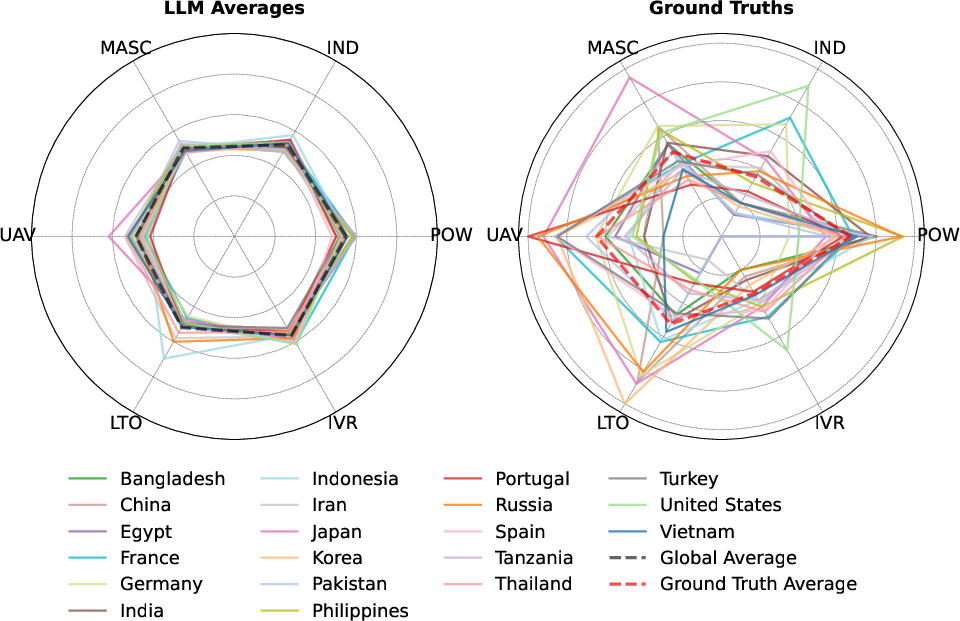
Figure 1: Comparison of ground truth and raw country results, with average ground truth and average of all LLM results.
Additionally, utilizing the deviation ratio metric reveals discrepancies between perceived and actual cultural alignment, identifying models like GLM-4 as particularly adept across multiple cultural contexts.
Model-Origin Analysis
Through detailed analysis (Figures 2-3), the paper uncovers that models generally reflect biases towards the origin cultures, emphasizing the need for more balanced datasets.
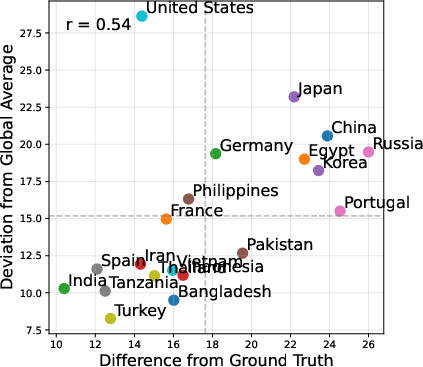
Figure 2: Deviation from global average vs. difference from ground truth.
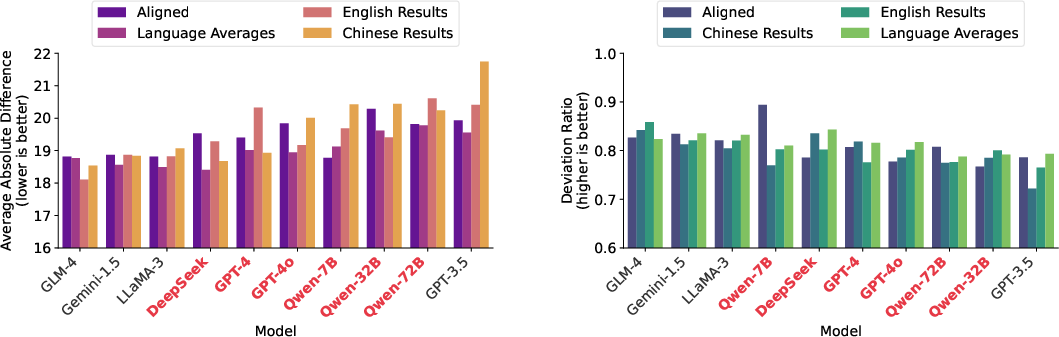
Figure 3: A comparison of model evaluation using two metrics: difference from ground truth (lower = better), and deviation ratio (higher = better).
Implications and Future Directions
This comprehensive analysis necessitates further exploration into culturally adaptable models, emphasizing the importance of considering model origin and prompt language. With the United States appearing more readily aligned than other countries (Figure 4), the necessity for diverse training data becomes unmistakable.
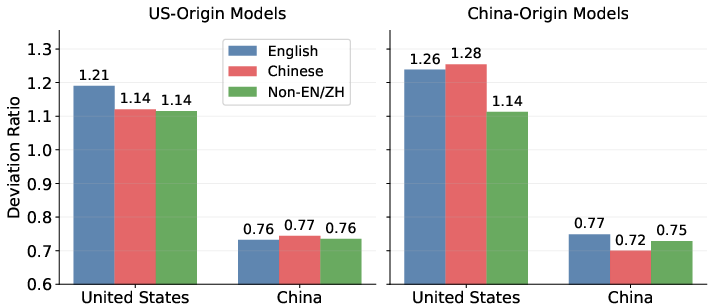
Figure 4: Deviation ratio comparison between models of US-origin (a) and China-origin (b), and three forms of prompts.
Future research directions should focus on enhancing model capabilities to encapsulate diverse cultural values without bias, potentially by integrating varied cultural datasets and refining evaluation metrics.
Conclusion
This study provides a nuanced understanding of cultural value alignment in LLMs, revealing substantial biases influenced by training data and model origin. The findings underscore the importance of diverse, culturally representative data to enhance model alignment and support broader cultural adaptability. Further research should prioritize developing methodologies that reduce cultural bias and expand the scope of cultural value alignment in LLMs.

