Dynamic graph neural networks for enhanced volatility prediction in financial markets
Published 22 Oct 2024 in q-fin.MF, cs.LG, and q-fin.ST | (2410.16858v1)
Abstract: Volatility forecasting is essential for risk management and decision-making in financial markets. Traditional models like Generalized Autoregressive Conditional Heteroskedasticity (GARCH) effectively capture volatility clustering but often fail to model complex, non-linear interdependencies between multiple indices. This paper proposes a novel approach using Graph Neural Networks (GNNs) to represent global financial markets as dynamic graphs. The Temporal Graph Attention Network (Temporal GAT) combines Graph Convolutional Networks (GCNs) and Graph Attention Networks (GATs) to capture the temporal and structural dynamics of volatility spillovers. By utilizing correlation-based and volatility spillover indices, the Temporal GAT constructs directed graphs that enhance the accuracy of volatility predictions. Empirical results from a 15-year study of eight major global indices show that the Temporal GAT outperforms traditional GARCH models and other machine learning methods, particularly in short- to mid-term forecasts. The sensitivity and scenario-based analysis over a range of parameters and hyperparameters further demonstrate the significance of the proposed technique. Hence, this work highlights the potential of GNNs in modeling complex market behaviors, providing valuable insights for financial analysts and investors.
The paper introduces a Temporal Graph Attention Network to capture temporal dependencies and volatility spillovers among global market indices.
It outperforms traditional models like GARCH and MLP, demonstrating enhanced short- to mid-term forecast accuracy.
By modeling dynamic graphs, the study provides actionable insights for real-time risk monitoring and systematic market analysis.
Enhanced Volatility Prediction with Dynamic Graph Neural Networks
The paper "Dynamic graph neural networks for enhanced volatility prediction in financial markets" (2410.16858) introduces a novel approach to volatility forecasting by employing a Temporal Graph Attention Network (Temporal GAT). This model captures both temporal dependencies and interdependencies between global market indices, offering an improvement over traditional methods like GARCH and Multilayer Perceptron (MLP). The paper emphasizes the effectiveness of using a volatility spillover index to model relationships between market indices, which enhances the model's ability to capture the transmission of market shocks.
Background and Motivation
Traditional volatility models, such as GARCH, often fail to account for the complex, non-linear relationships between multiple assets in global financial markets. GARCH models also heavily rely on historical data, which may not be sufficient in rapidly evolving markets. This paper addresses these limitations by representing global financial markets as dynamic graphs, where each market index is a node, and the edges represent the relationships between these indices. This approach allows the model to capture volatility spillovers, where the volatility of one market influences others.
Temporal Graph Attention Network (Temporal GAT)
The Temporal GAT model combines Graph Convolutional Networks (GCNs) and Graph Attention Networks (GATs) to capture the temporal and structural dynamics of volatility spillovers. GCNs aggregate feature information from a node's neighbors, while GATs use attention mechanisms to assign varying importance to nodes within a graph. The attention mechanism allows the model to focus on the most relevant relationships between indices, improving the accuracy of volatility predictions.
The layer-wise propagation rule for a multilayer GCN is given by:
Hl+1=σ(D~−21A~D~2−1H(l)W(l))
where:
H(l) is the feature matrix at layer l
A~=A+IN is the adjacency matrix of the undirected graph G with added self-loops
D~ii=∑jA~ij
W(l) is the layer-specific trainable weight matrix
σ is an activation function
The attention coefficients αij in GATs, which indicate the importance of node j's features to node i, are computed as follows:
h=h1,h2,⋯,hN; hi∈RF are the input features
W∈RF′×F is the weight matrix
a:RF′×RF′→R is the attention mechanism's weight vector
∣∣ denotes concatenation
Ni is the set of neighbors of node i in the graph.
Graph Construction and Data
The paper utilizes correlation-based and volatility spillover indices to construct directed graphs representing the relationships between global financial markets. The volatility spillover index is based on the framework developed by Diebold and Yilmaz [2009, 2012], which uses variance decompositions from Vector Autoregressive (VAR) models to measure the extent to which volatility shocks can transfer from one market to another.
The spillover index is calculated using the forecast error variance decompositions from the VAR model:
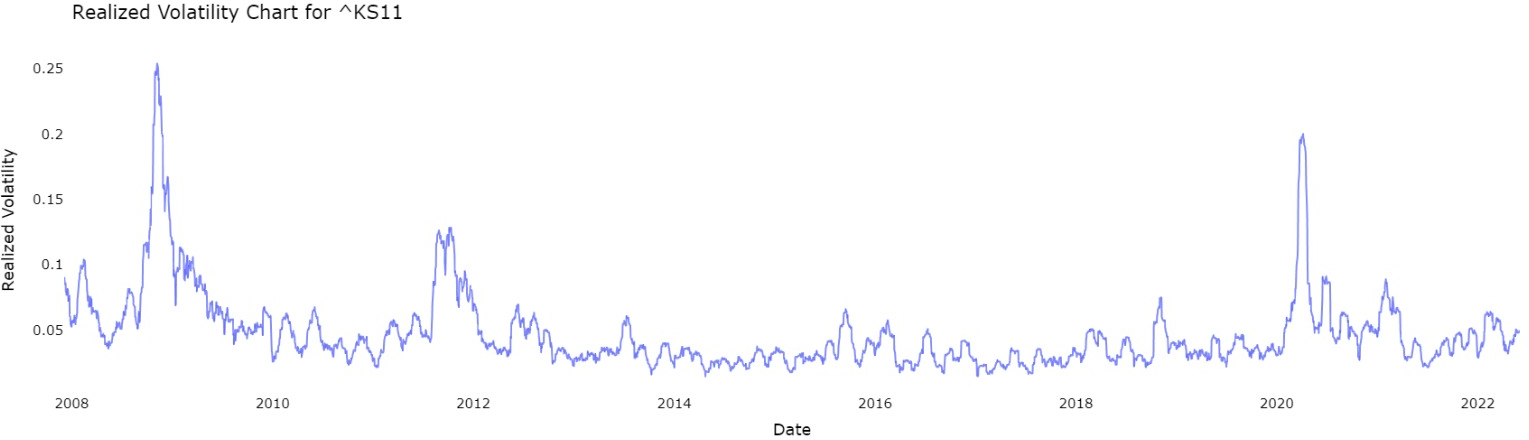
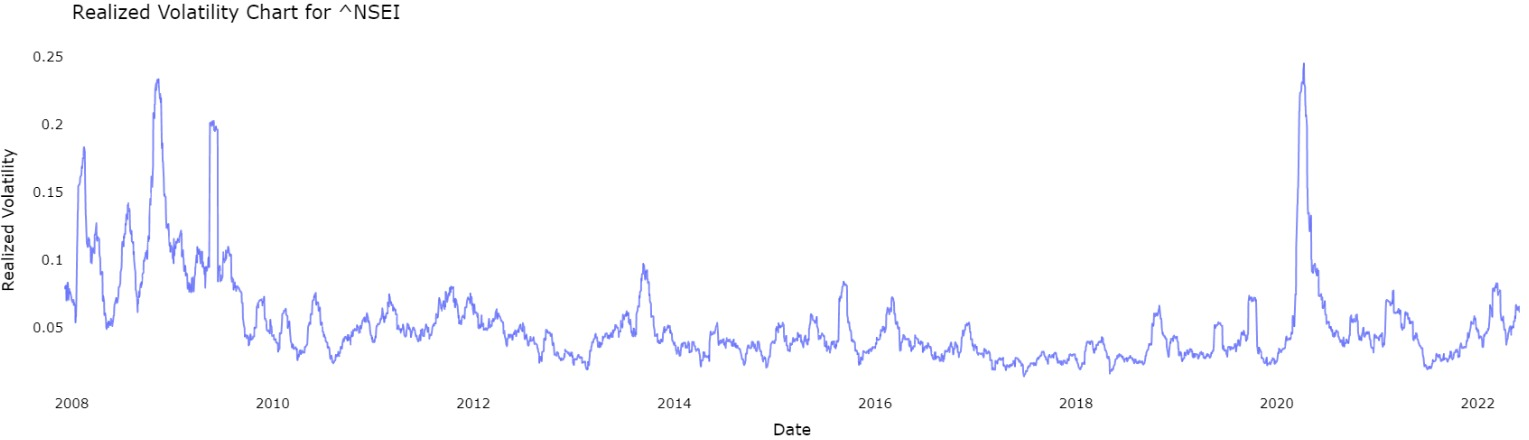
The data used in the study spans 15 years (November 2007 to June 2022) and includes eight major global market indices: GSPC, GDAXI, FCHI, FTSE, NSEI, N225, KS11, and HSI. Realized volatility (RV) is computed using daily adjusted closing prices. The dataset is divided into training, validation, and test sets to ensure robust evaluation of the model's performance.
Figure 1: Realized volatility for 8 selected indices [Left: GSPC, HSI, FTSE, GDAXI; Right: KS11, NSEI, N225, FCHI].
Empirical Results and Analysis
The empirical results demonstrate that the Temporal GAT model outperforms traditional GARCH models and other machine learning methods, particularly in short- to mid-term forecasts. Sensitivity analysis and robustness testing across different market conditions further validate the effectiveness of the proposed technique. The study also highlights the importance of using a volatility spillover index to model the relationships between market indices, as it significantly enhances the model's ability to capture the transmission of market shocks compared to conventional correlation-based methods.
Implications and Future Directions
This research highlights the potential of GNNs in modeling complex market behaviors, providing valuable insights for financial analysts and investors. The ability to capture interconnected market behavior allows for more accurate volatility clustering models, which can be beneficial in modeling complex asset relationships, assessing cross-asset and multi-asset volatility spillovers, and real-time systematic risk monitoring.
Future research directions could include:
Expanding the application of the Temporal GAT model to other asset classes, such as bonds, commodities, or cryptocurrencies.
Incorporating advanced features such as macroeconomic indicators, sentiment analysis, or high-frequency trading data to enhance predictive capabilities.
Exploring dynamic graph architectures, such as temporal graph networks, that adapt to changing market relationships.
Conclusion
The paper "Dynamic graph neural networks for enhanced volatility prediction in financial markets" (2410.16858) presents a significant advancement in volatility forecasting by leveraging the capabilities of Graph Neural Networks. The Temporal GAT model, with its ability to capture both temporal and structural dynamics, offers a promising approach for understanding and predicting volatility in global stock markets.
“Emergent Mind helps me see which AI papers have caught fire online.”
Philip
Creator, AI Explained on YouTube
Sign up for free to explore the frontiers of research
Discover trending papers, chat with arXiv, and track the latest research shaping the future of science and technology.Discover trending papers, chat with arXiv, and more.