Launch orbits of a kicked rotor and paint the road to Hamiltonian chaos in watercolor.
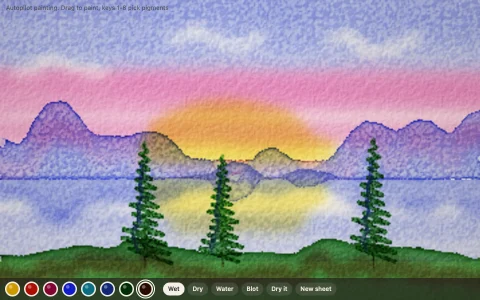
The Chirikov standard map, p' = p + K sin(theta) and theta' = theta + p', is a wheel kicked once per turn. Every orbit is first classified by a short run that tracks a tangent vector (a positive Lyapunov exponent means chaos) and its mean rotation per kick (a rational rotation number means an island chain of that period), then iterated tens of thousands of times into a per-channel absorbance buffer. The plate is composited like real pigment: paper color times exp(-absorbance), with a soft cap that keeps dense strokes on hue, a blurred bleed, darker rims where a wash meets dry paper, and granulation in the paper's grain. Invariant curves come out in blues, island chains in greens and ochres, and the chaotic sea in warm earth tones. As K passes 0.9716 the last torus that spans the whole circle breaks, and the sea floods across.
Try it. Click the plate to launch an orbit and read what it found, or drag to lay down a row of them. Drag the K slider (or press the arrow keys, Shift for bigger steps, or 1 to 6 for presets) and every orbit is recomputed at the new kick strength. C washes the plate, Space scatters a dozen random orbits.
Paste this into Claude Code, Codex or any coding agent to get a simple version running, then take it wherever you like.
Build an interactive phase portrait of the Chirikov standard map with JavaScript and the HTML canvas element. Put everything in a single index.html file with no libraries or build step, so I can open it directly in a browser.

The map is two lines: p = p + K * sin(theta), then theta = theta + p, with both wrapped into [0, 2 pi). It describes a wheel that gets a kick of strength K once per turn.

Start simple:
- Make a square canvas that stays sharp on high-DPI screens (scale by devicePixelRatio). Plot theta horizontally and p vertically, both from 0 to 2 pi.
- When I click, convert the click to (theta, p) and iterate the map from there about 20,000 times, drawing each point as a 1 pixel dot. Spread the work over a few frames with requestAnimationFrame so the orbit visibly grows.
- Give each new orbit its own color, and add a slider for K from 0 to 3 that clears the plot when it changes.
- Seed about 30 orbits automatically on load so the page is never empty.

Once that works, make it beautiful:
- Instead of drawing dots, accumulate hits into a Float32Array per color channel and turn them into pixels with ImageData. Paint it like watercolor on cream paper: pixel = paperColor * exp(-absorbance), so overlapping orbits mix like real pigment.
- Classify each orbit before painting it: track a tangent vector alongside the orbit (dp += K cos(theta) dtheta, dtheta += dp, renormalize each step) and average the log of its growth. A clearly positive average means chaos. Paint chaotic orbits in warm, thin washes and regular ones in cool, dense strokes.
- Show the value of K and mark 0.9716 on the slider, where the last invariant curve that wraps all the way around breaks.

Explain the key ideas in short code comments. When you're done, tell me how to open it and suggest three directions I could take it next, such as computing rotation numbers to label island chains, zooming into the fractal boundary between islands and chaos, or animating K slowly while orbits are recomputed.