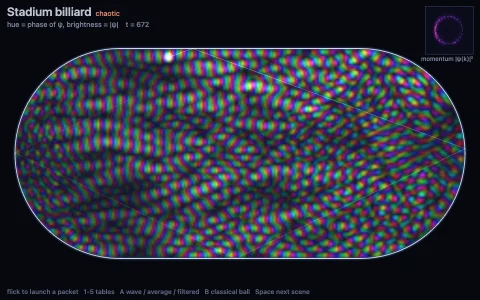
A fan of 1,000 balls in reshapable tables, linked live to the Birkhoff phase map.
A billiard ball moves in straight lines and reflects off the wall, so everything that matters happens at the bounces. Each bounce becomes a point (s, p): where along the wall it hit and the cosine of its angle to the wall. The walls are exact segments, arcs and an ellipse (with a numerically inverted arc-length table), and every ball is event driven, its next hit solved in closed form, so a thousand balls cost almost nothing. Forty invisible orbits fill the phase map as a progressive accumulation buffer, each one classified by how much of the map it covers: regular orbits trace cool curves, and chaotic dust is tinted by the wall color of the bounce it came from, so even a uniformly filled map shows the bands into which one step of the dynamics folds the wall. In the circle and ellipse every orbit stays on a curve; in the Bunimovich stadium and Sinai table one orbit fills everything; the mushroom has both, and the fan of balls launched a thousandth of a radian apart shows it in both views at once, a thin arc in phase space stretching and folding as the balls split.
Try it. Pick a table from the tabs (or press 1 to 5) and drag its slider (or the arrow keys) to reshape it: watch the circle's curves dissolve as the stadium's straight sides grow. Drag on the table to aim a fan of 1,000 balls, click it for a single tracer, and click the phase map to launch a ball from that exact (s, p). Hover the map to see which chord of the table a point stands for. F fires a new fan, C clears.
Paste this into Claude Code, Codex or any coding agent to get a simple version running, then take it wherever you like.
Build a dynamical billiards explorer with JavaScript and the HTML canvas element. Put everything in a single index.html file with no libraries or build step, so I can open it directly in a browser.

A billiard ball moves in a straight line and bounces off the walls with equal angles. In a circle that is perfectly orderly; in a stadium (two half circles joined by straight sides) it is chaotic. I want to see the difference.

Start simple:
- Make a canvas that fills the window and stays sharp on high-DPI screens. Draw a stadium table on the left half.
- Describe the wall as a short list of pieces: two straight segments and two half-circle arcs. Write a function that, given a position and a unit direction, returns the distance to the nearest wall hit by solving the line-segment and line-circle intersections exactly (no small time steps).
- Move a ball at constant speed. When it reaches a hit, reflect its direction about the wall normal: d = d - 2 (d . n) n. Draw its path as a fading trail.
- On the right half, draw the phase map: at every bounce, plot a point at x = how far along the wall the hit was (as a fraction of the perimeter) and y = cos of the angle between the outgoing direction and the wall.

Once that works, make it beautiful:
- Run about 30 extra invisible balls from random starts and let their bounces accumulate on the phase map, so the full portrait fills in within seconds.
- Add a slider for the length of the straight sides. At zero the table is a circle and the phase map is all horizontal lines; drag it up and watch them dissolve into dust.
- Launch a fan of 500 balls from one point with directions a thousandth of a radian apart, colored across a spectrum, and watch them stay together in the circle but scatter in the stadium.

Explain the key ideas in short code comments. When you're done, tell me how to open it and suggest three directions I could take it next, such as adding an ellipse and a mushroom-shaped table, clicking the phase map to launch a ball from that exact bounce, or measuring the Lyapunov exponent from how fast the fan spreads.