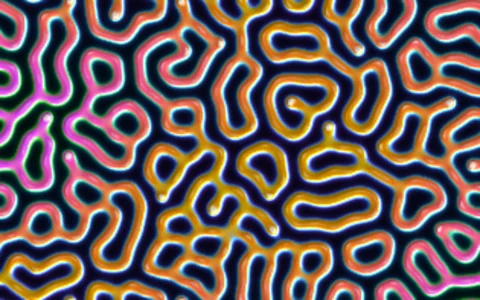
Three lizard morphs chase each other in spirals until mobility tips them into extinction.
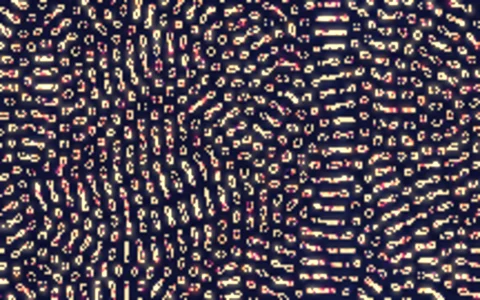
Side-blotched lizards come in three throat colors that beat each other in a cycle, like rock paper scissors. Here each site of a lattice of about 36,000 sites is empty or holds one morph, and millions of random neighbor pairs a second react: a morph kills the one it beats, spreads into gaps, or swaps places at an exchange rate set by the mobility M. This is the May-Leonard model with mobility from Reichenbach, Mobilia and Frey: below a critical M of about 4.5 x 10^-4 the species chase each other in rotating spirals and coexist, but spiral size grows with mobility, and once the spirals no longer fit in the world two species die out for good. The tapestry mixes each morph's locally smoothed density with sharpened weights under a generated twill texture, and the inset tracks the population mix on a ternary plot, which spirals out to a corner as biodiversity collapses.
Try it. Drag the mobility slider (or use the arrow keys) across the critical point and back. Paint with the brush: Mix drops a pinwheel of every morph that winds up into a new spiral, or pick one morph with the buttons or keys 1 to 5 (0 for Mix). Switch between 3, 4 and 5 species with the species button or S; press V for fresh spiral cores and R for random noise. Left alone, it pushes past the critical point, watches the collapse, then reintroduces the lost morphs.
Paste this into Claude Code, Codex or any coding agent to get a simple version running, then take it wherever you like.
Build a rock paper scissors ecosystem on a lattice, the May-Leonard model with mobility, with JavaScript and the HTML canvas element. Put everything in a single index.html file with no libraries or build step, so I can open it directly in a browser.

Start simple:
- Make a canvas that fills the window, stays sharp on high-DPI screens (scale by devicePixelRatio), and resizes with the window.
- Use a wraparound grid of about 200 x 125 sites in a Uint8Array. Each site is empty (0) or holds species 1, 2 or 3, and species i beats species i + 1 (3 beats 1). Fill it randomly.
- Each frame, run a few hundred thousand reactions. A reaction picks a random site and one of its four neighbors, then with probabilities proportional to the rates: selection (rate 1) kills the neighbor if the site's species beats it; reproduction (rate 1) copies the site's species into an empty neighbor; exchange (rate eps) swaps the two.
- Draw the grid into an ImageData, one pixel per site, and scale it up with drawImage.
- Mobility is M = 2 eps / N, where N is the number of sites. Start at M = 1e-4 and you should see spirals.

Once that works, make it beautiful:
- Add a log-scale slider for M from 1e-6 to 4e-3 and mark the critical value 4.5e-4. Above it, the spirals outgrow the world and two species go extinct.
- Smooth the picture: blur each species' density over a 5 x 5 box and mix the colors with sharpened weights, for soft pastel bands.
- Let dragging the mouse paint a species, so new spirals can be started after an extinction.
- Plot the three population fractions in a small ternary diagram with a fading trail.

Explain the key ideas in short code comments. When you're done, tell me how to open it and suggest three directions I could take it next, such as four or five species and the alliances they form, measuring how spiral wavelength grows with M, or a woven tapestry texture over the lattice.