Peel a note's harmonics away, fundamental first, and the heard pitch refuses to move.
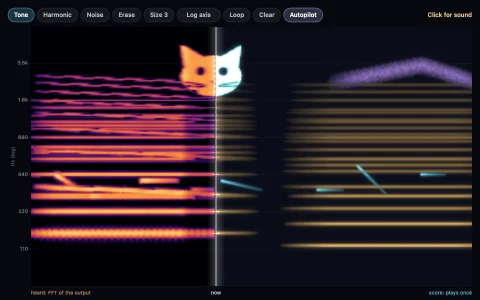
The tone is ten harmonics of G3 (196 Hz), and the autopilot removes them from the bottom up: with the 196 Hz component gone, and then everything below 1568 Hz, the heard pitch stays G3, until too few components are left to share a period and it collapses onto what remains. A live autocorrelation pitch detector explains why: every frame the last 2,048 samples go through an FFT, their power spectrum comes back as the autocorrelation (the Wiener-Khinchin theorem), and the first lag that nearly matches the best one, and matches again at twice that lag, is the period, refined with a parabola and guarded against octave slips. The waveform panel marks that period, the subharmonic stacks show the same thing in frequency (every component divided by 1, 2, 3 ... piles up on the missing note), and the track compares what is present with what is heard. Other scenes show odd harmonics keeping the pitch while even harmonics jump it an octave, and a descending scale in which every single component rises at every step while the pitch falls an octave.
Try it. Click a harmonic in the spectrum to add or remove it, and drag a bar to set its level. F toggles the fundamental, the arrow keys change the note, R plays a pure reference tone at the heard pitch to compare, keys 1 to 3 or Space change scene, M mutes; sound starts on the first click.
Paste this into Claude Code, Codex or any coding agent to get a simple version running, then take it wherever you like.
Build an interactive demonstration of the missing fundamental illusion with a live pitch detector, in JavaScript with the HTML canvas element and the Web Audio API. Put everything in a single index.html file with no libraries or build step, so I can open it directly in a browser.

Start simple:
- Synthesize a tone from harmonics 1 to 10 of 196 Hz (G3), summing cosines sample by sample. Keep each harmonic's phase continuous and ramp its amplitude smoothly when it is switched on or off, so nothing clicks.
- Generate samples in chunks into AudioBuffers and schedule them back to back. Create the AudioContext only after a click and show a "Click for sound" hint until then. Keep the newest 2,048 samples in a ring buffer even before sound starts.
- Draw the spectrum as bars, one per harmonic, and let a click on a bar toggle it.
- Every frame, compute the autocorrelation of the ring buffer: FFT (zero padded to 4,096), square the magnitudes, inverse FFT, normalize by the value at lag 0. Pick the first local peak that comes within about 14 percent of the highest peak; its lag is the period and FS / lag is the pitch.
- Show the detected pitch in big type with its note name, and plot the autocorrelation curve with the chosen peak marked.

Once that works, make it beautiful:
- Add an autopilot that removes harmonics from the bottom up, one every second or two, with captions, so you can watch the pitch hold at 196 Hz while the lowest component climbs past 1.5 kHz.
- Show the waveform with the detected period marked, and a scrolling track of present components versus the heard pitch on a log frequency axis.
- Draw each component's subharmonics (f / 1, f / 2, f / 3 ...) as stacked dots and highlight the stack where they all agree.

Explain the key ideas in short code comments. When you're done, tell me how to open it and suggest three directions I could take it next, such as an even-harmonics-only mode that jumps an octave, a scale where every component rises while the pitch falls, or a pure reference tone to compare by ear.