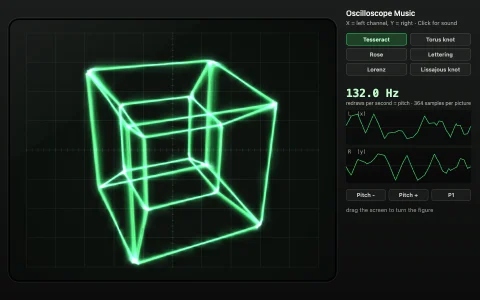
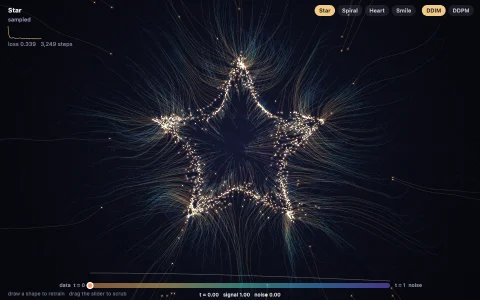
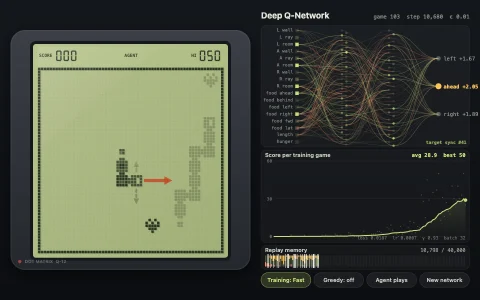
A never-trained random reservoir forecasts chaos on a green phosphor oscilloscope.
An echo state network is a fixed, random recurrent network of 300 tanh neurons, sparsely wired and scaled to a chosen spectral radius. While it listens to a chaotic signal (the Mackey-Glass delay equation or the Lorenz system), only a linear readout is fitted: the ridge regression normal equations are accumulated step by step and solved once by Cholesky decomposition. Then the teacher lets go and the prediction is fed back as the next input, so the network runs free and continues the chaos on its own: the bright trace is the oracle, the dim one the true future, and the X/Y tube draws the attractor it is tracing. The autopilot sweeps the spectral radius knob while an invisible twin of the same experiment trains and free-runs the remaining radii a few milliseconds per frame, plotting how many steps each setting stays within tolerance: short for a reservoir that forgets too fast, longest near a radius of one, collapsing once the reservoir's own dynamics turn chaotic.
Try it. Drag the Spectral Radius or Leak Rate knob up and down and release to retrain, or click the chart to try a radius. Signal switches between Mackey-Glass and Lorenz (S), Retrain refits (T or Space), the arrow keys nudge the radius, and L steps the leak rate.
Paste this into Claude Code, Codex or any coding agent to get a simple version running, then take it wherever you like.
Build an echo state network that learns to forecast a chaotic signal, using JavaScript and the HTML canvas element. Put everything in a single index.html file with no libraries or build step, so I can open it directly in a browser.

Start simple:
- Make a canvas that fills the window, stays sharp on high-DPI screens (scale by devicePixelRatio), and resizes with the window. Use a near-black background.
- Generate the Mackey-Glass series: dx/dt = 0.2 x(t-17) / (1 + x(t-17)^10) - 0.1 x, integrated with Euler steps of 0.1 and a history buffer for the delay, sampled every 1 time unit. Use tanh(x - 1) as the signal.
- Build a reservoir of 200 tanh neurons with a sparse random weight matrix (about 5% nonzero) scaled to a spectral radius near 1, plus random input and bias weights. Estimate the spectral radius by repeatedly multiplying a vector by the matrix and measuring how fast its length grows.
- Drive the reservoir with 2,000 samples (state = tanh(W state + W_in input + bias)), skip the first 100, and collect the states. Fit a linear readout that predicts the next sample with ridge regression: solve (X^T X + lambda I) w = X^T y with a small Cholesky or Gaussian elimination routine.
- Then switch to free run: feed each prediction back in as the next input. Plot the true continuation and the prediction as two scrolling lines.

Once that works, make it beautiful:
- Style it as a green phosphor oscilloscope with a graticule, glow and faint scanlines.
- Add an X/Y display plotting x(t) against x(t - 17) with slowly fading persistence, so the attractor draws itself.
- Add a slider for the spectral radius that retrains on release, and show how many steps the prediction stays close to the truth.

Explain the key ideas in short code comments. When you're done, tell me how to open it and suggest three directions I could take it next, such as forecasting the Lorenz system, sweeping the spectral radius to chart the edge of chaos, or showing the reservoir neurons as a glowing grid.