- The paper quantifies a systematic overestimation (~10–15% on average) of turbulent velocity dispersion in CO lines due to radiative transfer and chemical effects.
- It employs isothermal MHD simulations with non-LTE radiative transfer and non-equilibrium chemistry to produce high-fidelity synthetic PPV cubes for CO (1-0) and (2-1) transitions.
- The study introduces a robust turbulence isolation methodology and a correction factor (R ≈ 0.88) to recover intrinsic turbulence, impacting models of turbulence-regulated star formation.
Turbulence Inference from CO Spectral Observations: Quantifying Radiative Transfer and Chemical Effects
Introduction
The paper addresses the critical problem of accurately inferring turbulence properties in molecular clouds from position-position-velocity (PPV) spectral observations, focusing on the impact of radiative transfer (RT), opacity, and chemical effects on turbulence measurements using CO rotational lines. Previous methods for reconstructing the 3D turbulent velocity dispersion from PPV data have relied on the optically thin approximation, neglecting RT and chemical complexity. This work systematically quantifies the biases introduced by these effects and provides a correction framework for turbulence measurements derived from CO observations.
Simulation Framework and Synthetic Observations
The study utilizes an isothermal MHD simulation of a turbulent, collapsing molecular cloud, incorporating a non-equilibrium gas-grain chemical network to model the formation and destruction of 115 chemical species. The simulation is post-processed with the non-LTE RT code PyRaTE to generate synthetic PPV cubes for the 12CO (1-0) and (2-1) transitions. The input parameters—density, temperature, velocity, and chemical abundances—are consistent with typical solar neighborhood ISM conditions. The RT calculations account for line excitation, optical depth, and the cosmic microwave background, yielding high-fidelity synthetic spectra.
Moment maps (zeroth, first, and second) are constructed from these cubes, with the first moment (velocity centroid) being the primary diagnostic for turbulence. An "Ideal" case, representing the optically thin limit with emission proportional to gas density, is used as a reference to isolate the effects of RT and chemistry.
Morphology and Dynamics in Moment Maps
The zeroth-moment maps (integrated intensity) reveal central brightening in the Ideal case, while CO maps show central dimming due to self-absorption and high optical depth, obscuring the far side of the cloud.
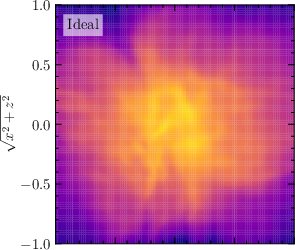
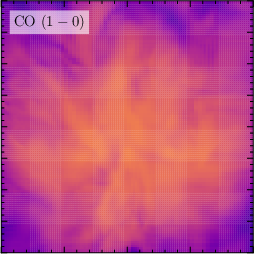
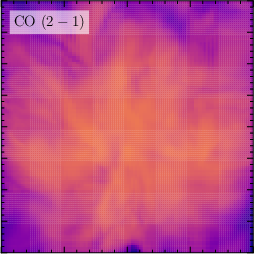
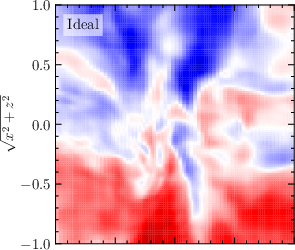
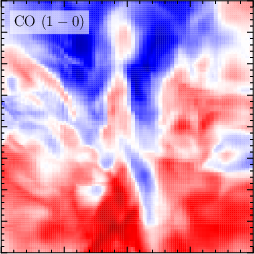
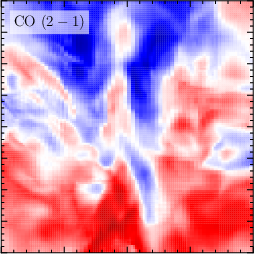
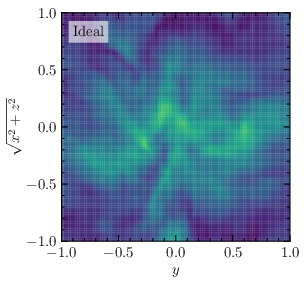
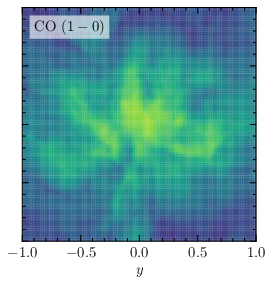
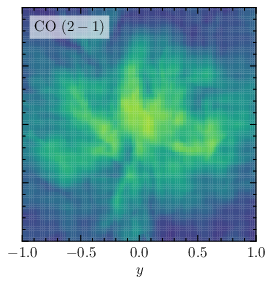
Figure 1: Zeroth-moment maps (top), first-moment maps (middle), and second-moment maps (bottom) for the LOS defined via Eq.~\ref{eqn:los} at t=ff; columns: Ideal, CO (1-0), CO (2-1).
The first-moment maps display large-scale velocity gradients associated with gravitational collapse. The Ideal case is smoother, while CO maps exhibit enhanced small-scale structure due to differential radiative transfer effects. The second-moment maps (velocity dispersion) show higher central values in the CO cases, reflecting opacity broadening and more uniform weighting of velocities along the LOS.
Turbulence Isolation Methodology
To disentangle turbulent from systematic motions (collapse, rotation, shear), the first-moment maps are processed with a Gaussian low-pass filter (FWHM =L/2) to remove large-scale gradients. The residuals represent the turbulence-isolated velocity field.
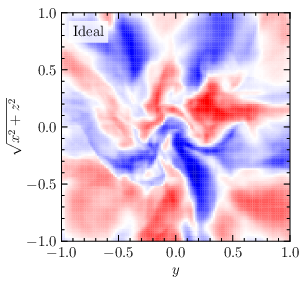
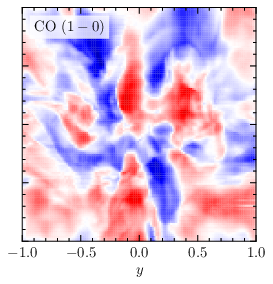
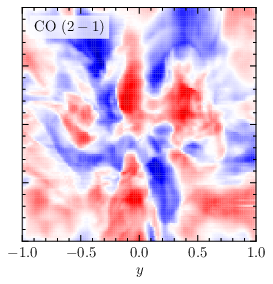
Figure 3: First-moment maps before (top), after Gaussian smoothing (middle), and after turbulence isolation (bottom) for Ideal, CO (1-0), and CO (2-1) cases.
This approach is robust across different lines of sight and evolutionary stages, yielding turbulence-isolated maps with nearly isotropic velocity dispersions. The PDFs of the turbulence-isolated first-moment maps are approximately Gaussian, with the CO cases consistently exhibiting larger standard deviations than the Ideal case.
Quantitative Impact of Radiative Transfer and Chemistry
The key result is the quantification of the systematic overestimation of the 1D turbulent velocity dispersion (σv) when using CO lines. The ratio R=σv,Ideal/σv,CO is found to be 0.88−0.08+0.09 for CO (1-0) and 0.88−0.08+0.10 for CO (2-1), averaged over multiple lines of sight and evolutionary stages. This implies that previous turbulence measurements based on CO lines are overestimated by ∼10–15% on average, with possible overestimates up to 40% at 1σ.
The correction factor R is robust to projection effects and cloud evolution, but can exceed unity in specific configurations (e.g., late-stage collapse along the principal axis with significant CO depletion). The methodology is directly applicable to observational data: after turbulence isolation, the measured σv from CO should be multiplied by R to recover the intrinsic value.
Evolutionary and Line-of-Sight Dependence
The analysis at later evolutionary times (t=1.2tff) confirms the persistence of the bias, with only moderate quantitative changes. The increase in turbulent velocity dispersion at later times is attributed to turbulence driven by gravitational collapse. The correction factor R remains applicable, although the degree of CO depletion and the viewing geometry can introduce additional variation.
Implications and Limitations
The findings have direct implications for studies of the density–Mach number relation, turbulence driving parameter b, and star formation models that rely on accurate turbulence measurements. The systematic overestimation of σv in CO-based studies propagates into derived quantities such as the 3D Mach number and the turbulence driving parameter, potentially biasing interpretations of turbulence-regulated star formation.
The correction factor R is calibrated for solar neighborhood conditions and 12CO (1-0) and (2-1) lines. Its generalization to other environments (e.g., different metallicity, radiation field, cosmic-ray ionization rate) or other tracers (e.g., HCN, HCO+) requires further study. The methodology, however, is extensible to other lines and conditions with appropriate simulation and RT modeling.
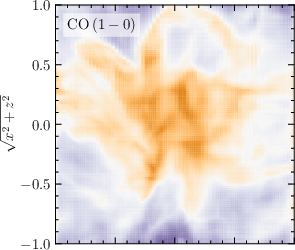
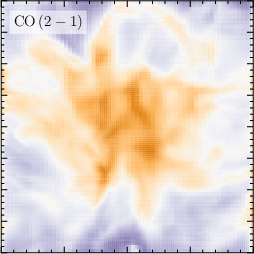
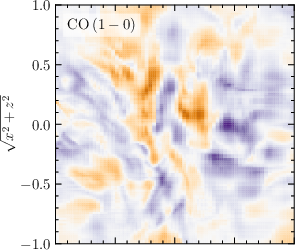
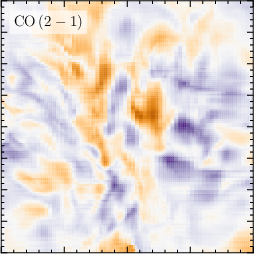
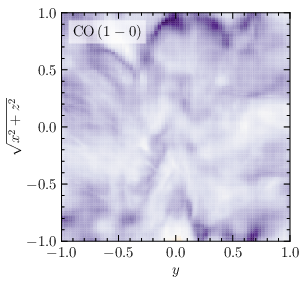
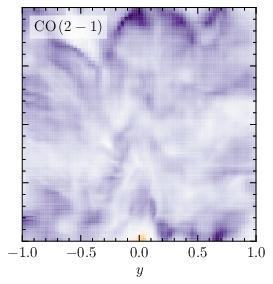
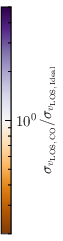
Figure 5: Spatial variations between the CO cases and the Ideal case for the zeroth, first, and second moment (top to bottom).
Optical Depth Structure
The study also visualizes the spatial distribution of optical depth in the CO lines, demonstrating that the central regions of the cloud are highly optically thick (τ≫100), which is the primary driver of the observed biases.
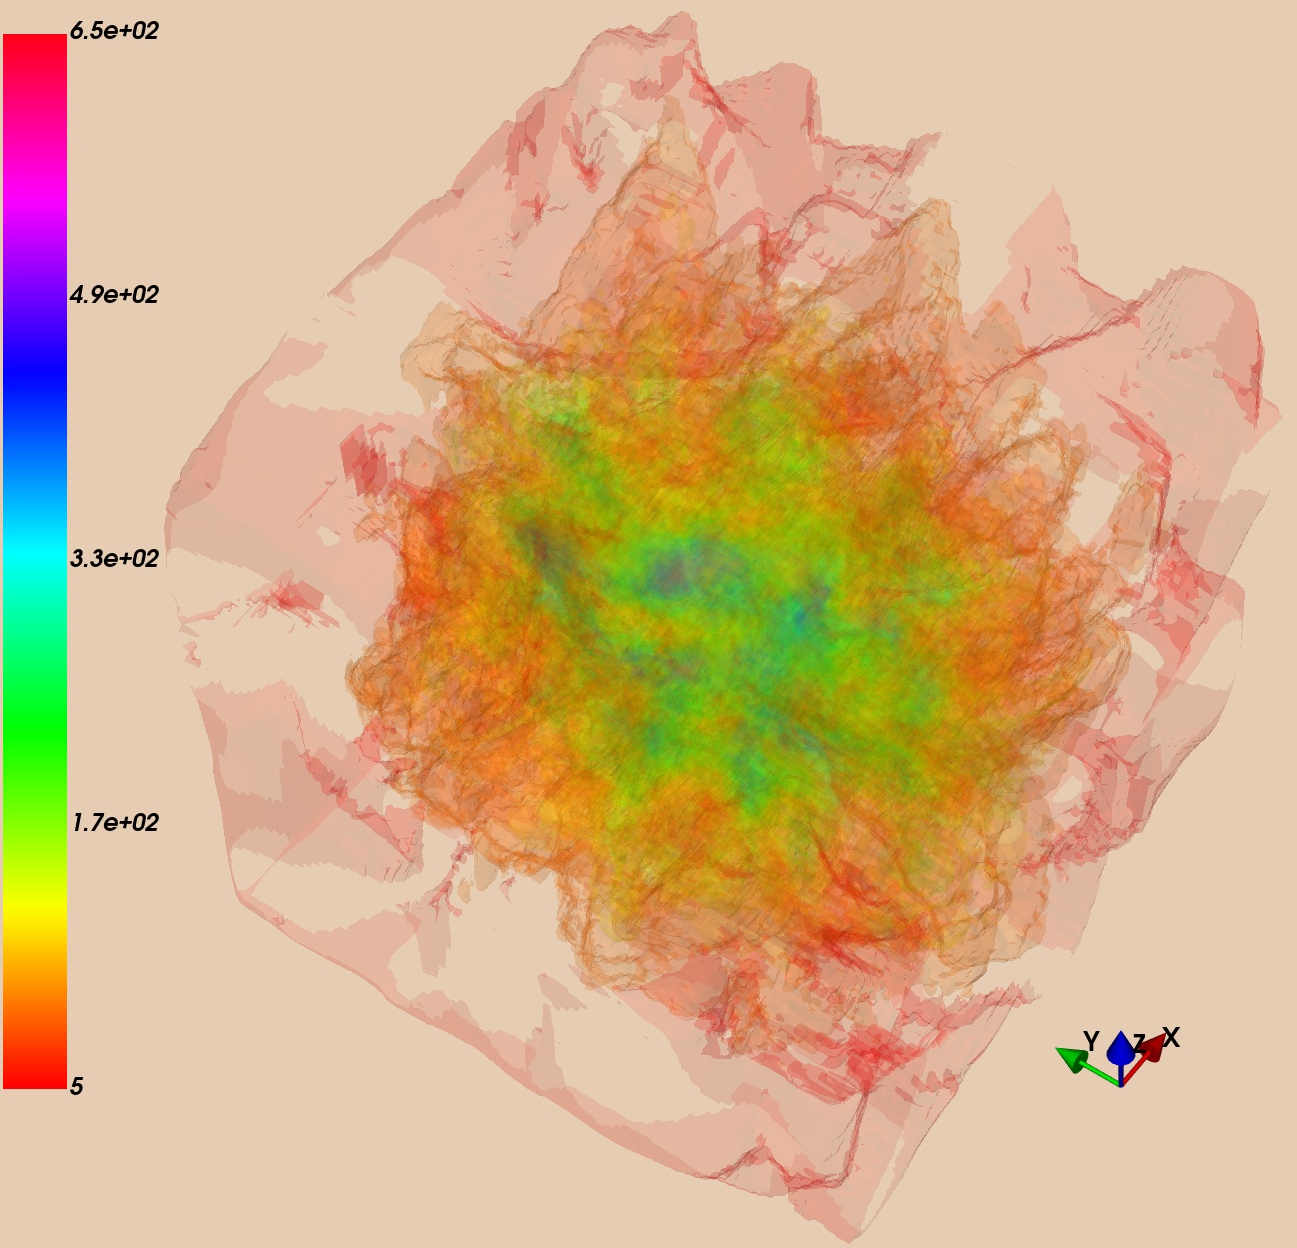
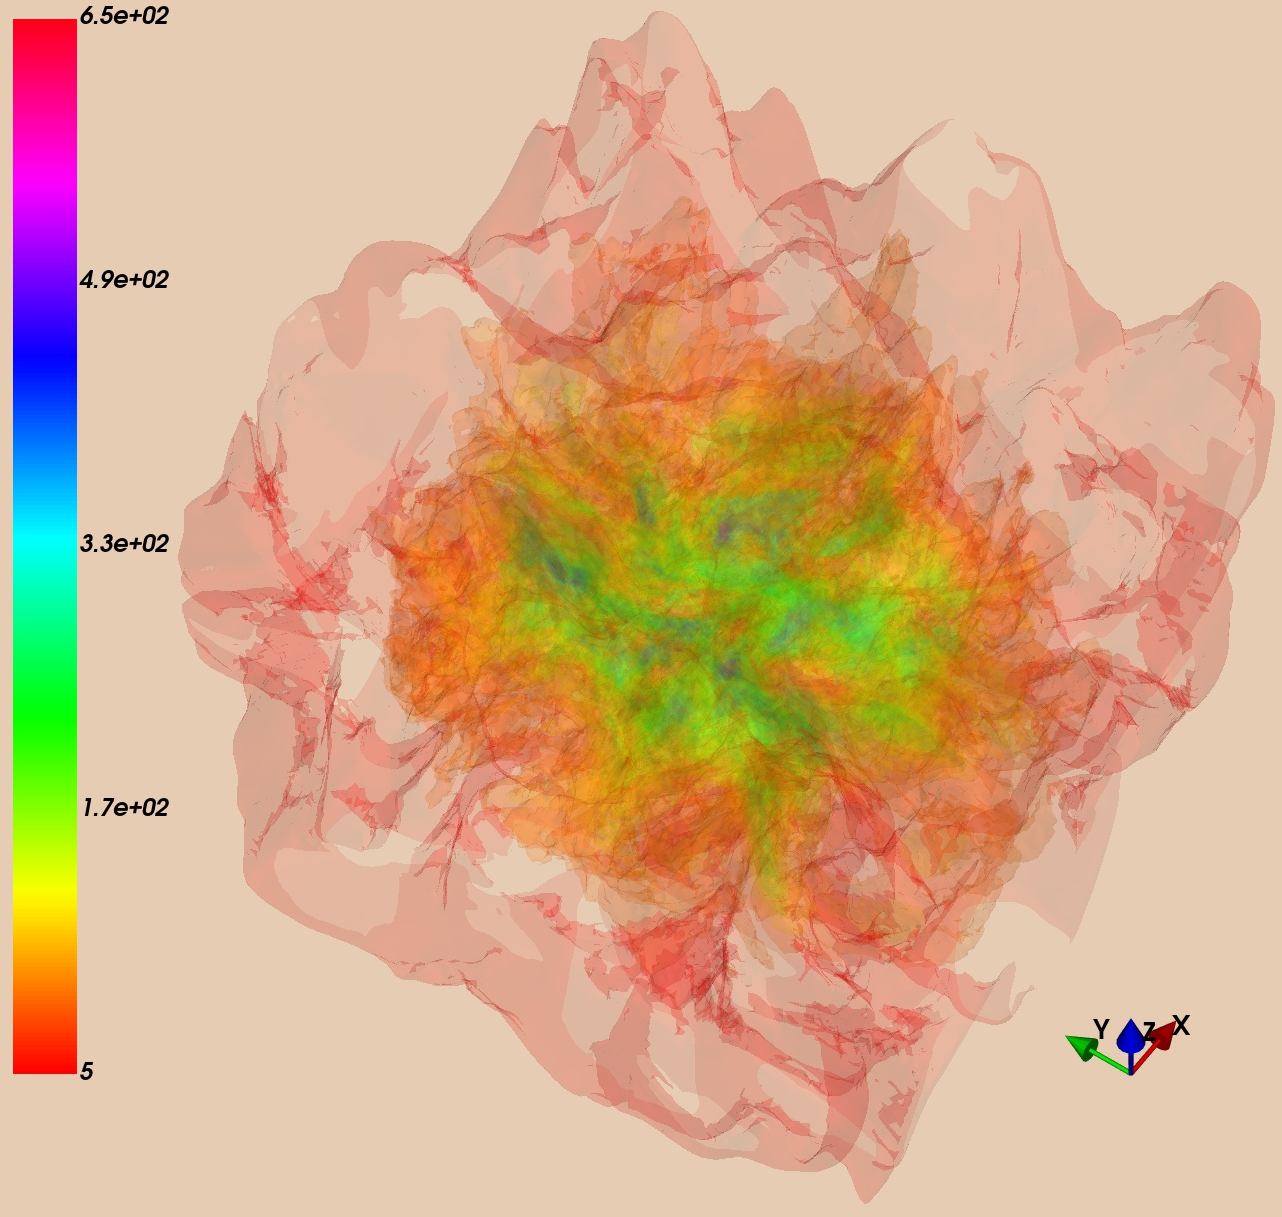
Figure 7: Iso-surfaces of the optical depth of the J=1→0 transition of CO at early and late evolutionary stages; central regions are always highly optically thick.
Conclusion
This work provides a rigorous quantification of the biases introduced by radiative transfer and chemical effects in turbulence measurements from CO spectral lines. The main conclusions are:
- CO-based measurements of turbulent velocity dispersion systematically overestimate the intrinsic value by $10$–15% on average, with possible overestimates up to 40%.
- A correction factor R≈0.88 should be applied to turbulence measurements from CO (1-0) and (2-1) lines under typical ISM conditions.
- The turbulence isolation methodology is robust and can be directly applied to observational data.
- The results have significant implications for the interpretation of turbulence-regulated star formation and the calibration of theoretical models.
Future work should extend this analysis to a broader range of physical conditions and molecular tracers, enabling more accurate turbulence inference across diverse galactic environments.