- The paper presents the first JWST/MIRI 15 μm phase curves, conclusively ruling out thick, efficient heat-redistributing atmospheres for TRAPPIST-1 b.
- It employed multiple independent analyses with MCMC modeling, deriving dayside brightness temperatures of approximately 490K for b and 369K for c.
- The findings constrain atmospheric evolution, indicating an airless rocky surface for b and a possible thin, greenhouse-poor atmosphere for c.
JWST Thermal Phase Curves Exclude Thick Atmospheres for TRAPPIST-1 b and c
Introduction
This study presents the first JWST/MIRI 15 μm thermal phase curves for the temperate terrestrial exoplanets TRAPPIST-1 b and c, providing direct constraints on their atmospheric properties. The analysis leverages the unique orbital configuration of the TRAPPIST-1 system, enabling simultaneous phase curve and secondary eclipse measurements for both planets. The primary objective is to empirically test the survivability and characteristics of atmospheres on rocky exoplanets orbiting ultracool dwarfs, a key question for planetary evolution and habitability.
Observational Strategy and Data Reduction
The JWST/MIRI observations (Program GO 3077) covered a full phase curve of TRAPPIST-1 b and a partial phase curve of c, with 59 hours of continuous imaging at 15 μm. Four independent data reductions and analyses were performed, all yielding consistent results. The fiducial analysis utilized the Eureka! pipeline for calibration, IRAF/DAOPHOT for photometric extraction, and a custom Fortran MCMC code (Trafit) for global light curve modeling. Instrumental systematics, stellar flares, and astrophysical signals (transits, occultations, planet-planet occultations) were rigorously modeled and removed.
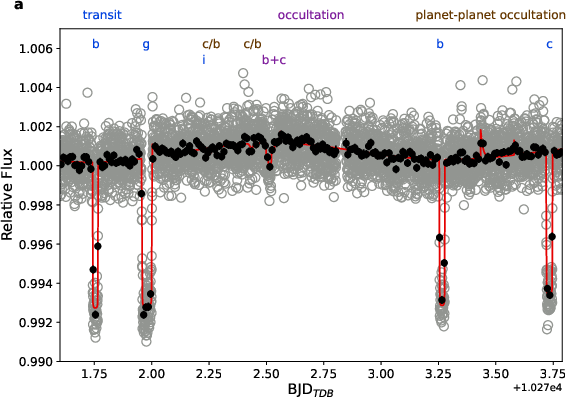
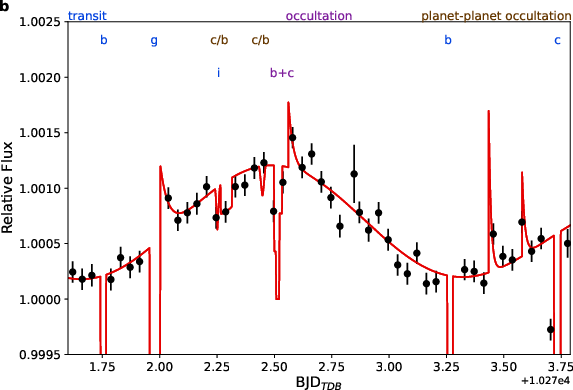
Figure 1: Detrended Program 3077 light curve showing transits, occultations, and phase curve features for TRAPPIST-1 b and c.
Phase Curve Modeling and Statistical Analysis
Three global MCMC analyses were conducted:
- Analysis #1: Sinusoidal phase curve model allowing for atmospheric heat redistribution.
- Analysis #2: Quasi-Lambertian model assuming both planets are airless.
- Analysis #3: Hybrid model with b airless and c allowed to have an atmosphere.
All analyses employed informative priors for system parameters and rigorous convergence diagnostics. The phase curve models incorporated both day- and night-side fluxes, phase offsets, and accounted for planet-planet occultations.
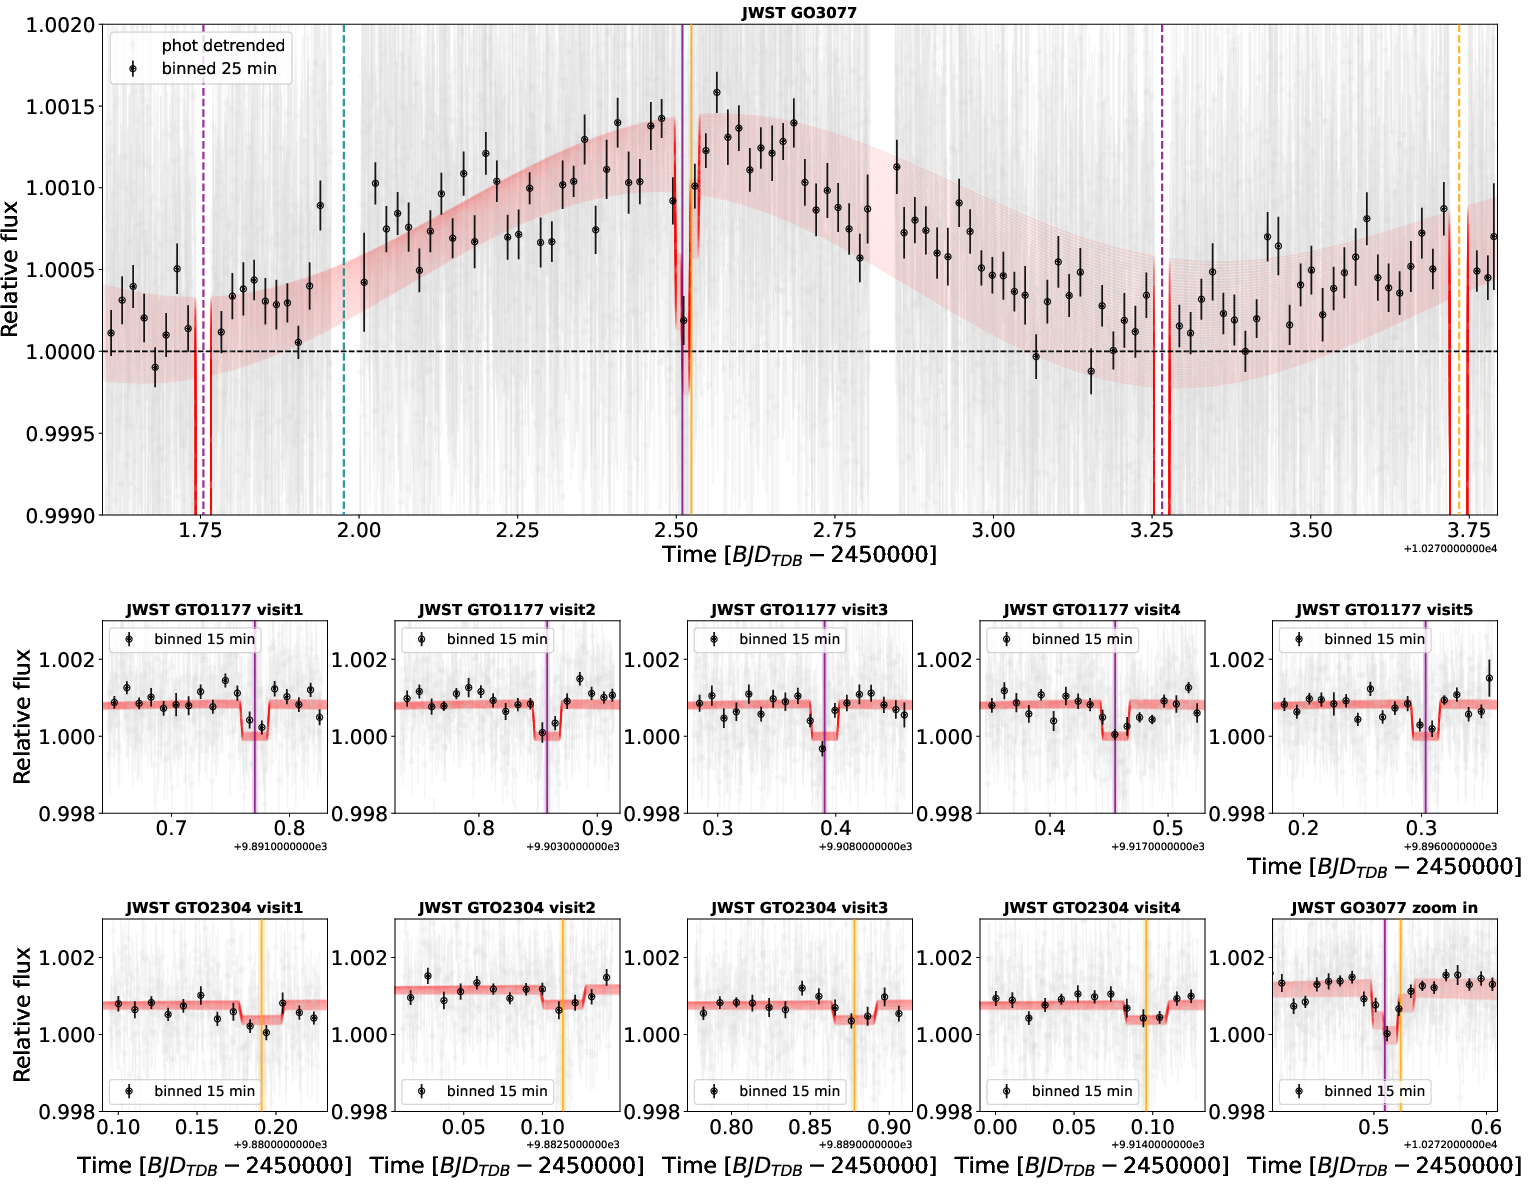
Figure 2: Range of best-fit phase curve and eclipse models for TRAPPIST-1 b and c across all JWST programs.
Key Results: Thermal Emission and Atmospheric Constraints
TRAPPIST-1 b
- Dayside brightness temperature: 490±17 K
- Nightside flux: 39−27+55 ppm (consistent with zero)
- Phase offset: −6.5±6.4 deg (consistent with zero)
- Bayes factor: Decisively favors airless model (BIC difference > 1000)
- Heat redistribution: Probability of full redistribution < 0.0006%
These results robustly exclude any thick atmosphere with efficient heat transport. The phase curve and secondary eclipse data are best fit by a low-albedo, ultramafic rocky surface.
TRAPPIST-1 c
- Dayside brightness temperature: 369±23 K
- Nightside flux: 62−43+60 ppm (statistically indistinguishable from b)
- Phase offset: 10−22+25 deg (consistent with zero)
- Atmospheric scenarios: Dense CO2-rich and steam atmospheres are disfavored; thin O2-dominated atmospheres with low greenhouse opacity remain viable.
The data for c are less constraining due to lower SNR, but still exclude efficient heat redistribution and most thick atmosphere scenarios.
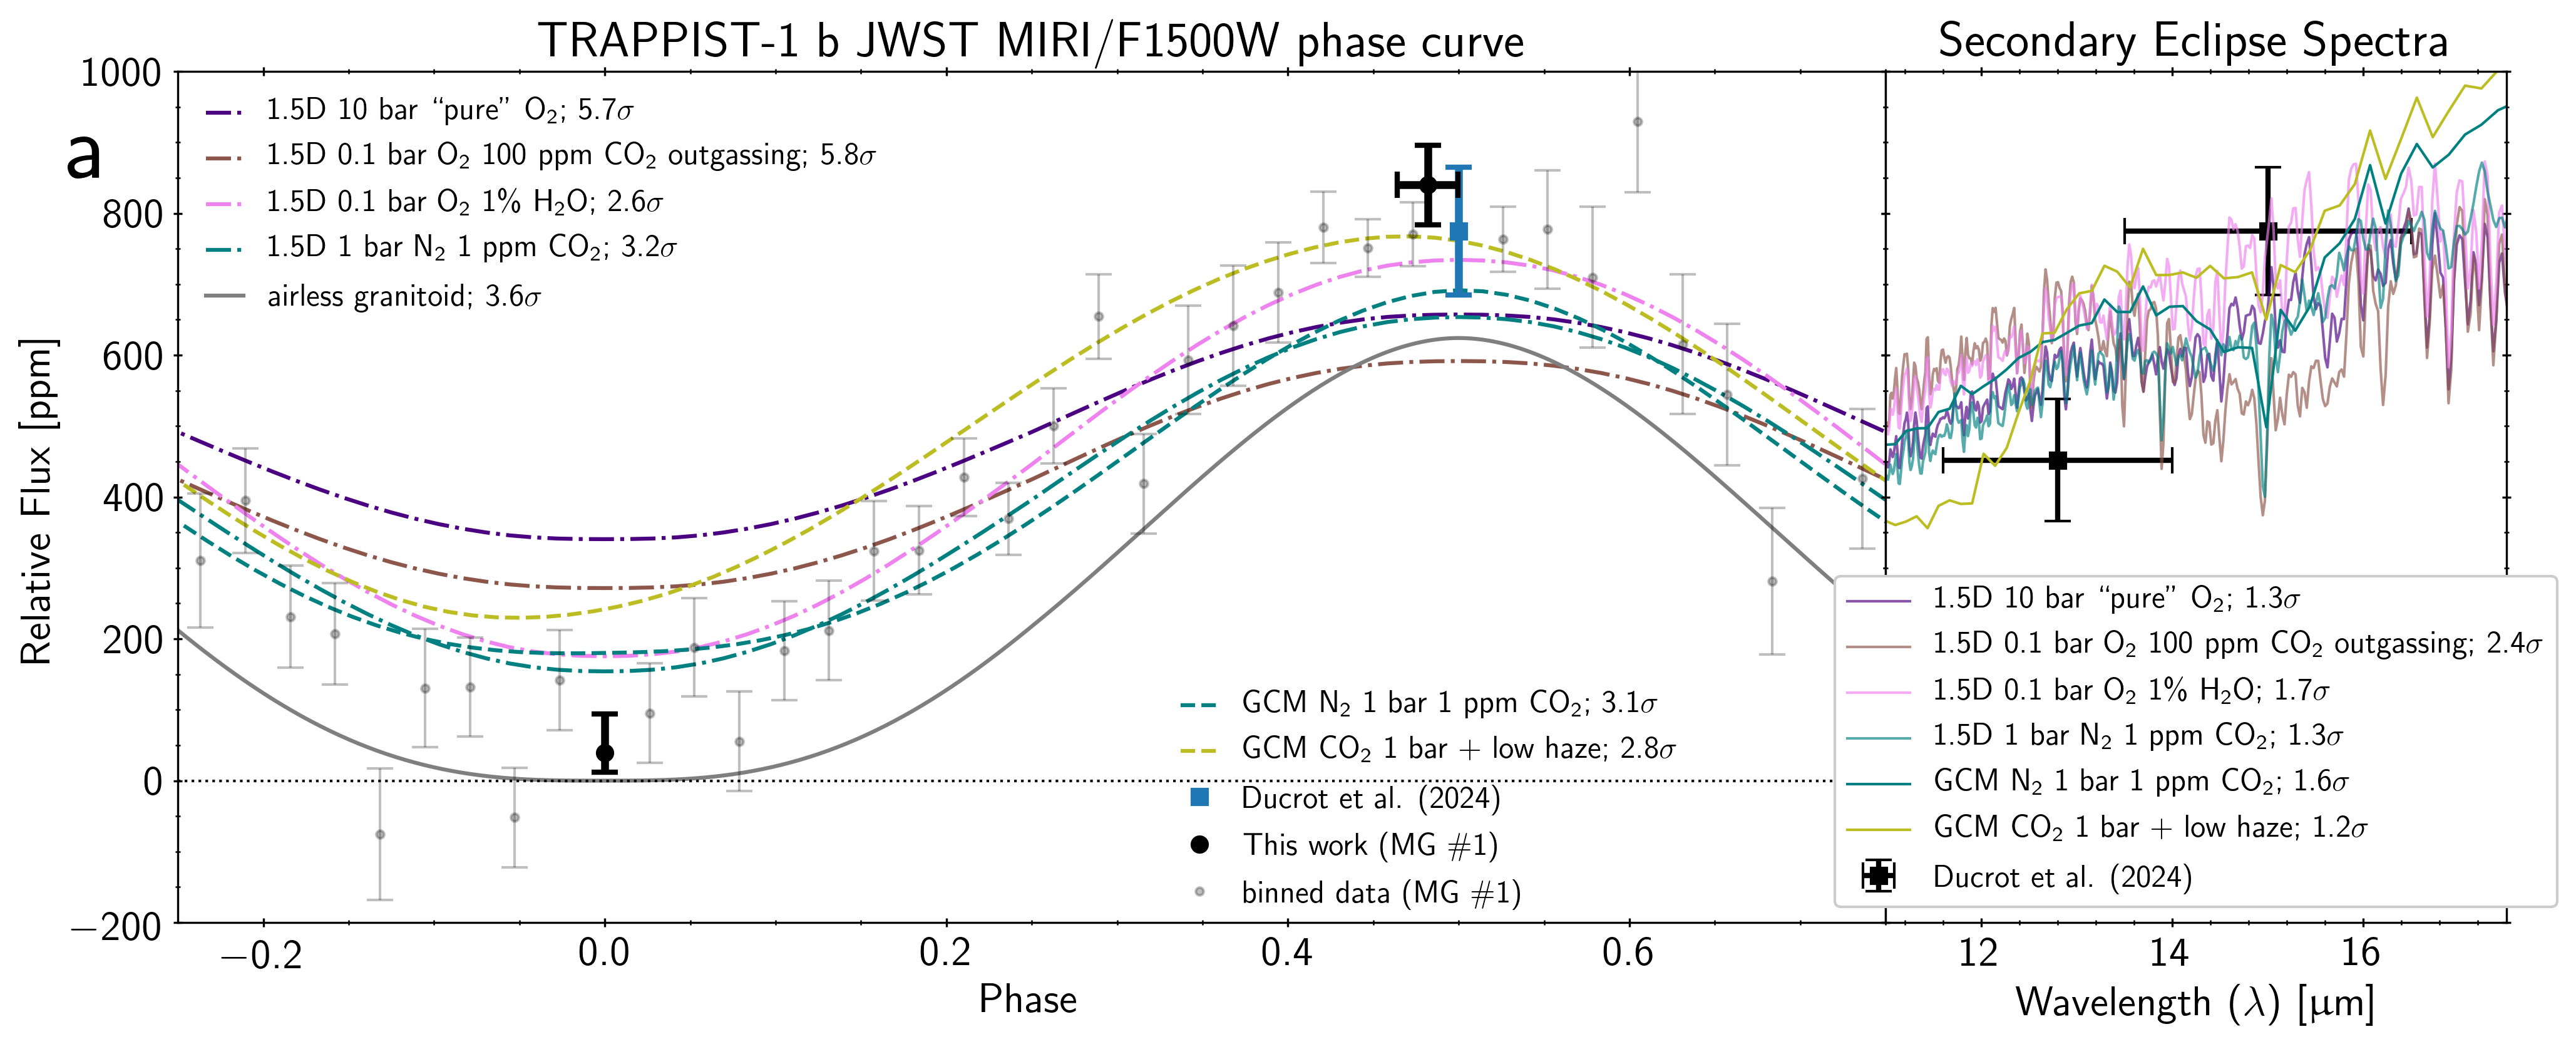
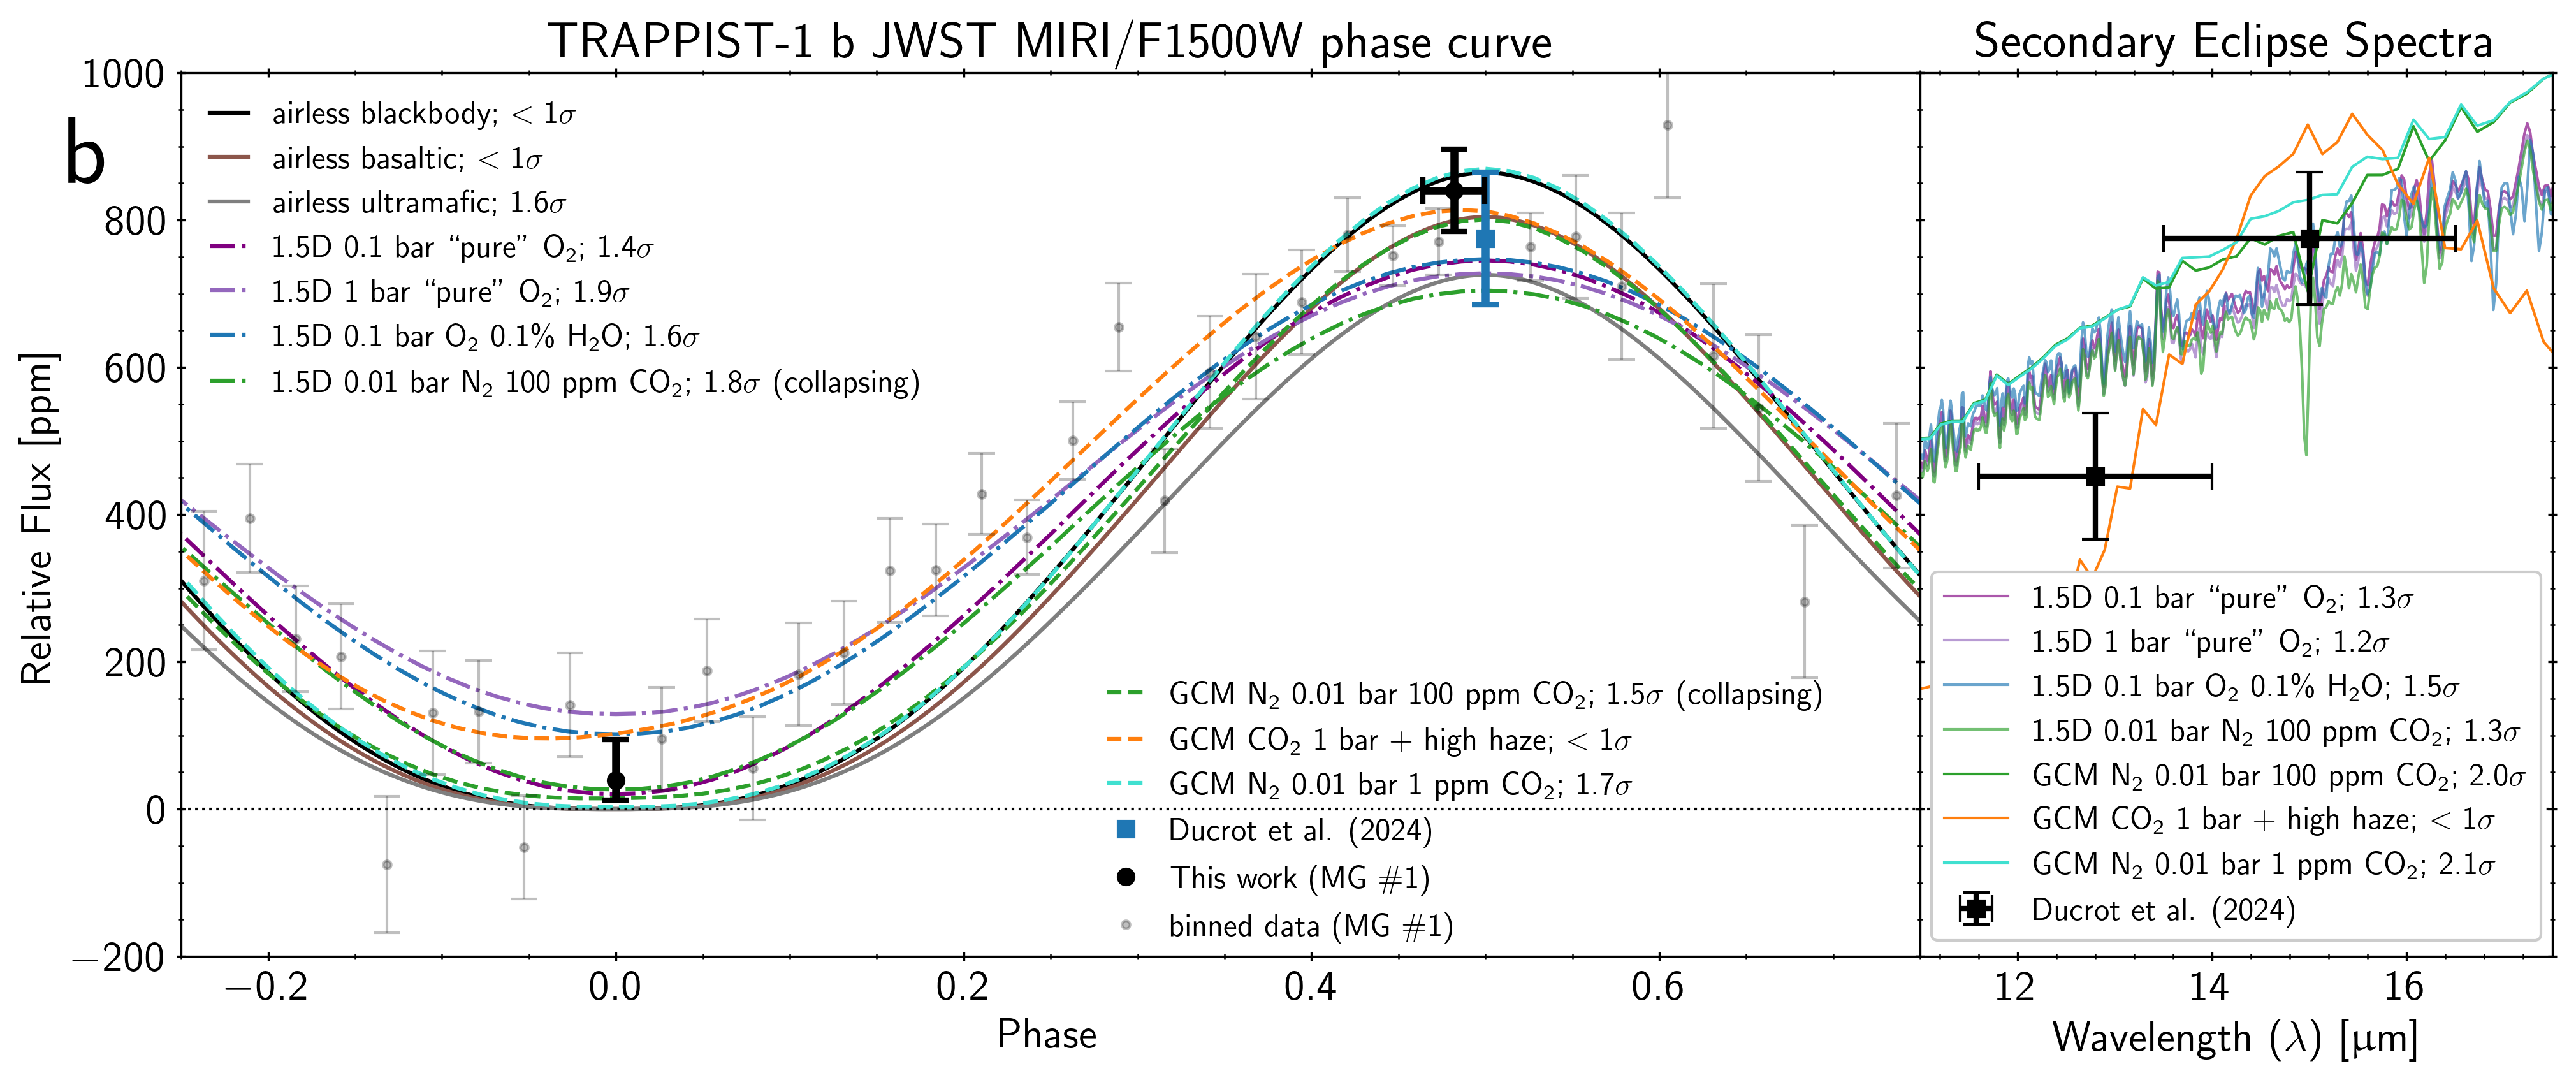
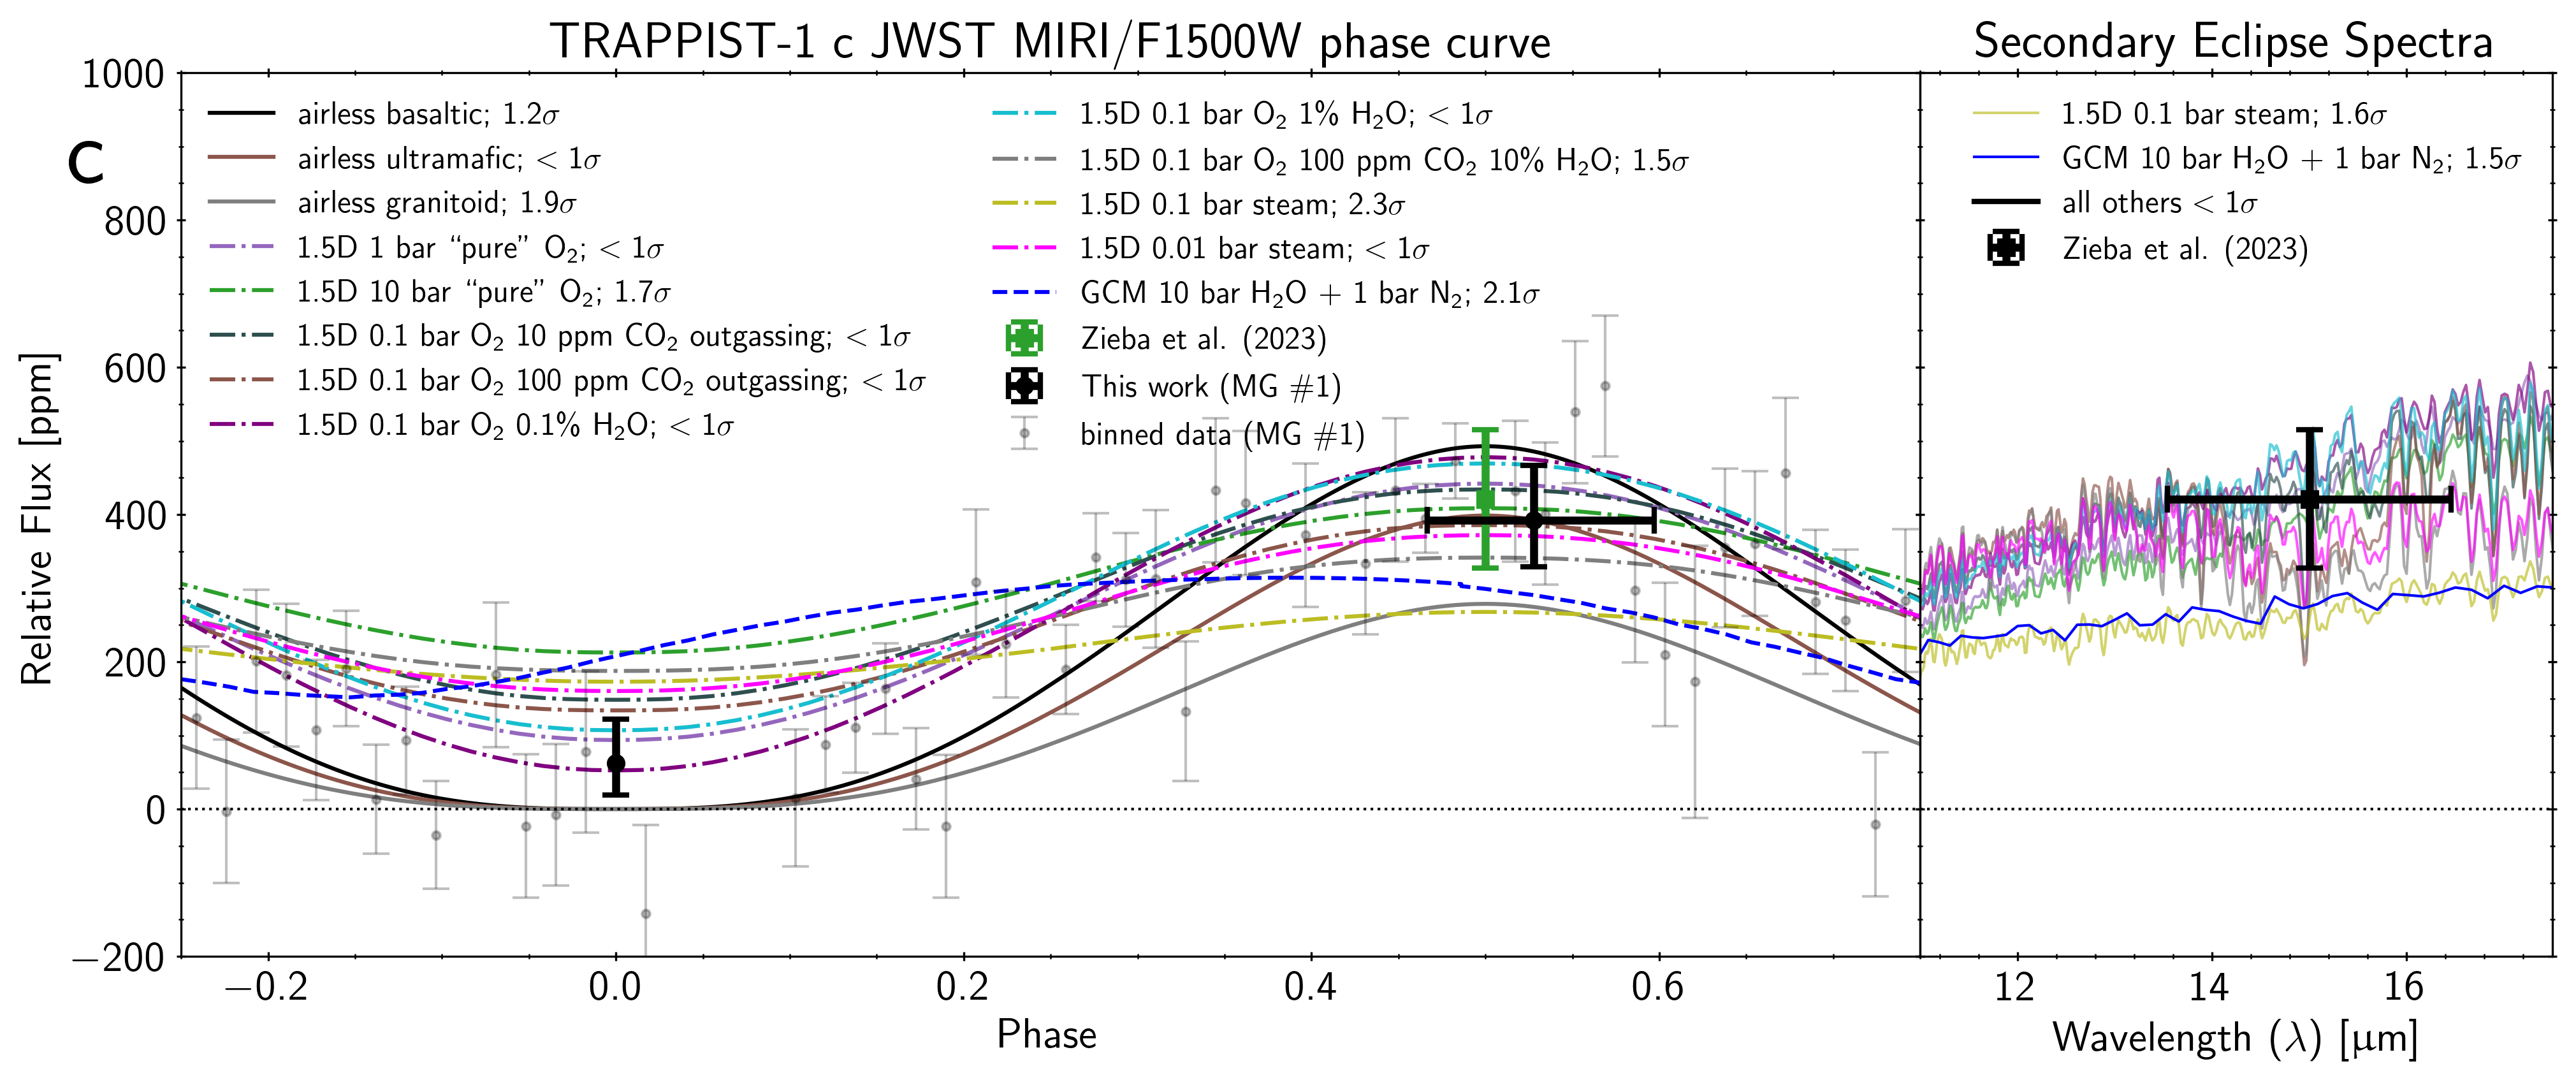
Figure 3: Phase-folded phase curves and emission spectra of TRAPPIST-1 b and c, showing exclusion of high-opacity atmospheres for b and ambiguous results for c.

Figure 4: Best-fit phase curve models for TRAPPIST-1 b and c under different atmospheric assumptions.
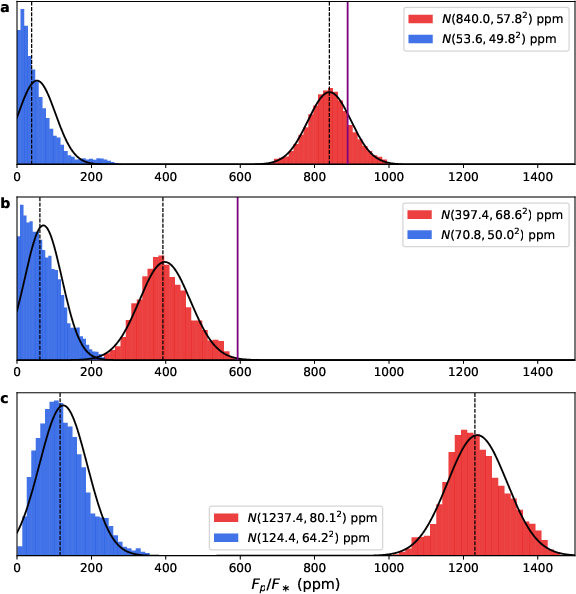
Figure 5: Posterior PDFs for day- and night-side fluxes, demonstrating negligible nightside emission for both planets.
Atmospheric and Surface Modeling
Comprehensive 1.5D climate-photochemical and 3D GCM simulations were performed to interpret the phase curve data. For TRAPPIST-1 b, all models with surface pressures ≥1 bar and efficient greenhouse effects are strongly excluded. Only tenuous O2 atmospheres (≤0.1 bar) with minimal greenhouse gases or airless scenarios remain consistent with the data. For c, thin O2 atmospheres and low-albedo airless surfaces are still allowed.
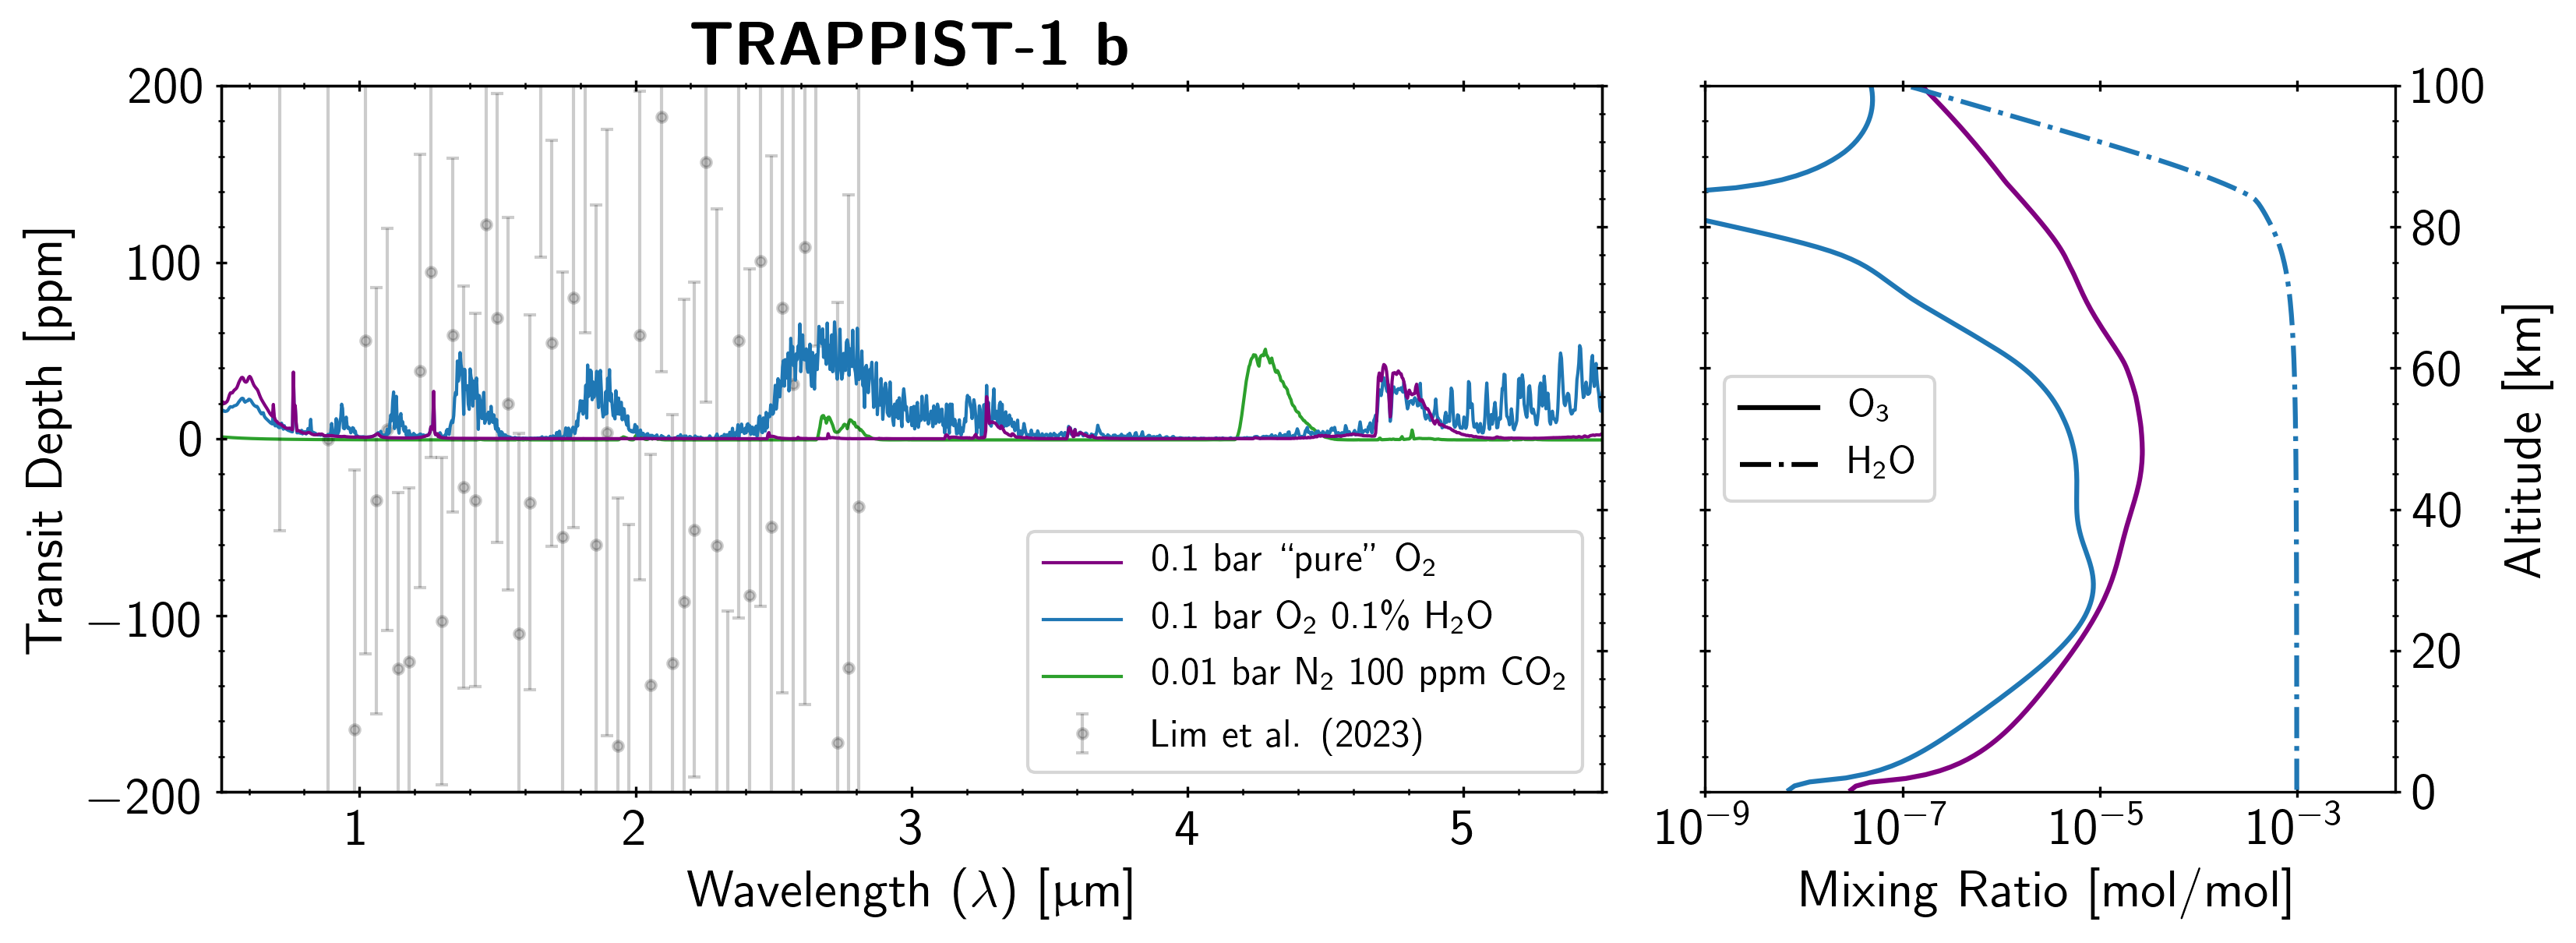
Figure 6: Transit spectra and gas profiles for atmospheric models fitting TRAPPIST-1 b within 3σ; all features are below current detection thresholds.
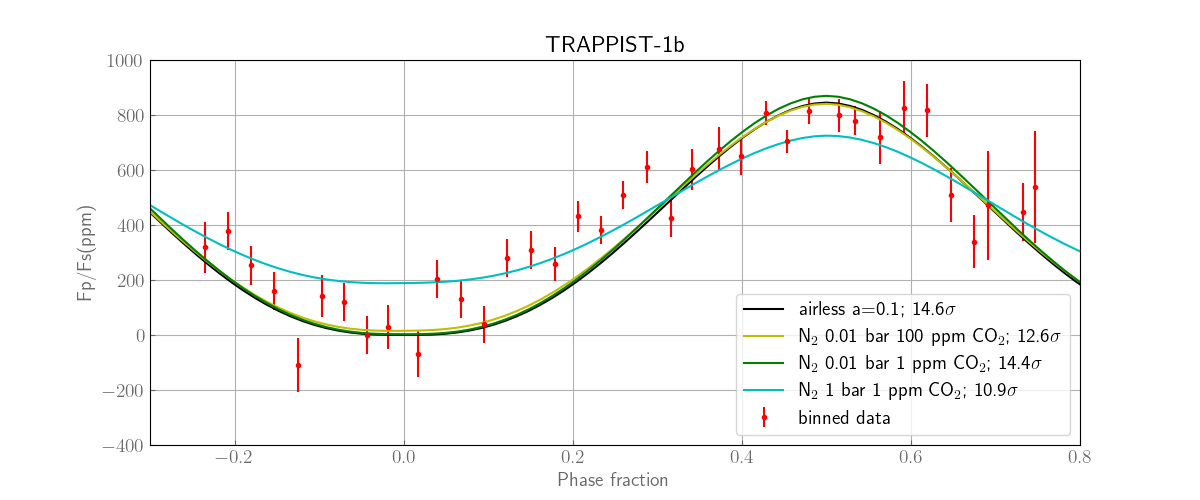
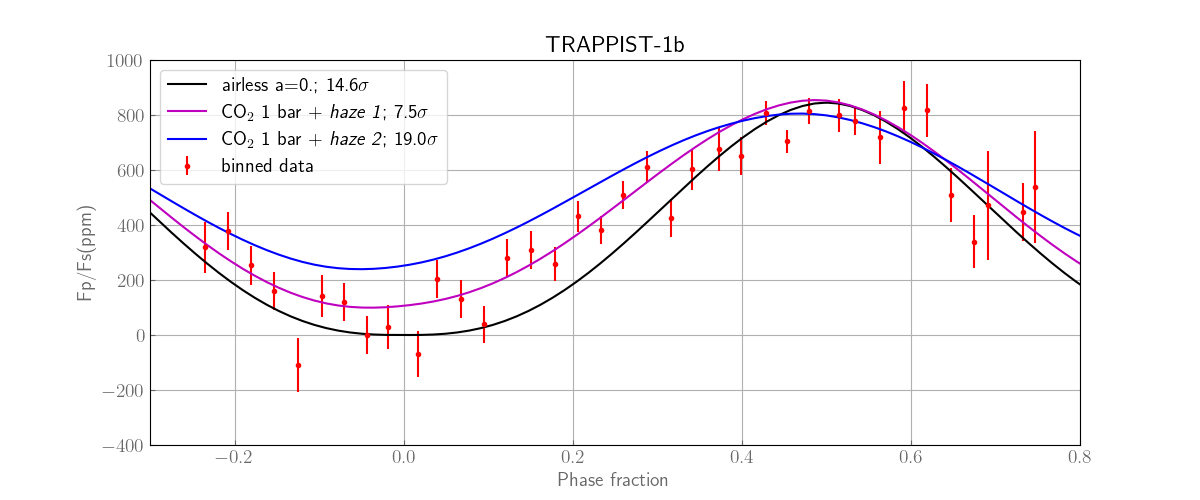
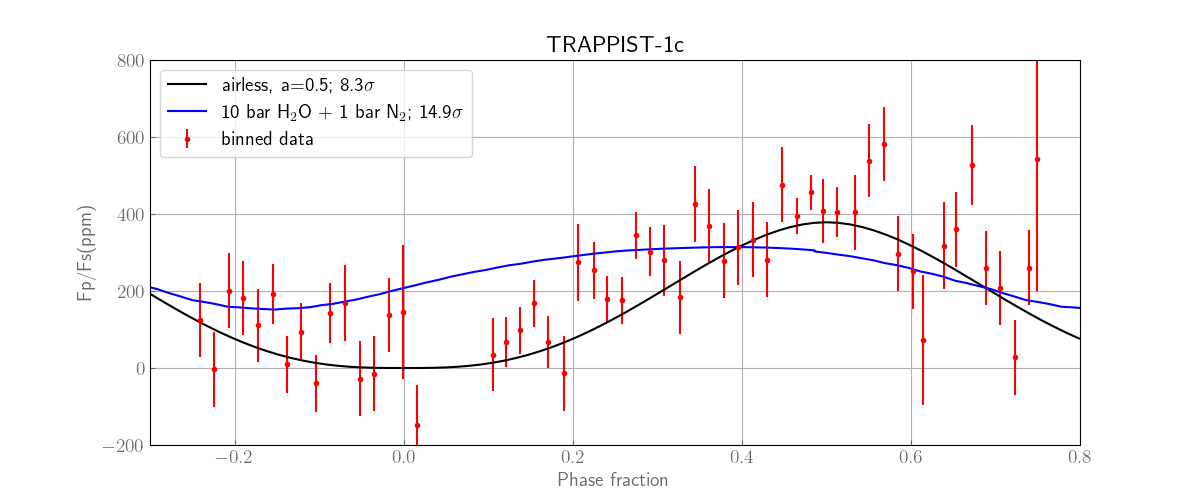
Figure 7: Comparison of observed phase curve data and GCM simulation results for models matching eclipse observations.
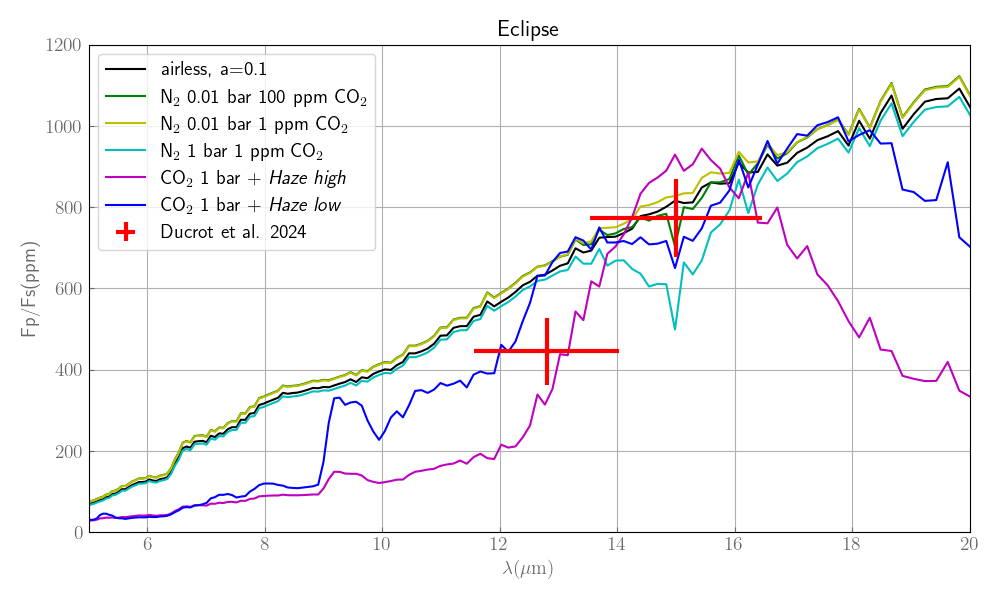
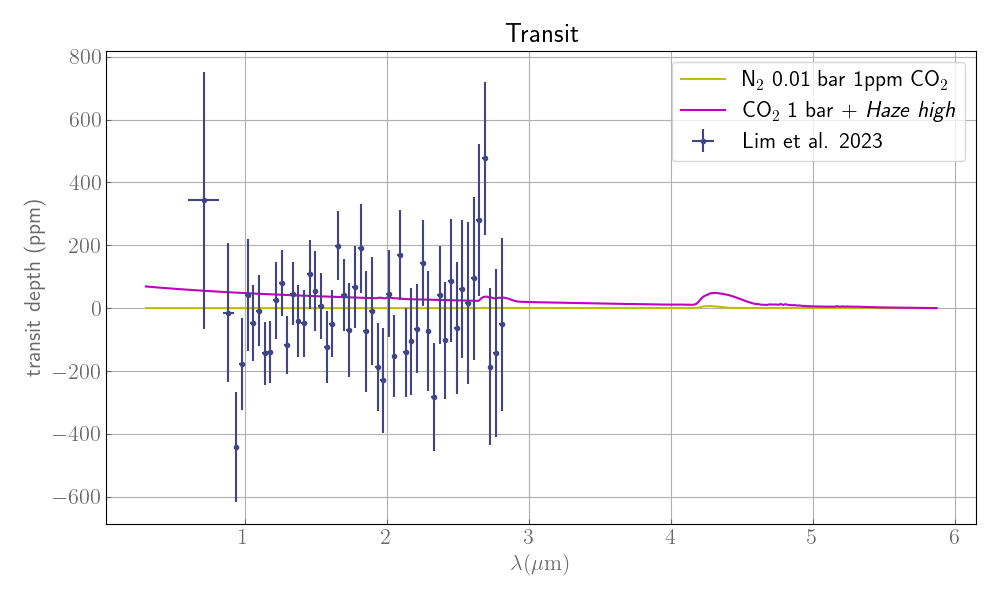
Figure 8: Occultation depth measurements compared to GCM models, showing exclusion of thick atmospheres for b.
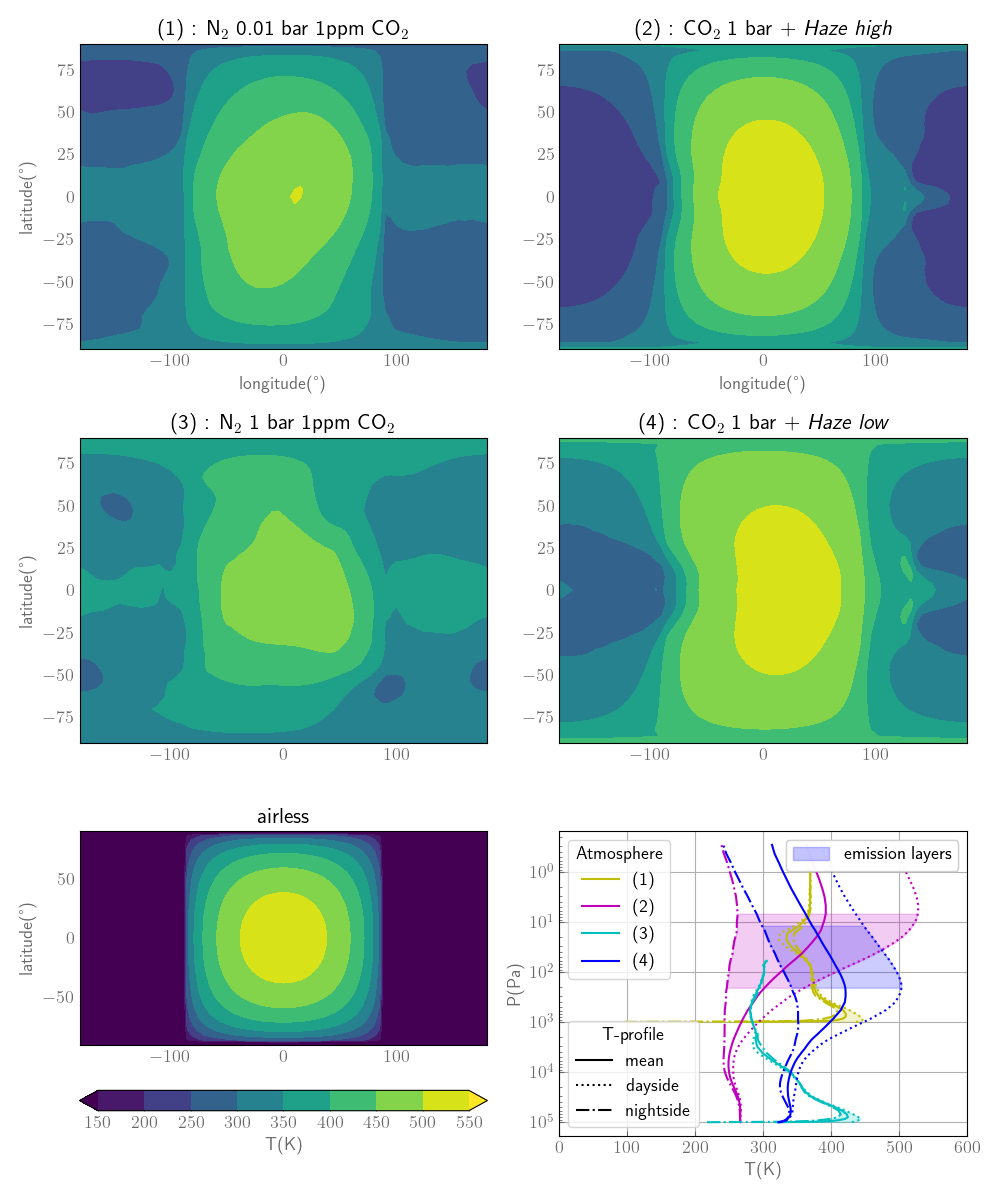
Figure 9: Temperature maps from GCMs, illustrating dayside-nightside contrast and emission regions.
Surface Composition and Space Weathering
Bare rock simulations using laboratory reflectance spectra indicate that TRAPPIST-1 b's phase curve is best fit by a fresh ultramafic surface. Space weathering processes, such as graphite or iron nanoparticle deposition, can further darken the surface and increase phase curve amplitude, but the data favor minimal weathering.
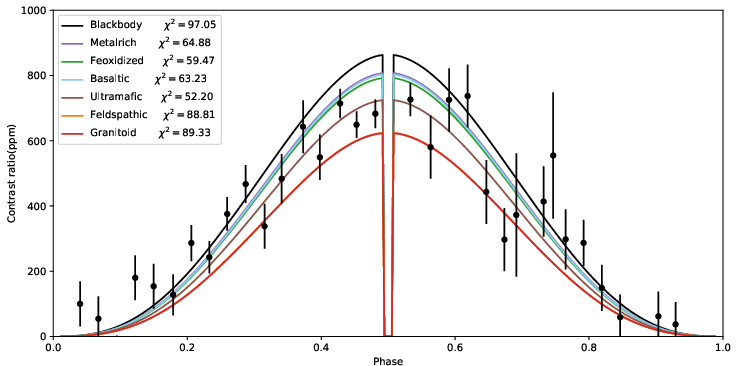
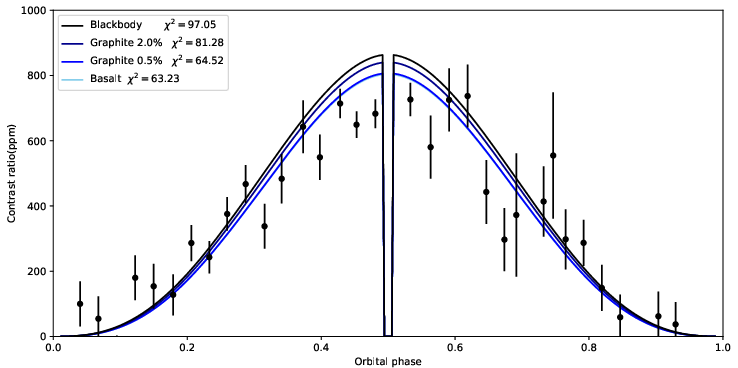
Figure 10: TRAPPIST-1 b's phase curve for different geologically fresh and space-weathered surfaces; ultramafic is preferred.
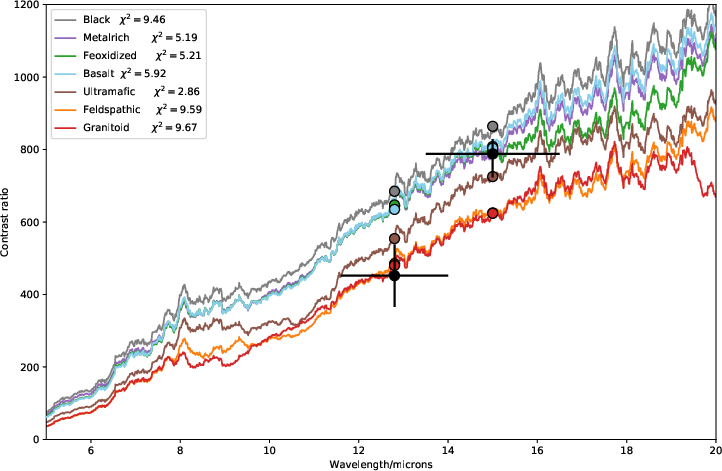
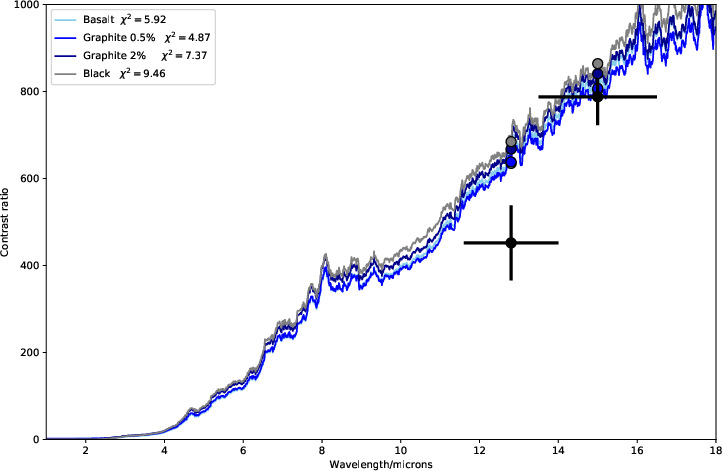
Figure 11: Dayside spectrum for different surface materials, showing consistency with ultramafic and space-weathered basalt.
Tidal Heating and Spin State Constraints
Upper limits on nightside emission for b (<322 K) constrain tidal heating and the planet's spin state. N-body simulations indicate that b's rotation is tightly synchronized, with obliquity <2–3.5∘ depending on core size, and spin rate deviations <0.06% from perfect synchronization.
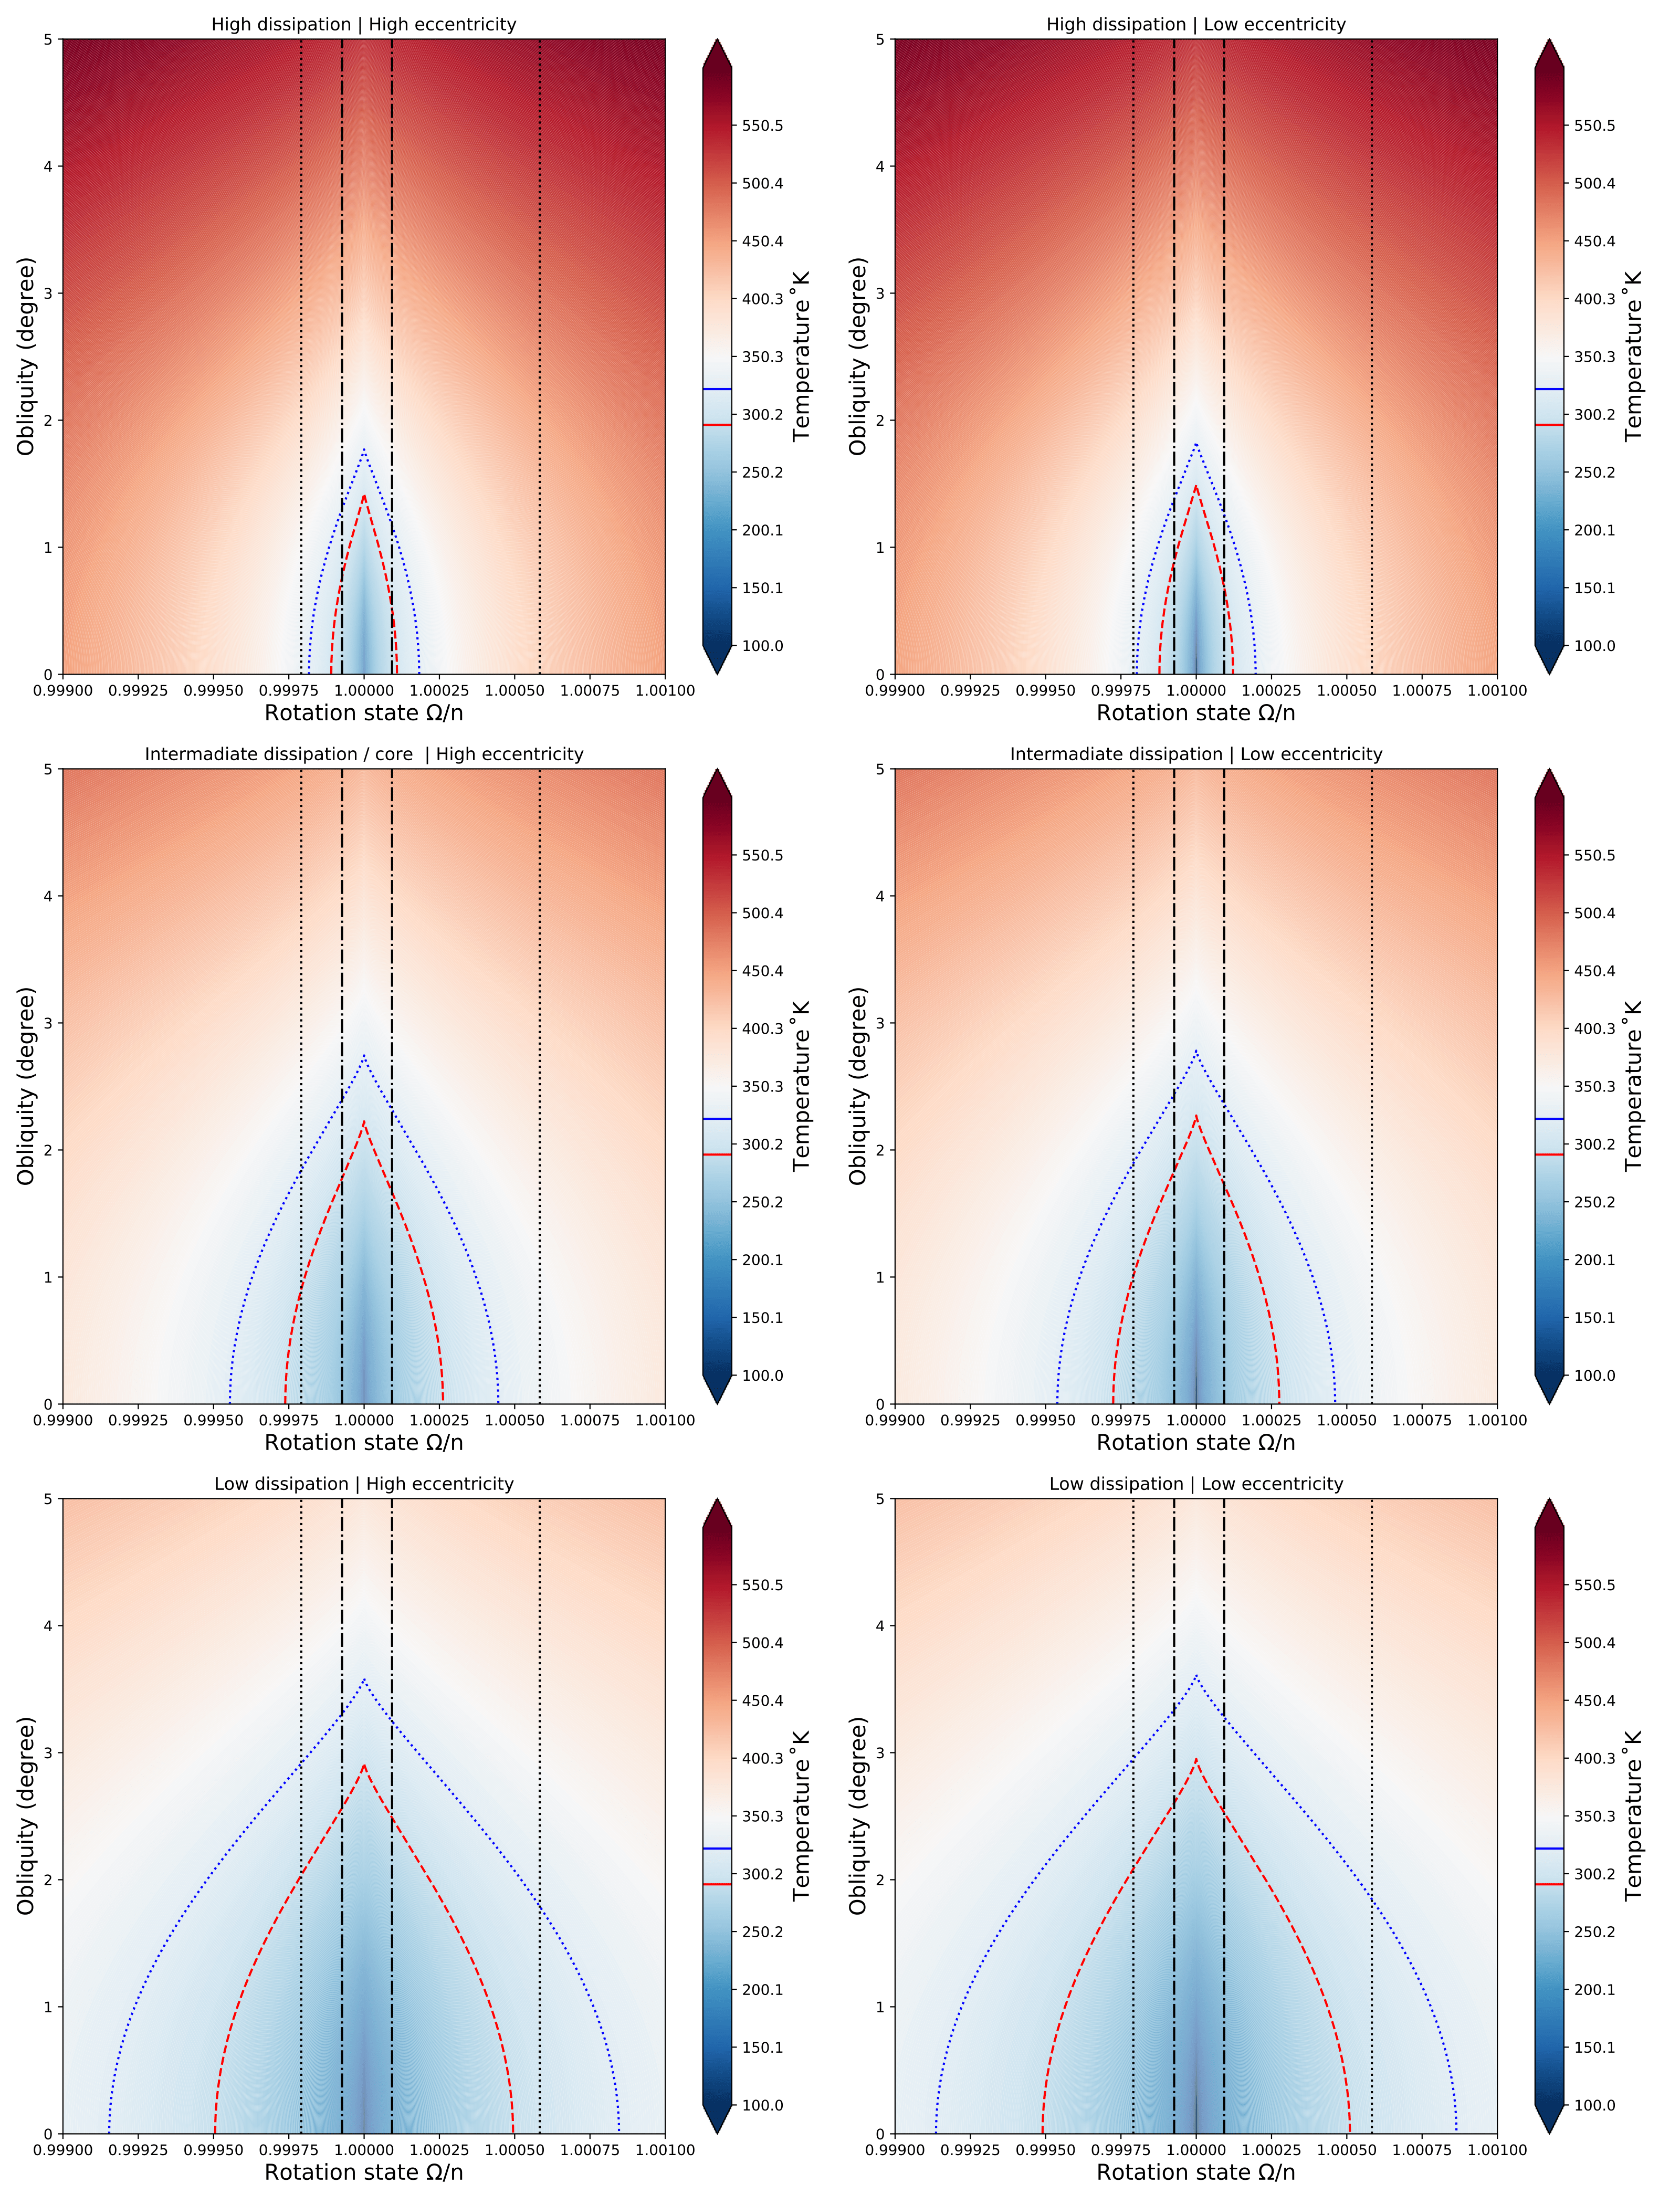
Figure 12: Tidal temperature maps for b, showing constraints from observed nightside flux.
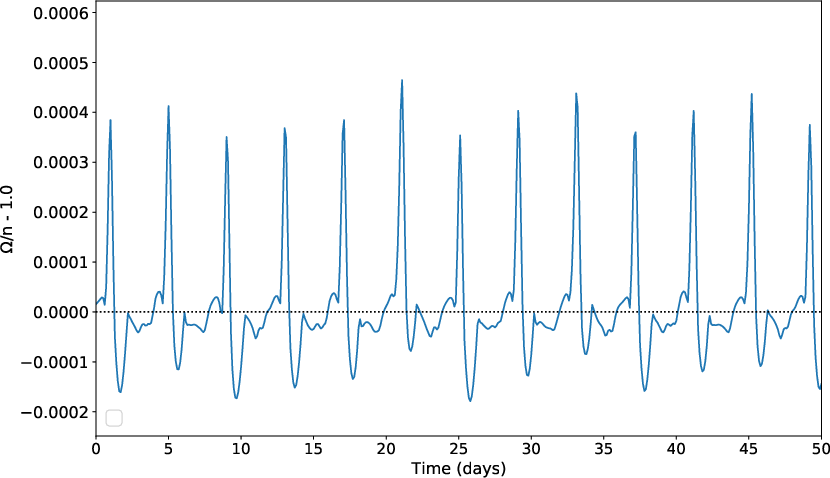
Figure 13: Deviation of b's spin state from synchronization, compatible with observational constraints.
Stellar Flares and Photometric Noise
Multiple flares were detected during the observations, with energies among the highest ever observed for TRAPPIST-1. Flare modeling and frequency analysis indicate a power-law slope β∼−0.85, consistent with previous studies. The presence of mini-flares introduces correlated noise, emphasizing the need for simultaneous multi-wavelength monitoring.
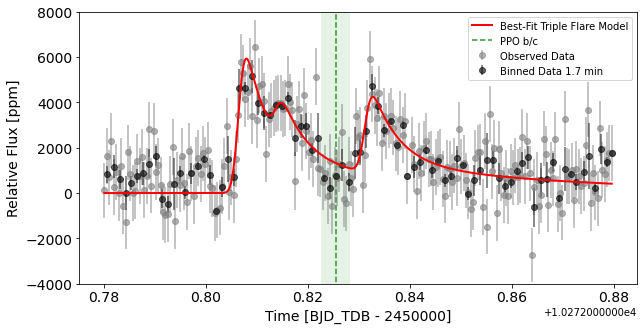
Figure 14: Best-fit triple-flare event during JWST observations.
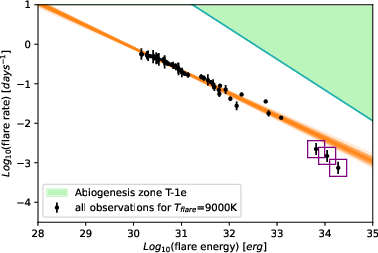
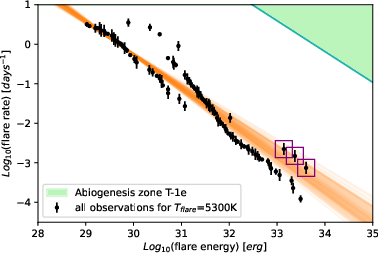
Figure 15: Flare frequency distribution for TRAPPIST-1, comparing different flare temperature assumptions.
Cross-Validation and Robustness
All four independent reductions and analyses yield consistent results within 1σ, confirming the robustness of the conclusions.
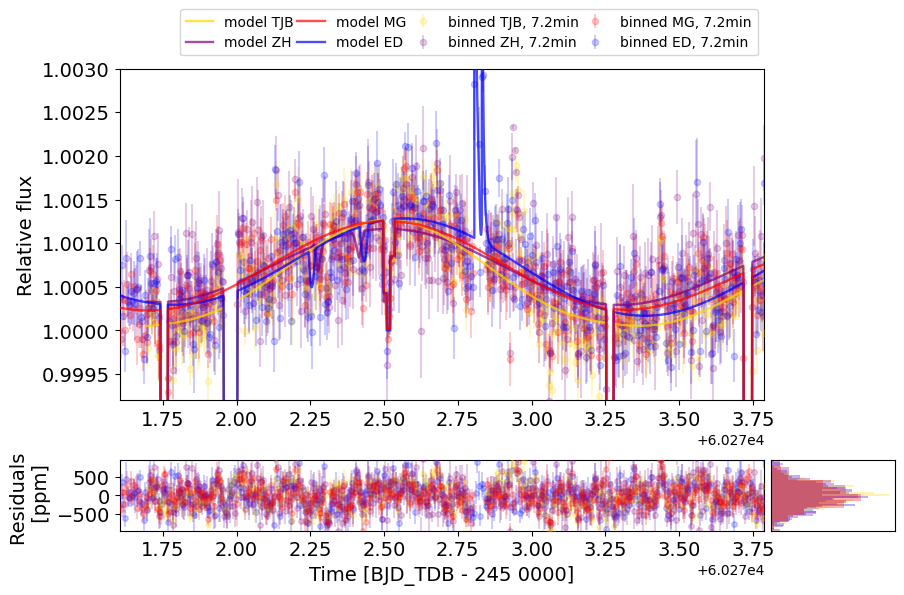
Figure 16: Comparison of light curves and residuals from four different data reductions.
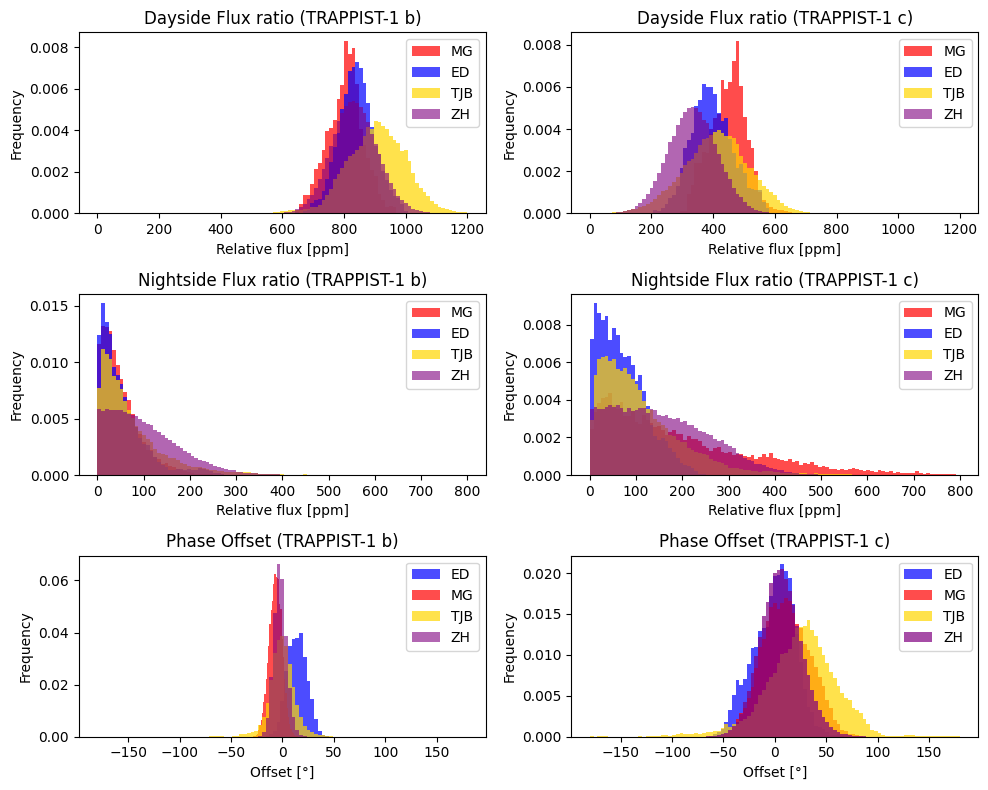
Figure 17: Comparison of posterior PDFs for dayside and nightside flux ratios and phase offsets.
Implications and Future Directions
The absence of thick atmospheres on TRAPPIST-1 b and c, despite their similar compositions and irradiation, suggests divergent evolutionary pathways or atmospheric loss mechanisms. For b, secondary atmospheric escape is likely dominant, while c may retain a tenuous, greenhouse-poor atmosphere or be similarly airless. These results provide stringent empirical constraints on atmosphere retention for temperate terrestrial exoplanets around ultracool dwarfs.
Upcoming JWST observations (GO 5191, GO 2589, GO 2420) will further characterize c's thermal emission and search for molecular signatures (CO2, H2O, O3) via transmission spectroscopy. The methodology demonstrated here establishes thermal phase curves as a critical tool for exoplanet atmosphere characterization, complementing secondary eclipse and transmission spectroscopy.
Conclusion
The JWST/MIRI 15 μm phase curve observations of TRAPPIST-1 b and c decisively exclude the presence of thick, heat-redistributing atmospheres for both planets. TRAPPIST-1 b is best described as an airless, low-albedo ultramafic rocky body, while c may possess a thin, greenhouse-poor atmosphere or a more reflective airless surface. These findings have significant implications for the atmospheric evolution and habitability of terrestrial exoplanets in the habitable zones of ultracool dwarfs. The results highlight the necessity of phase curve measurements for robust atmospheric characterization and motivate further multi-wavelength, time-resolved studies with JWST and future observatories.