- The paper demonstrates that combining sentiment analysis with technical indicators significantly enhances trading performance in the S&P 500.
- It employs domain-specific NLP models (GPT-2, FinBERT) alongside traditional time-series models to capture market nuances.
- Results show hybrid strategies outperform the buy-and-hold benchmark, achieving up to a 5.77% return improvement in volatile markets.
This study investigates the integration of real-time sentiment analysis from financial news, utilizing GPT-2 and FinBERT, with technical indicators and time-series models to optimize S{content}P 500 trading strategies. The paper evaluates the performance of combining sentiment-driven insights with traditional models through assets values and returns, demonstrating that this approach enhances trading performance and adapts to market changes in volatile environments.
Data and Methodology
The study uses financial news articles from sources like the Wall Street Journal, Barron, Benzinga, MarketWatch, and Dow Jones, alongside daily stock prices for the S{content}P 500 index, from August 2019 to August 2024. The adjusted closing prices are used to calculate daily returns, which are categorized into positive, neutral, and negative sentiment labels. These labels are then compared with sentiment derived from the news articles. The lag structure is carefully considered, with articles time-stamped between 16:00 and 23:59 ET linked to the next trading day and weekend stories aggregated to Monday's return, with a lag of k=1 (news today -> return tomorrow) delivering the best out-of-sample accuracy.
To analyze financial text, domain-specific models like FinBERT are employed to capture nuances in language inherent in finance. The study merges news sentiment data, processed using GPT-2 and FinBERT, with traditional financial data from the S{content}P 500. These sentiment analysis outputs are integrated with technical indicators like MACD, SAR, Volume Weighted MACD, and DUAL MACD, as well as time-series models like ARIMA, Prophet, and ETS.
Technical Indicators and Time-Series Models
The study incorporates several technical indicators to capture market trends and turning points. MACD, a momentum indicator, tracks the difference between the 12-day and 26-day exponential moving averages of a stock's price. SAR, a trend-following indicator, plots dots above or below the price to signal potential reversals. VW MACD accounts for volume, giving more importance to high activity peaks in momentum calculation. Dual MACD uses two different MACD signals to confirm trends and filter out false signals.
Time-series forecasting models, including ARIMA, Prophet, and ETS, are used to analyze and predict stock price movements. ARIMA models non-stationary series and adapts to trends and randomness in the data. Prophet models seasonal trends and has non-regular collection rates, estimating trends and seasonal components separately. ETS captures the structural behavior of changes in stock prices, separating trend, seasonality, and randomness.
Trading Simulation and Results
A trading simulation is conducted to evaluate the effectiveness of integrating sentiment analysis and technical indicators. The simulation creates trading signals from market sentiment and daily stock returns, using these signals to simulate trades and gauge profitability. The strategy dynamically adjusts assets based on predicted sentiment signals, starting with \$10,000 and updating capital and share holdings daily based on a combined indicator signalIt.
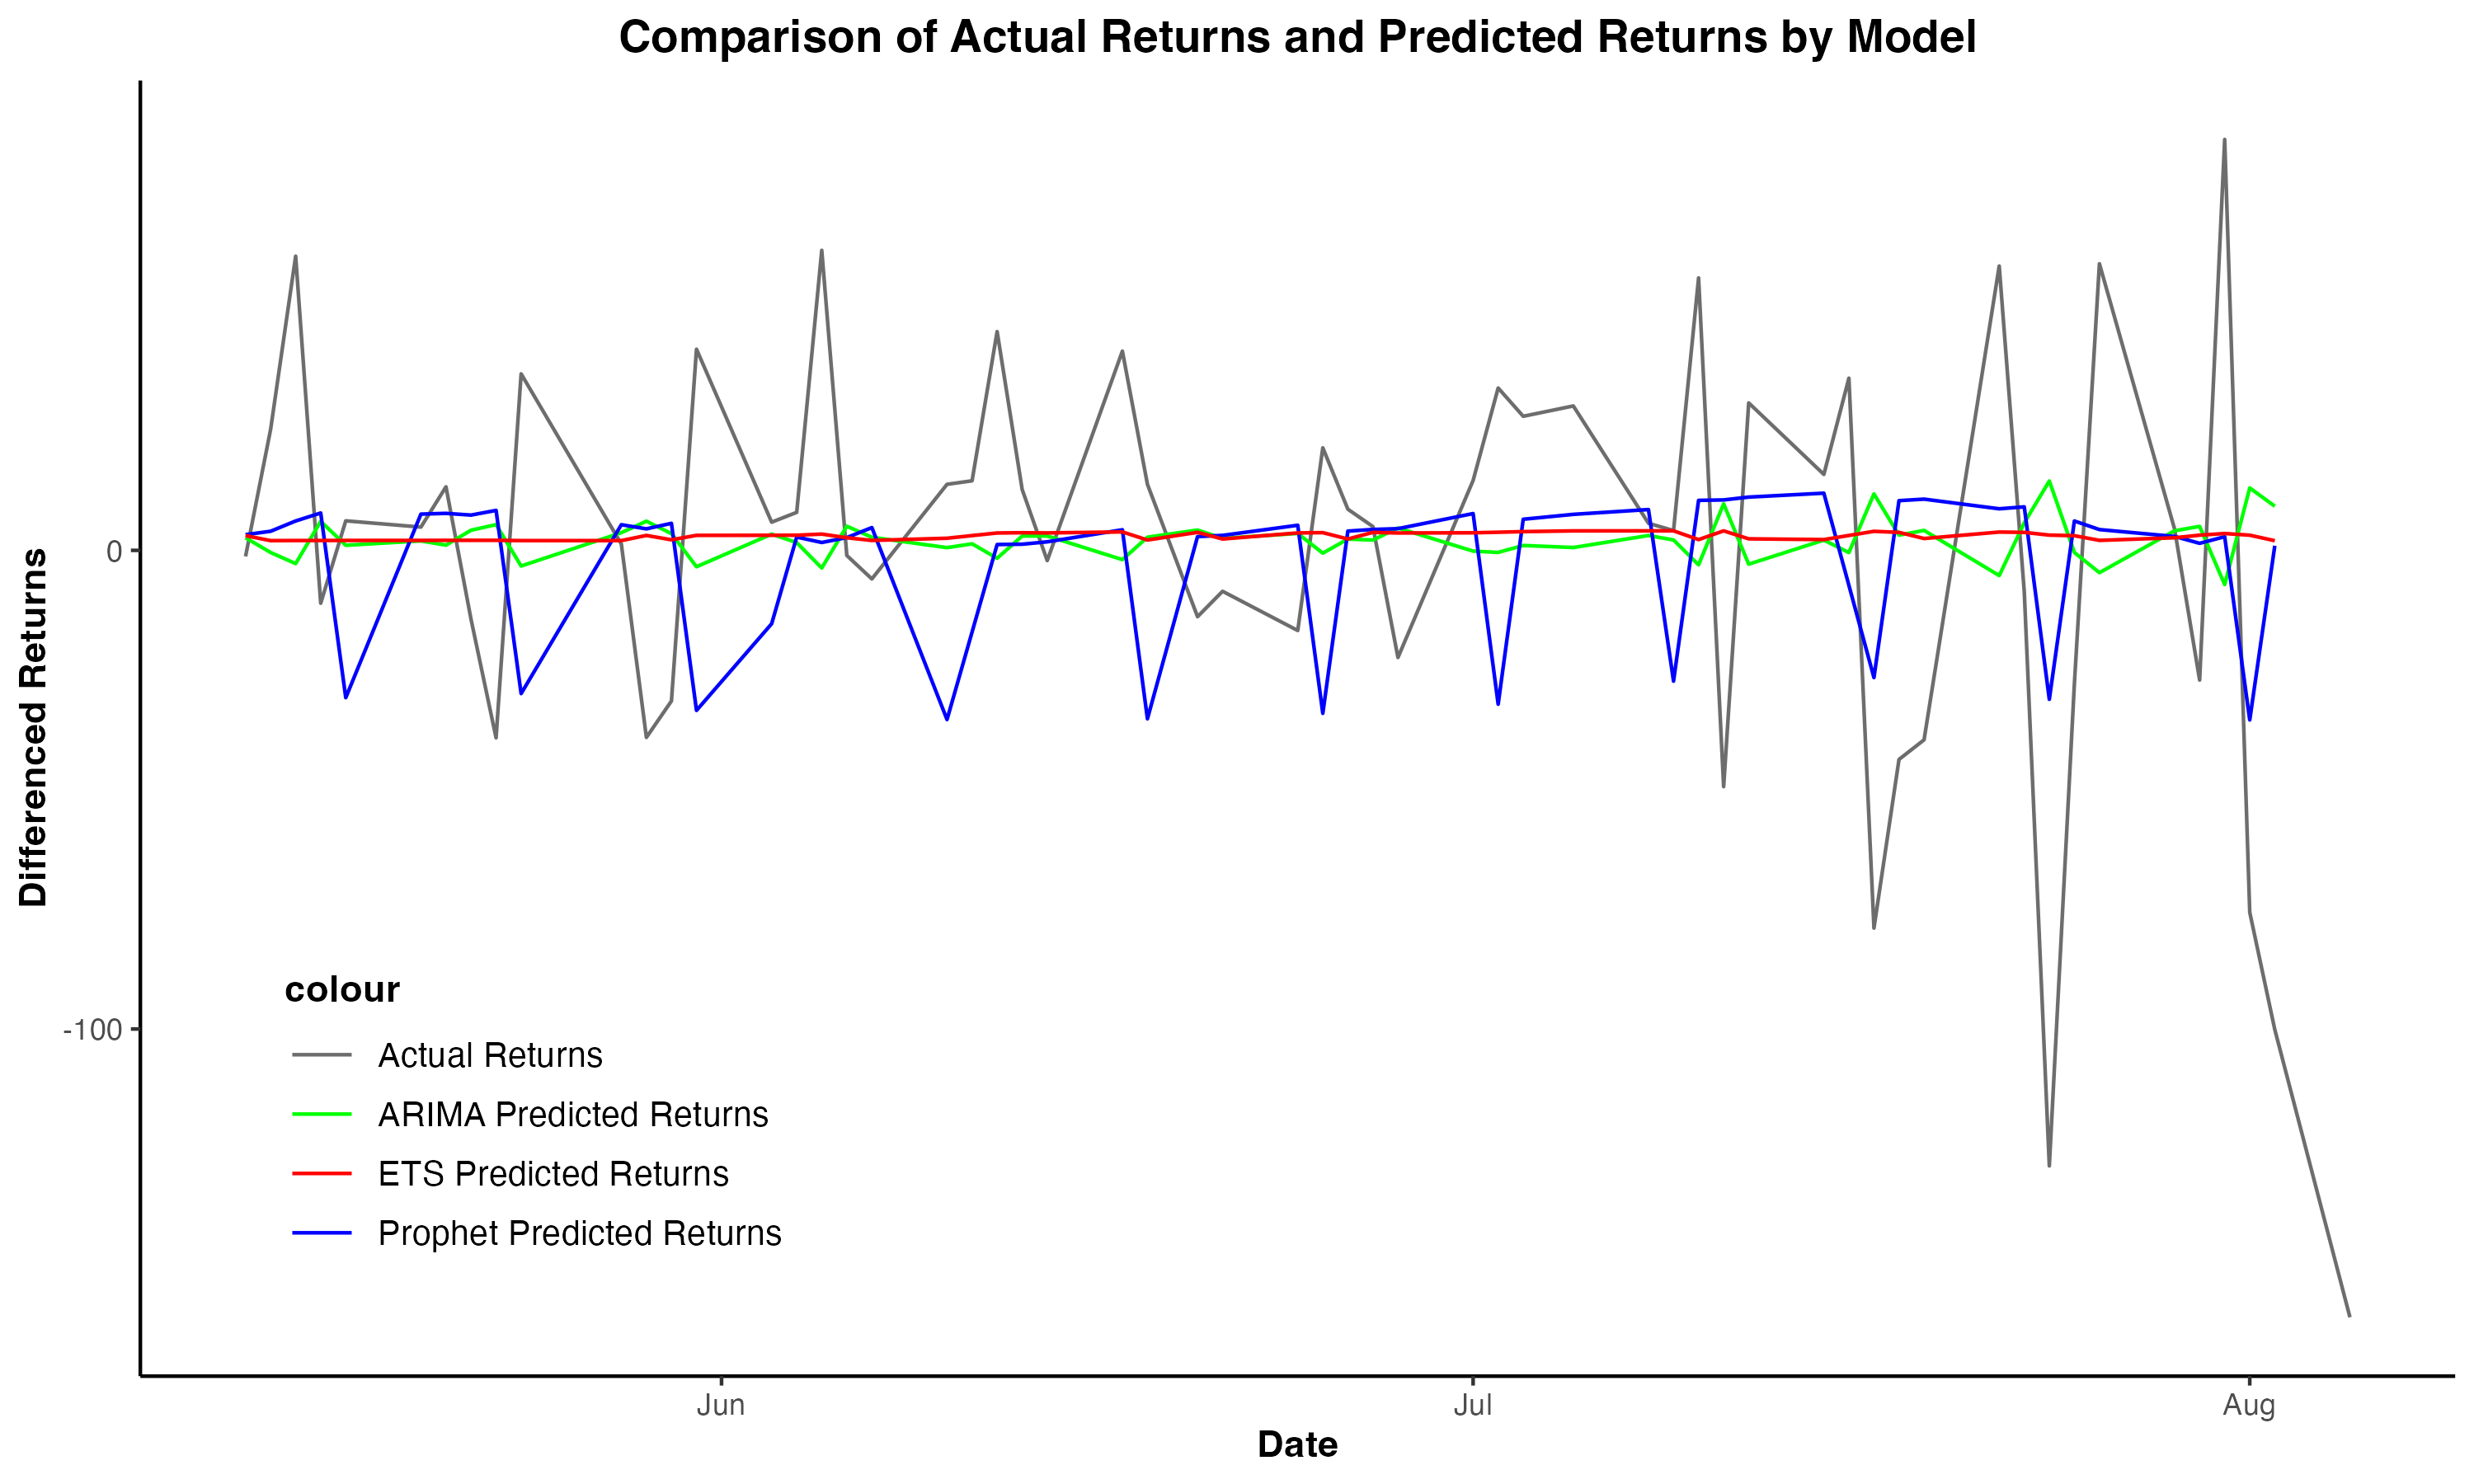
Figure 1: A comparison of the actual returns with predicted returns from ARIMA, ETS, and Prophet models over a period from June to August.
A buy-and-hold strategy is used as a benchmark to compare against the sentiment-based strategies. The highest return observed is achieved by a hybrid strategy combining sentiment analysis with the VW MACD indicator and time-series forecasts, reaching 5.77%, significantly outperforming the benchmark buy-and-hold strategy, which returned -0.696%. This result highlights the potential of sentiment analysis, combined with robust technical indicators and forecasting models, to enhance assets returns.
The accuracy comparison for sentiment classification across different news sources shows that FinBERT achieved its highest accuracy of 75.56% on Benzinga, while GPT-2 performed best on WSJ with an accuracy of 65.48%. The Prophet and ETS models achieved the highest accuracy in time series classification, both at 59.65%, significantly outperforming ARIMA, which achieved an accuracy of 29.82%. The negative return relative to the baseline buy-and-hold highlights the need for adaptive models capturing both sentiment and market momentum. Based on testing, sentiment-based models in isolation do not consistently outperform traditional methods; however, combined with technical indicators, performance is significantly enhanced.
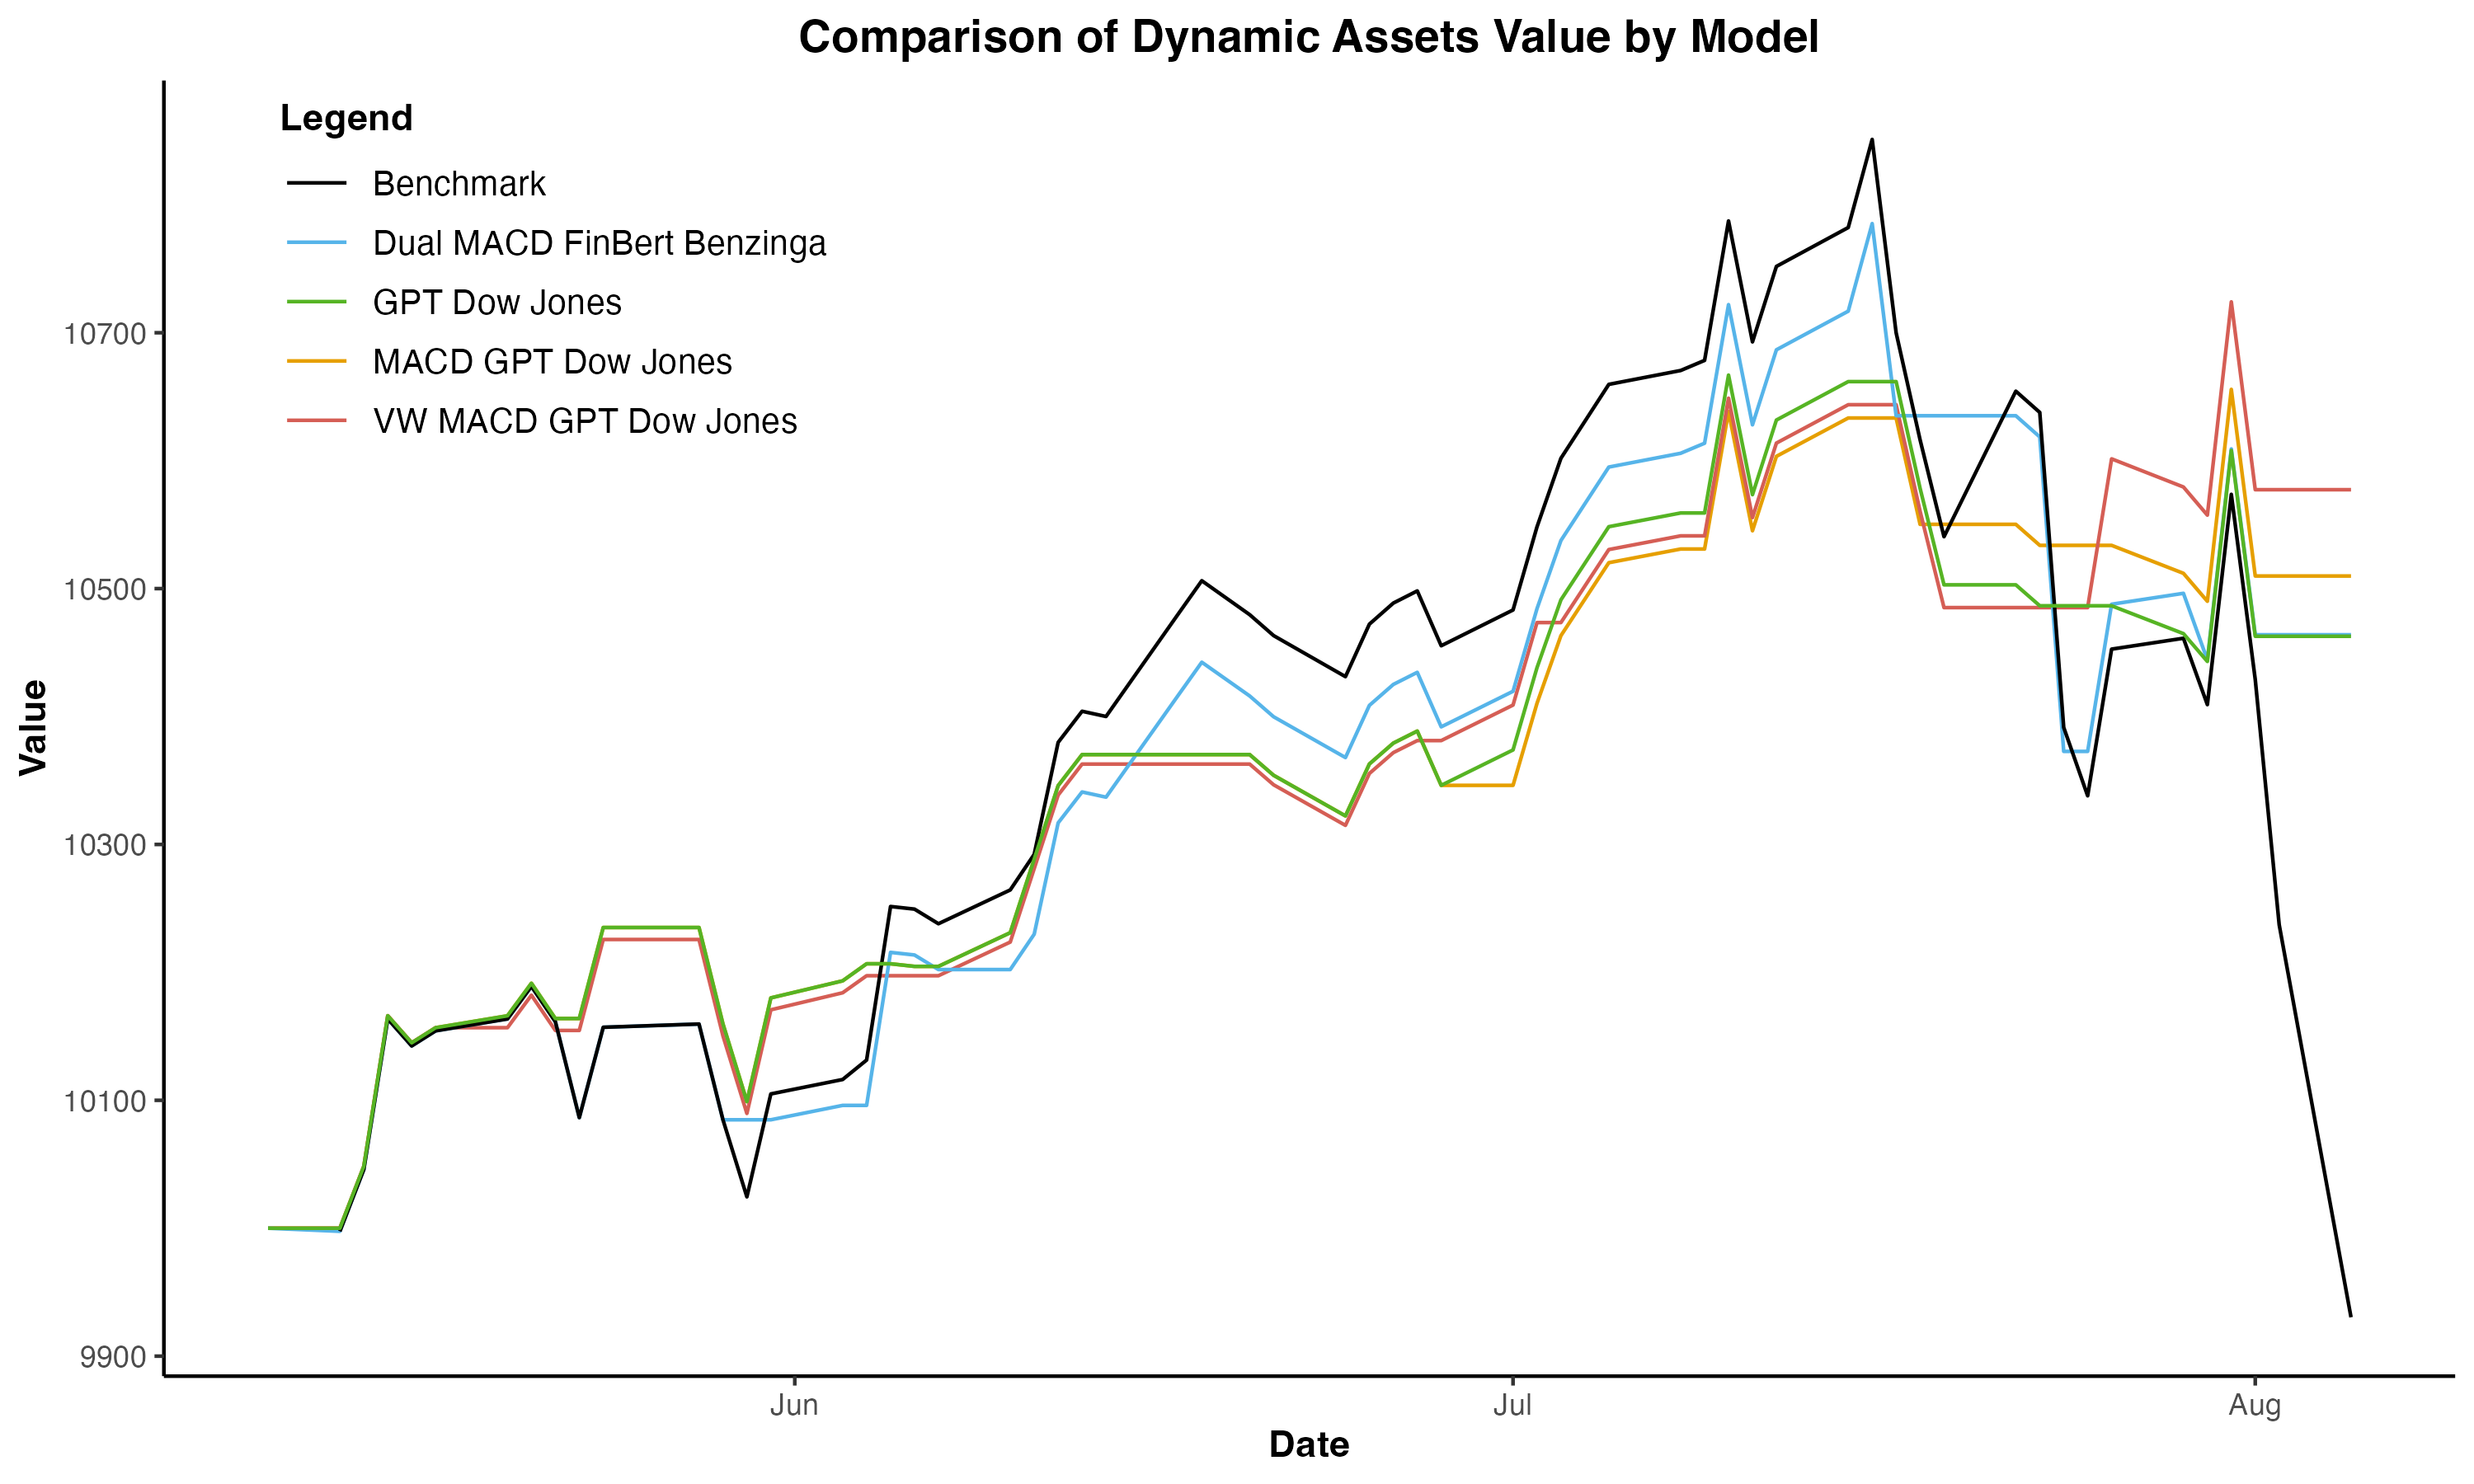
Figure 2: This plot compares the assets values of various trading models from May to early August, showing how each model's value changes over time.
Conclusion and Future Directions
The study concludes that incorporating sentiment analysis from financial news, combined with traditional technical indicators and time-series forecasting models, improves trading strategies in the S{content}P 500 market. A hybrid strategy implementing sentiment analysis from GPT-2 and FinBERT, combined with technical indicators like MACD and SAR and time-series models like ARIMA and ETS, triumphed over the baseline buy-and-hold.
Future work could explore using reinforcement learning for trading strategies that adjust on the fly, broadening sentiment sources to include real-time data from social media, and applying state-of-the-art deep learning models like LSTMs and Transformers to sentiment analysis and time-series forecasting.