2,000 glyph images in 196 dimensions flow into constellations under live t-SNE.
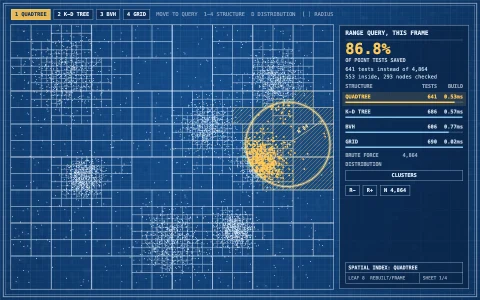
Every star is a tiny 14x14 glyph image drawn in code, so each point lives in 196 dimensions: eight glyph families (ring, cross, wave, spiral and so on), each with two variants that form nested sub-clusters. The page measures exact nearest neighbors in 196-D, binary-searches each point's Gaussian bandwidth to match the perplexity, and symmetrizes the result into a sparse P matrix, all spread over frames. Then real t-SNE runs: attraction over the sparse neighbors, repulsion over all pairs approximated by a Barnes-Hut quadtree, early exaggeration, momentum and adaptive gains. The labels are never shown to the algorithm; they only name the constellations and draw their stick figures once each family has gathered.
Try it. Drag the sliders to change perplexity, early exaggeration and learning rate (perplexity recalibrates P and restarts from a random cloud). Exaggerate again re-applies early exaggeration, and New random start reshuffles. Hover a star to see its glyph and lines to its ten nearest neighbors in the original 196-D space. Keys: arrows for perplexity and learning rate, E and R. Left alone, it tours instructive settings.
Paste this into Claude Code, Codex or any coding agent to get a simple version running, then take it wherever you like.
Build a live t-SNE visualization with JavaScript and the HTML canvas element. Put everything in a single index.html file with no libraries or build step, so I can open it directly in a browser.

Start simple:
- Make a canvas that fills the window, stays sharp on high-DPI screens (scale by devicePixelRatio), and has a deep navy background.
- Generate about 600 points in 20 dimensions: 6 Gaussian clusters with random centers, so the structure is known but invisible in any two raw coordinates. Keep each point's cluster label for coloring only.
- Compute the full pairwise squared distance matrix once. For each point, binary-search a Gaussian bandwidth so the entropy of its neighbor distribution equals log(perplexity), with perplexity 30. Symmetrize: P_ij = (p_j|i + p_i|j) / 2N.
- Start the 2D embedding as tiny random values (standard deviation 0.0001). Each frame, run a few gradient steps of exact t-SNE: Student-t similarities q_ij proportional to 1 / (1 + |y_i - y_j|^2), gradient 4 * sum((p_ij - q_ij) * (y_i - y_j) / (1 + |y_i - y_j|^2)). Multiply P by 12 for the first 100 iterations (early exaggeration) and use momentum.
- Scale the embedding to fit the screen every frame and draw each point as a small glowing dot colored by its label.

Once that works, make it beautiful:
- Draw the points as soft star sprites with "lighter" blending and a gentle twinkle, on a star-chart background with a faint circular graticule.
- Add sliders for perplexity, exaggeration and learning rate, and restart from a random cloud when perplexity changes, so you can see how the settings make or break the clusters.
- Show the KL divergence as a small sparkline while it optimizes.

Explain the key ideas in short code comments. When you're done, tell me how to open it and suggest three directions I could take it next, such as a Barnes-Hut quadtree to scale to thousands of points, embedding real images like handwritten digits, or drawing constellation lines between bright stars of each cluster.