Why Mars backs up against the stars, drawn by Copernicus and Ptolemy side by side.
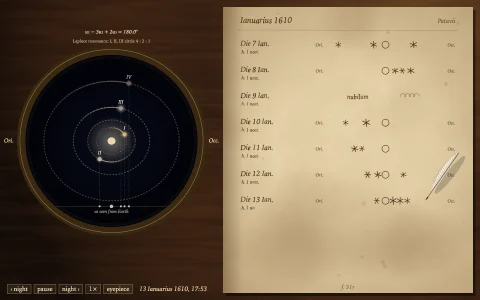
Every planet's position comes from its real J2000 Keplerian elements and their secular rates: the mean anomaly is advanced to the date, Kepler's equation is solved by Newton's method, and the ellipse is turned into the ecliptic by its node, inclination and perihelion. On the left Earth overtakes Mars on the inside track, and a fan of sight lines every two weeks crosses over itself, inked red while the motion is retrograde. On the right the same vectors are seen from a fixed Earth: planet minus Earth is (planet minus Sun) plus (Sun minus Earth), so it is exactly a deferent carrying an epicycle whose arm stays parallel to the Earth to Sun line, and Ptolemy's measured ratios (39;30 to 60 for Mars) match the inverse of the planets' distances in AU. Below, the geocentric longitude and latitude are plotted against real zodiac stars, so the orbit's tilt opens the backtrack into a loop, with dated ticks and the two stations marked.
Try it. Pick Mars, Jupiter, Venus or Saturn at the top (or keys 1 to 4), or click a planet in the orrery. Click the Ptolemaic panel (or press E) to show or hide the epicycles. Drag sideways anywhere to scrub through time, arrows step 10 days (100 with Shift), up and down change speed, space pauses. Left alone it follows each planet through a loop and moves on to the next.
Paste this into Claude Code, Codex or any coding agent to get a simple version running, then take it wherever you like.
Build an interactive explanation of planetary retrograde motion with JavaScript and the HTML canvas element. Put everything in a single index.html file with no libraries or build step, so I can open it directly in a browser.

Start simple:
- Make a canvas that fills the window, stays sharp on high-DPI screens (scale by devicePixelRatio), and resizes with the window.
- Split it into two square panels. On the left, draw the Sun at the centre and Earth and Mars on circular orbits of 1 and 1.52 AU, moving with periods of 365.25 and 687 days. Advance about 30 days per second.
- Draw a line from Earth through Mars and extend it to a ring around the panel that stands for the distant stars.
- On the right, draw the same system seen from Earth: put Earth at the centre and plot Mars at (Mars minus Earth). Keep a fading trail of the last few years and the loops appear on their own.
- Below both panels, plot Mars's direction from Earth (atan2 of the vector, in degrees) as a strip along the zodiac so you can see it stop, back up and go on. Colour the trail red while that angle decreases.

Once that works, make it beautiful:
- Replace the circles with real Keplerian ellipses: use each planet's semi-major axis, eccentricity, inclination and perihelion, and solve Kepler's equation with a few Newton steps. The small inclination turns the back-and-forth on the strip into a real loop.
- Show Ptolemy's version: in the Earth-centred panel, draw the deferent (Mars's own orbit, centred on Earth) and an epicycle of radius 1 AU whose arm always points the same way as the Earth to Sun line. The planet sits exactly on it.
- Give it the look of an old astronomy book: cream paper with noise stains, sepia ink lines drawn twice with a slight offset, red ink for the retrograde parts and italic serif labels.

Explain the key ideas in short code comments. When you're done, tell me how to open it and suggest three directions I could take it next, such as adding Jupiter, Venus and Saturn, plotting real bright stars along the ecliptic, or a drag-to-scrub timeline.