Planets dim a spotted star; a box-least-squares search and RV fit find them.
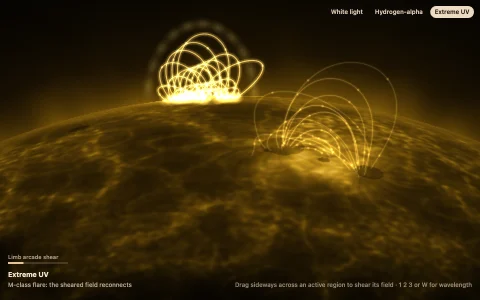
A limb-darkened, granulated star with rotating starspots is watched every 30 simulated minutes, with the clock slowing to a crawl whenever a planet crosses the disk. Each photometric point is the spotted disk's total light minus what each planet blocks, found by sampling the real surface under the planet's disk, plus noise, so spot crossings and rounded transit bottoms appear on their own. The pipeline then works like a survey's: a running median and clipped mean remove the rotational spot signal, a box-least-squares search folds the light curve at thousands of trial periods and slides boxes of several widths to maximize the signal residue, and a peak with high SDE and two observed transits becomes a candidate, whose transits are masked before searching again. The transit periods and epochs then fix the phases of a linear least-squares fit to the radial velocities, turning each wobble amplitude into a planet mass.
Try it. Drag a planet's chord on the star to change its impact parameter (past the limb it stops transiting), and use the wheel or [ and ] to resize the selected planet; the left and right arrows pick a planet and up and down nudge its impact parameter. Add and remove planets and step the photometric noise with the buttons or P, Delete and N; click a row to select a planet and the folded panel to cycle candidates. New star (or R) starts a fresh random system.
Paste this into Claude Code, Codex or any coding agent to get a simple version running, then take it wherever you like.
Build an exoplanet transit detector with JavaScript and the HTML canvas element. Put everything in a single index.html file with no libraries or build step, so I can open it directly in a browser.

Start simple:
- Make a canvas that fills the window and stays sharp on high-DPI screens. On the left draw a star; on the right draw a light curve plot with axes and tick labels, like a figure in a paper.
- Draw the star with limb darkening: brightness I(mu) = 1 - 0.44 (1 - mu) - 0.23 (1 - mu)^2, where mu = sqrt(1 - r^2) and r is the distance from the center as a fraction of the radius.
- Add two planets with a period, a radius (as a fraction of the star's) and an impact parameter. Move them across the star on their orbits and draw them as dark disks.
- Every 30 simulated minutes, compute the star's brightness: 1 minus, for each planet in front, its disk area times the limb-darkened brightness at its center, divided by the star's total light. Add Gaussian noise and plot the point.

Once that works, make it beautiful:
- Write a box-least-squares search: for a few thousand trial periods, fold the data, bin it by phase, slide boxes of a few widths over the bins and score each by s^2 / (n (1 - n/N)), where s is the sum of mean-subtracted flux in the box and n its number of points. Plot the best score per period as a periodogram and mark the peak.
- Show the data folded at the best period with a box model, then mask those transits and search again for the next planet.
- Let me drag a planet's path up and down across the star and add new planets, and rerun the search.

Explain the key ideas in short code comments. When you're done, tell me how to open it and suggest three directions I could take it next, such as rotating starspots with a detrending filter, a radial velocity plot fitted at the transit periods to get masses, or harder noise levels.