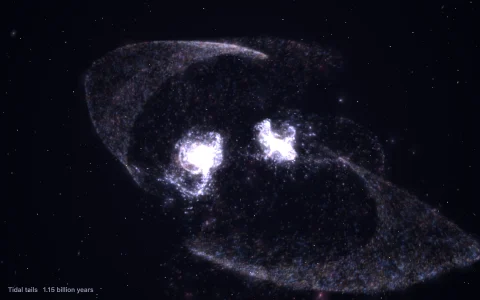
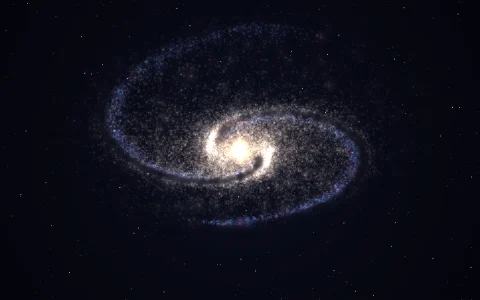
Switch off the dark halo and watch a spiral galaxy fly apart.
A face-on spiral galaxy built from three mass components with their textbook velocity laws: a Hernquist bulge, an exponential disk (Freeman's formula, with modified Bessel functions computed from polynomial fits) and a pseudo-isothermal dark halo. More than 40,000 stars and gas clouds orbit in that potential under a leapfrog integrator, and the blue points on the plot are measured from them ring by ring, the way radio astronomers trace hydrogen gas. With the halo the curve stays flat far past the starlight; without it the visible mass cannot hold the outer stars, which are moving faster than its escape speed, and the disk tears itself apart. Young stars and pink nebulae are born on a rotating density wave and drift off it, and dust darkens the arms.
Try it. Switch the halo off and on, or mix bulge, disk and halo masses with the sliders. Settle orbits puts every star on a circular orbit in the current potential, showing the falling curve a galaxy without dark matter would have. Doppler view colors every star by its line-of-sight velocity, the way radio telescopes map rotation. Click a star to follow its orbit and speed. Keys: H halo, E settle, V Doppler, R reset.
Paste this into Claude Code, Codex or any coding agent to get a simple version running, then take it wherever you like.
Build an interactive galaxy rotation curve demo with JavaScript and the HTML canvas element, showing why astronomers believe in dark matter. Put everything in a single index.html file with no libraries or build step, so I can open it directly in a browser.

Start simple:
- Make a canvas that fills the window, stays sharp on high-DPI screens (scale by devicePixelRatio), and has a near-black background. Put the galaxy on the left and a plot on the right.
- Work in kiloparsecs and km/s with G = 4.30091e-6. Write circular velocity functions for a bulge (Hernquist: v^2 = G M r / (r + a)^2), a disk (approximate it at first as a Plummer sphere) and a dark halo (pseudo-isothermal: v^2 = V^2 (1 - (rc / r) atan(r / rc))). The total is the square root of the summed squares.
- Place about 10,000 stars on circular orbits, with an exponential distribution of radii, and move them each frame with a leapfrog integrator using the radial pull v_c(r)^2 / r.
- Plot the total curve, each component, and the 'visible only' curve (bulge plus disk) against radius.
- Add a button that switches the halo off while the stars keep their speeds.

Once that works, make it beautiful:
- Draw stars additively (globalCompositeOperation = "lighter") with warm colors in the bulge, and give a few hundred young blue stars birthplaces along two logarithmic spiral arms so the disk has structure.
- Measure the average orbital speed of the stars in rings and plot those points on top of the model curves, so the plot reports what the simulation is actually doing.
- Add sliders for the bulge, disk and halo masses.

Explain the key ideas in short code comments. When you're done, tell me how to open it and suggest three directions I could take it next, such as the exact exponential disk formula with Bessel functions, a Doppler-colored velocity map, or MOND as an alternative to dark matter.