- The paper presents a novel ML framework that predicts manufacturing costs from 2D CAD drawings using geometric and statistical features.
- It employs gradient boosting algorithms with Bayesian hyperparameter optimization, achieving MAPE as low as 3.91% in several product groups.
- The approach enables rapid, automated cost estimation and design optimization, paving the way for real-time integration into digital manufacturing workflows.
Machine Learning-Based Manufacturing Cost Prediction from 2D Engineering Drawings via Geometric Features
Introduction and Motivation
The paper presents a comprehensive ML framework for predicting manufacturing costs directly from 2D engineering drawings, specifically DWG files, in the automotive sector. The motivation stems from the inefficiency and inconsistency of traditional cost estimation workflows, which are labor-intensive, error-prone, and slow, often requiring weeks of expert analysis per drawing. The proposed approach leverages geometric and statistical features extracted from technical drawings to train gradient-boosted decision tree models, enabling rapid, accurate, and explainable cost predictions. This is particularly relevant for Industry 4.0 and digital manufacturing paradigms, where real-time, automated decision support is essential.
Figure 1: Example engineering drawing from the dataset.
Dataset Construction and Feature Engineering
The dataset comprises 13,684 DWG drawings of automotive suspension and steering components, spanning 24 product groups and 30 car manufacturers. Each drawing is associated with a historical unit manufacturing cost, updated for inflation. The DWG files are batch-converted to DXF format to facilitate reliable geometric parsing, avoiding the inaccuracies of vision-based methods.
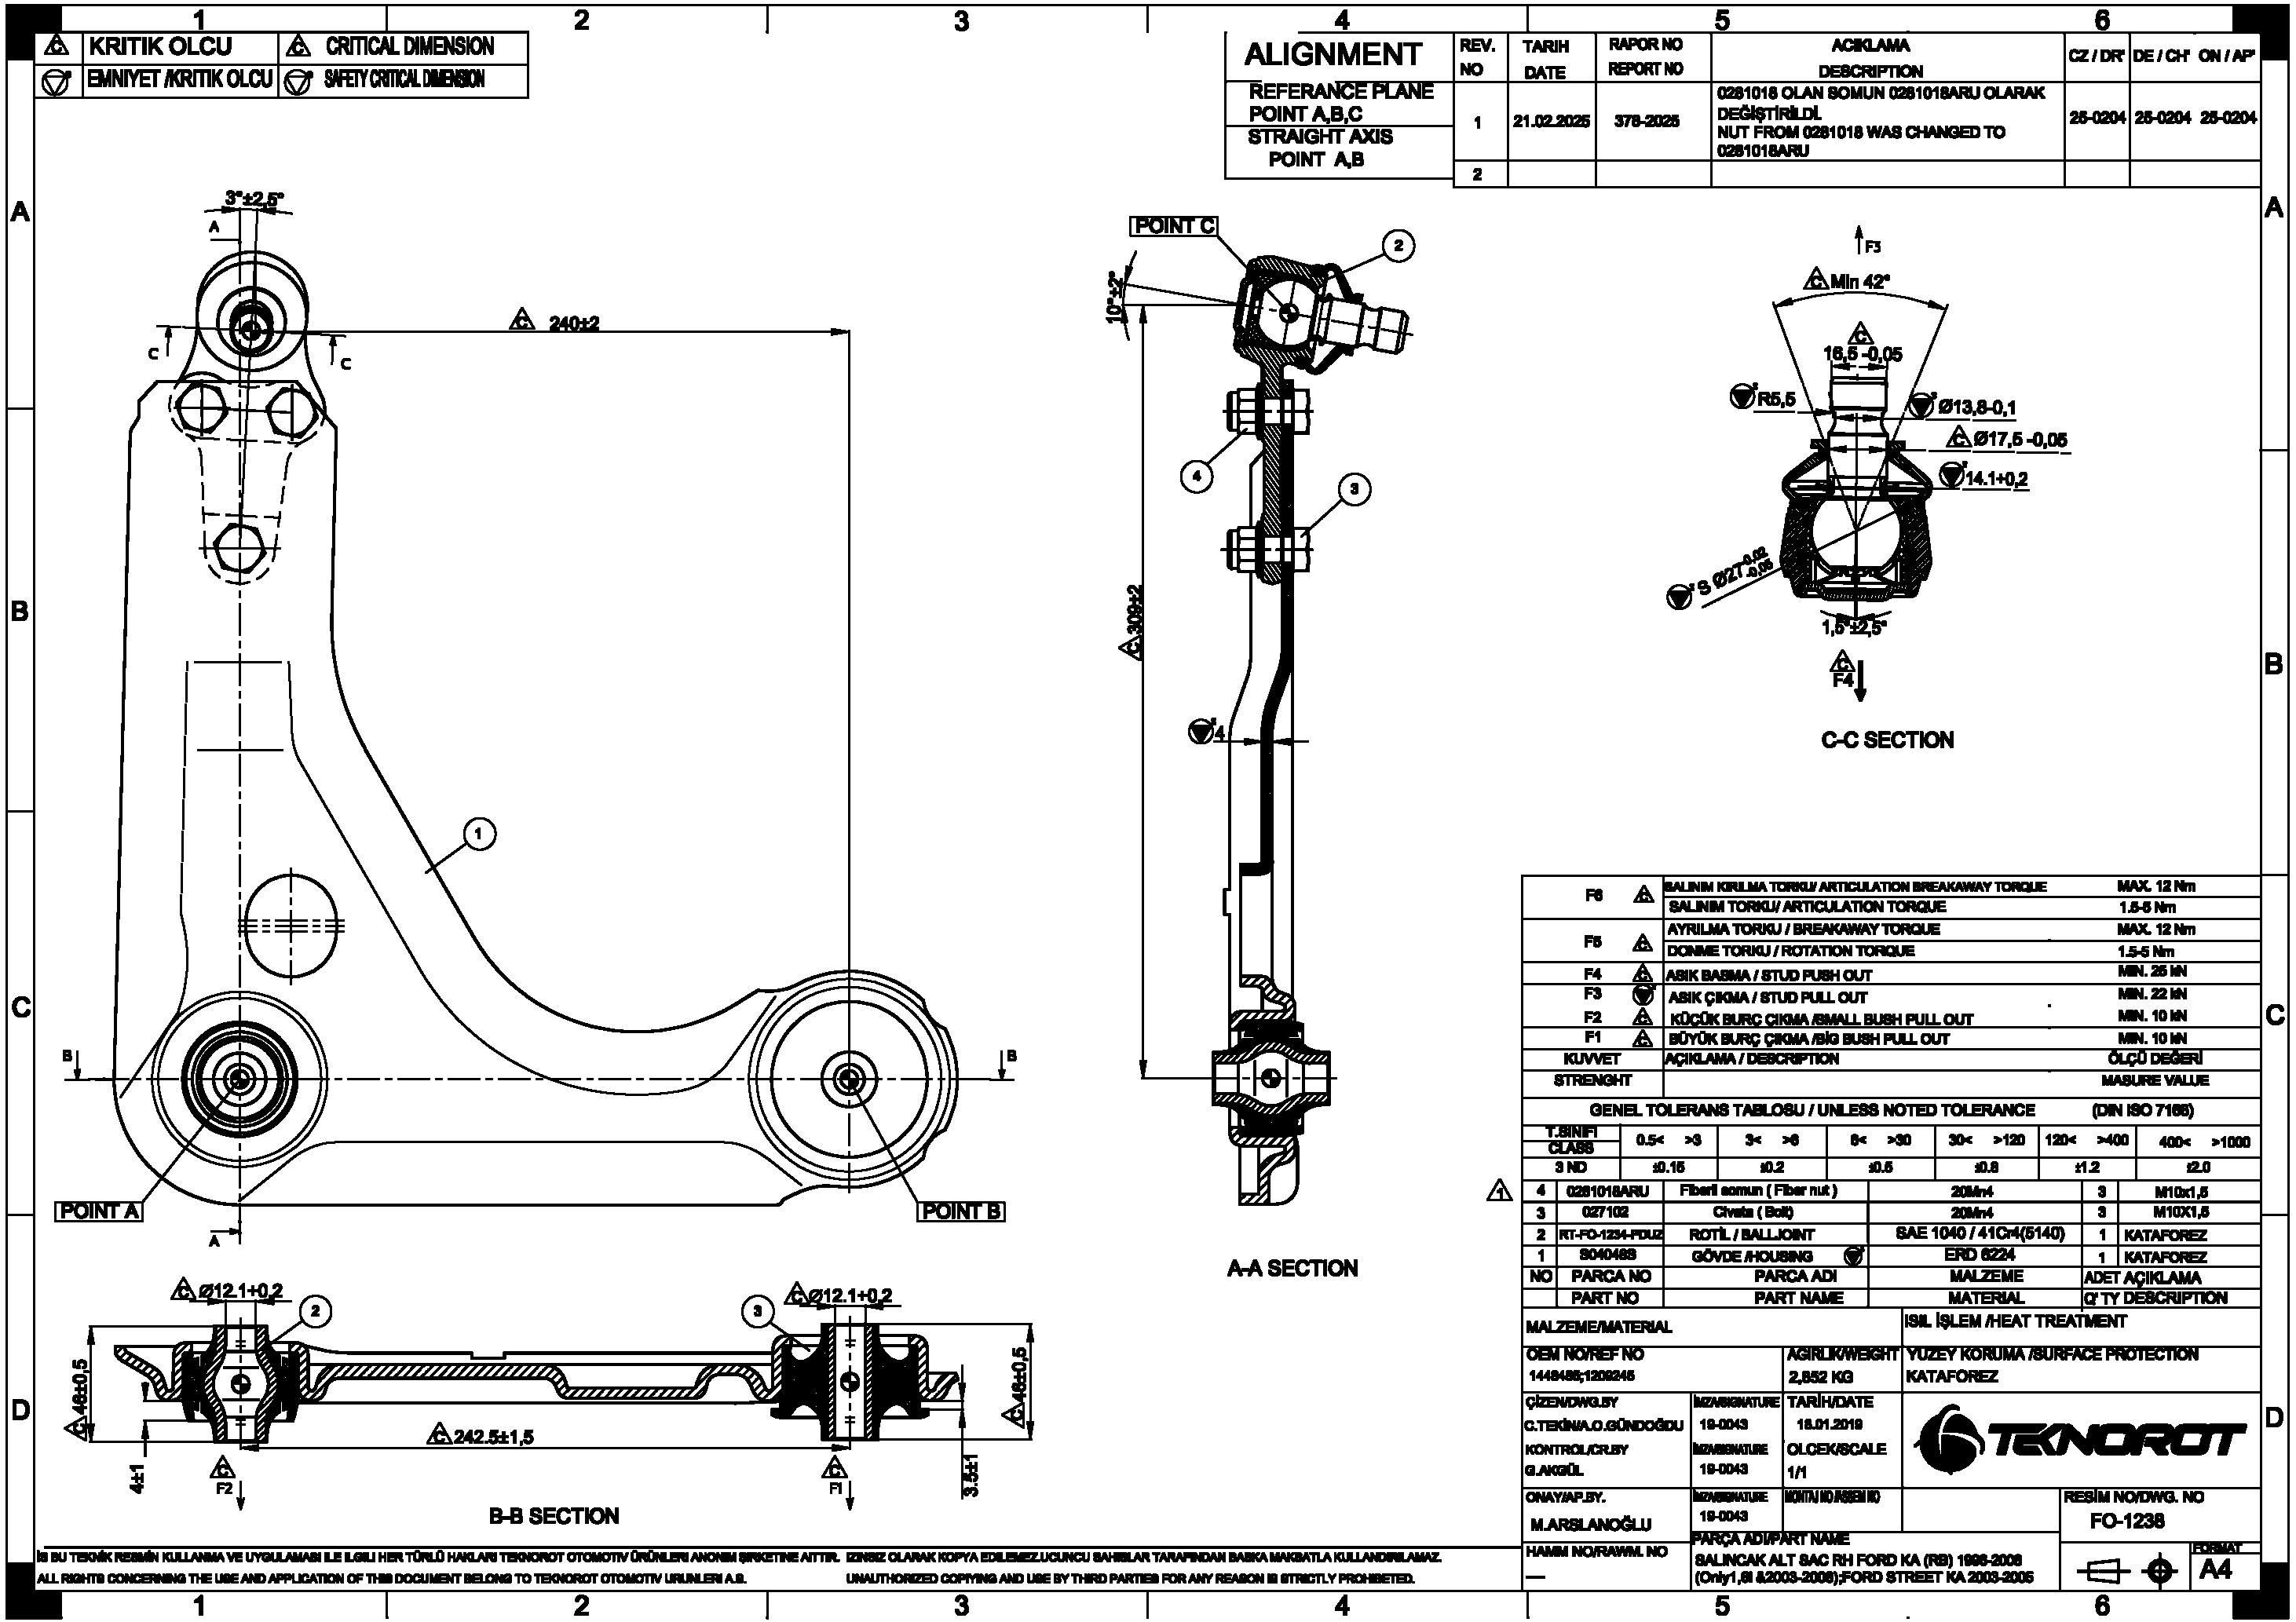
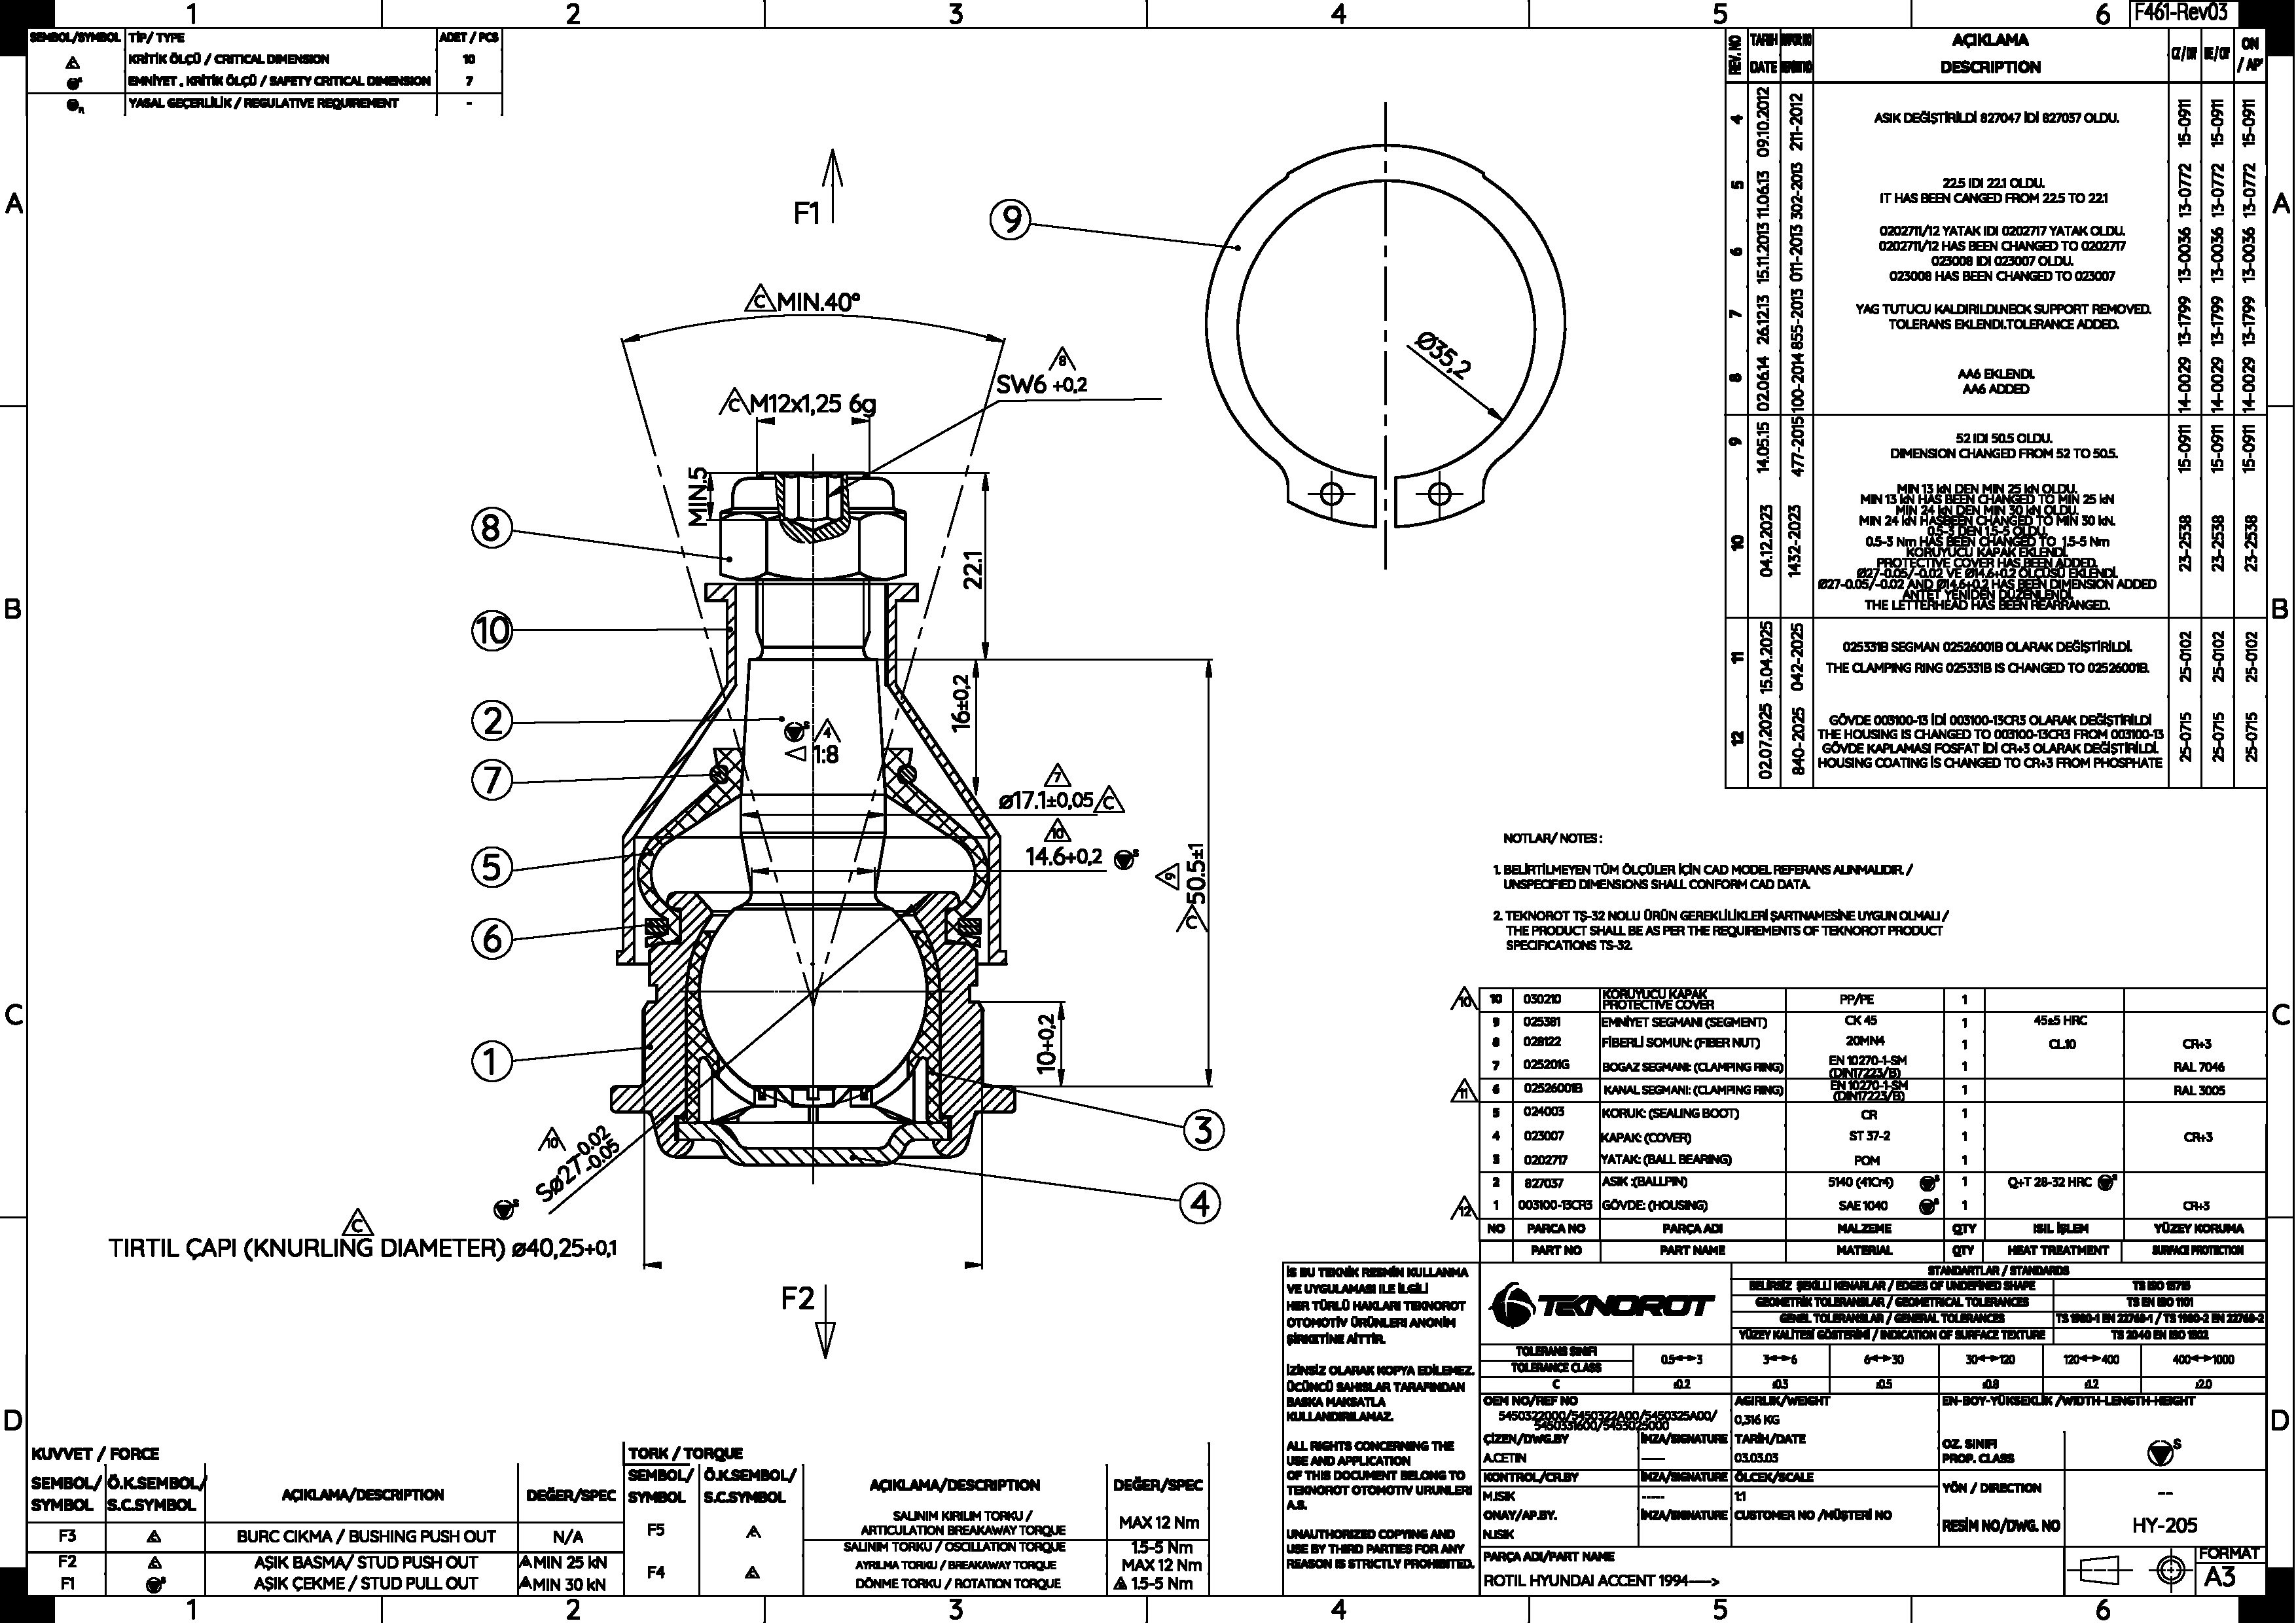
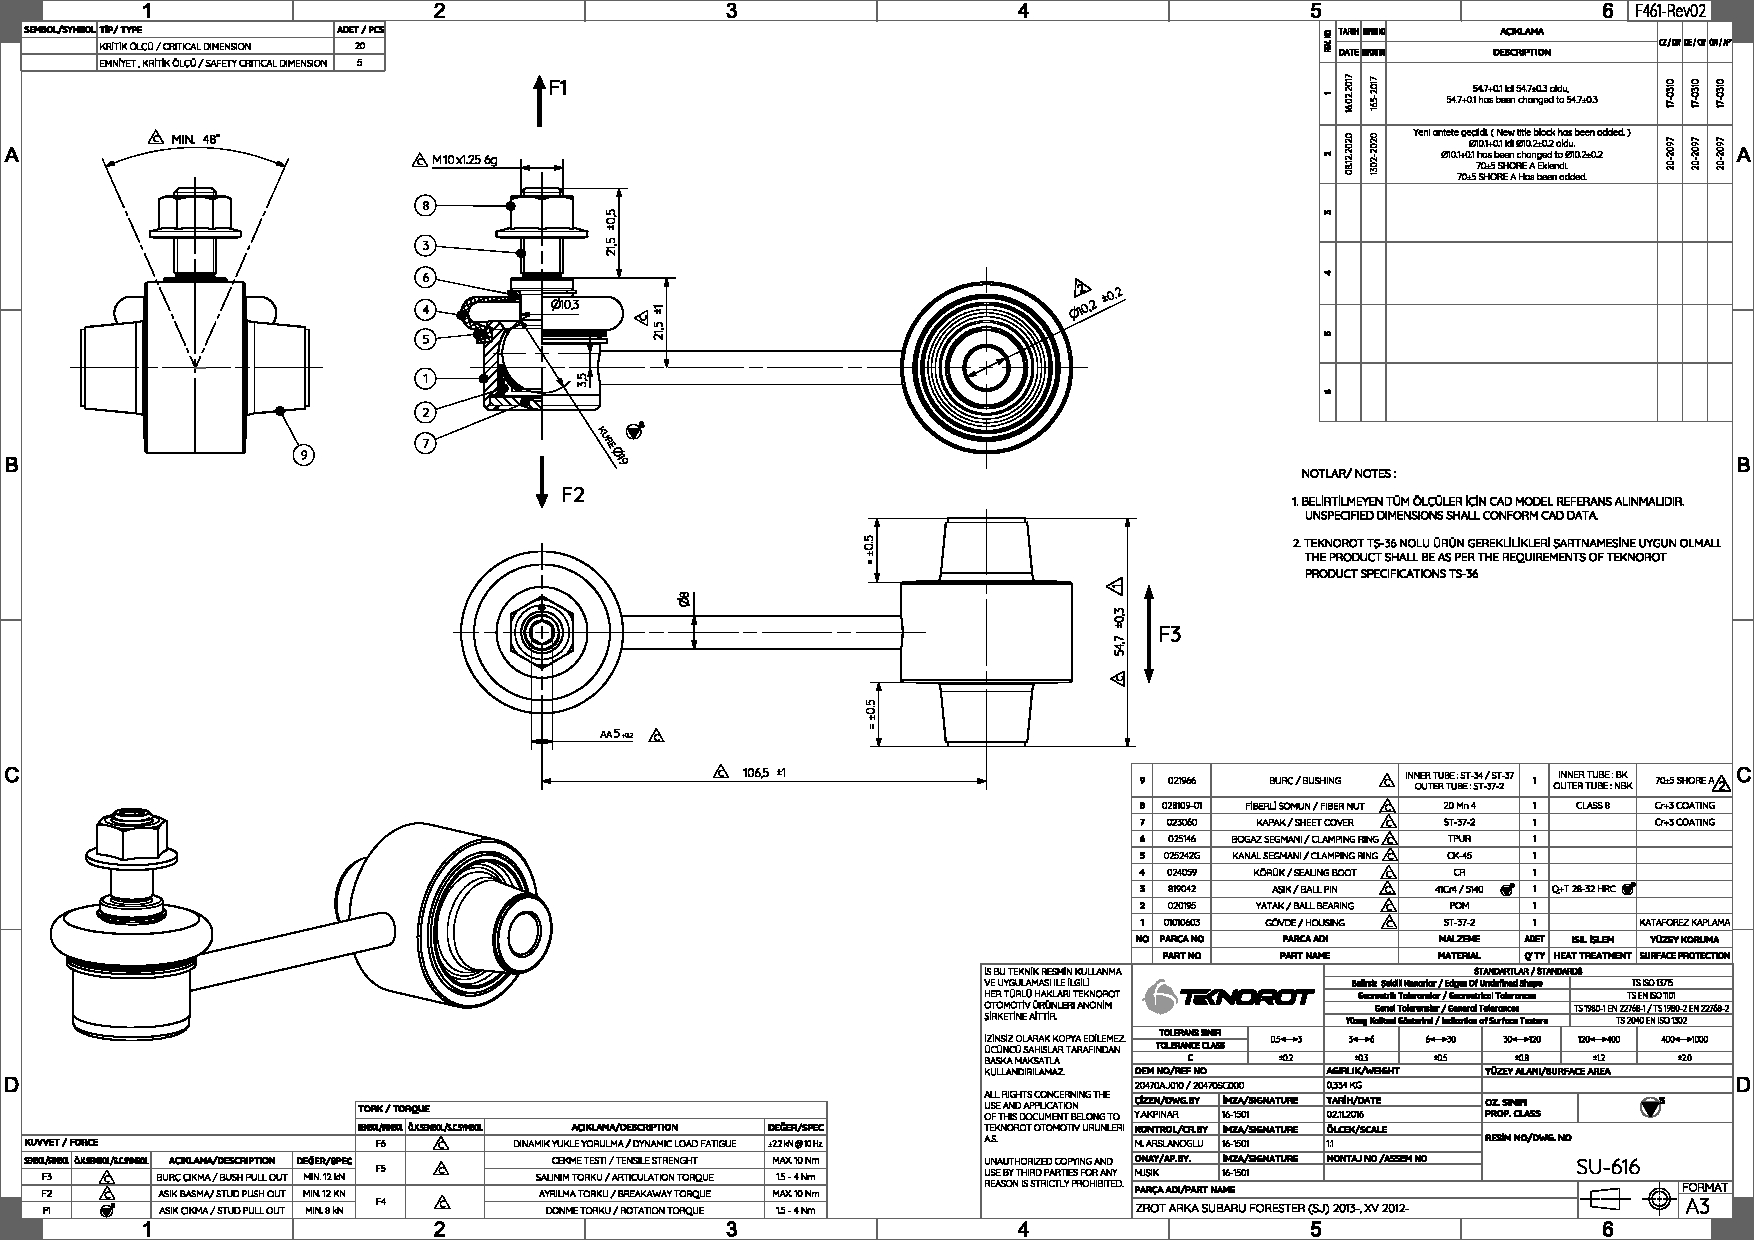
Figure 2: Inner Tie Rod (960).
The geometric parsing pipeline extracts three main categories of features:
- Geometric primitives: LINE, CIRCLE, ARC, SPLINE, and ELLIPSE, with properties such as lengths, radii, angles, and control points.
- Dimension entities: Rotated, Angular, Diametric, and Radial dimensions, including measurement values and tolerances, with a global scale factor for real-world unit conversion.
- Textual content: Material labels parsed from TEXT and MTEXT entities.
Feature engineering proceeds in two stages:
- Descriptive/statistical features: For each geometric/dimensional quantity, summary statistics (count, min, max, mean, std, skewness, kurtosis) and histogram-based features (12 bins) are computed.
- Distributional distance metrics: For each drawing, Euclidean distance and Kullback–Leibler (KL) divergence are calculated between its feature histograms and the mean distribution of its product group, capturing geometric atypicality.
Machine Learning Methodology
Three state-of-the-art gradient boosting algorithms—XGBoost, CatBoost, and LightGBM—are employed for regression. These models are well-suited for tabular data, robust to multicollinearity, and provide inherent interpretability. The models are trained to predict unit manufacturing cost using the engineered features, with a 70:15:15 train/validation/test split. Hyperparameter optimization is performed per product group using Bayesian optimization (Optuna), targeting mean absolute percentage error (MAPE) as the primary metric. Five-fold cross-validation and early stopping are used to ensure generalization and computational efficiency.
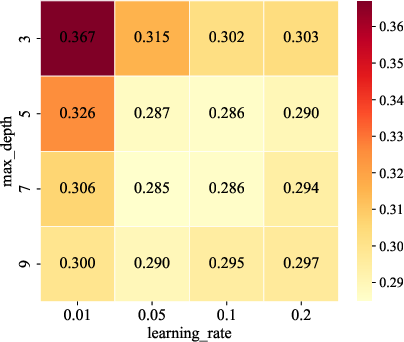
Figure 3: Mean MAE over 5-fold cross-validation for different combinations of max_depth and learning_rate in the XGBoost model trained on the Link Stabilizer product group.
Grid search over max_depth and learning_rate reveals that moderate tree depths (e.g., 7) and intermediate learning rates (0.05–0.10) yield optimal performance, with deeper trees leading to overfitting.
Across 24 product groups, the models achieve MAPE values between 3.91% and 18.51%, with 10 groups below 10%. Notably, strong performance is not strictly correlated with dataset size; geometric consistency and cost variability within groups are more influential. XGBoost achieves the lowest MAPE in 11 groups, CatBoost in 9, and LightGBM in 4, with XGBoost showing the most consistent performance, especially in groups with distinct geometric patterns.

Figure 4: Actual vs. predicted unit costs across all product groups.
The scatter plot of actual vs. predicted costs demonstrates that the models closely track the ideal diagonal, with some underestimation for high-cost outliers, likely due to data scarcity and increased complexity in expensive parts.
Feature Importance and Explainability
Feature importance analysis across all models highlights several geometric and statistical features as primary cost drivers:
- Rotated_max: Maximum length from rotated dimensions, consistently among the top features.
- Arc geometry: Features such as arc_angle_mean, arc_angle_min, arc_mean, and arc_total are highly ranked, indicating the significance of curvature.
- Histogram-based features: Norm_line_bin8, norm_line_bin9, and arc_angle_bin12 capture distributional shape information.
- Divergence metrics: KL divergence and Euclidean distance from group means signal geometric atypicality and complexity.
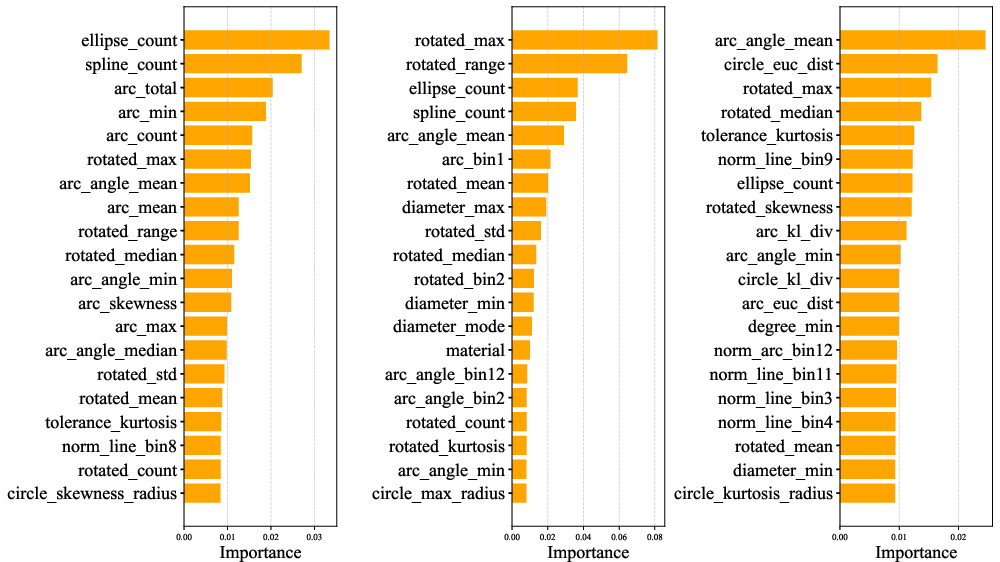
Figure 5: Top 20 most important features for each gradient boosting algorithm: XGBoost, CatBoost, and LightGBM, respectively.
A simple decision tree trained on the Link Stabilizer group provides a transparent view of the sequential decision logic, with splits on diameter_median, ellipse_count, and tolerance_skewness, confirming the importance of dimensional statistics and shape complexity.
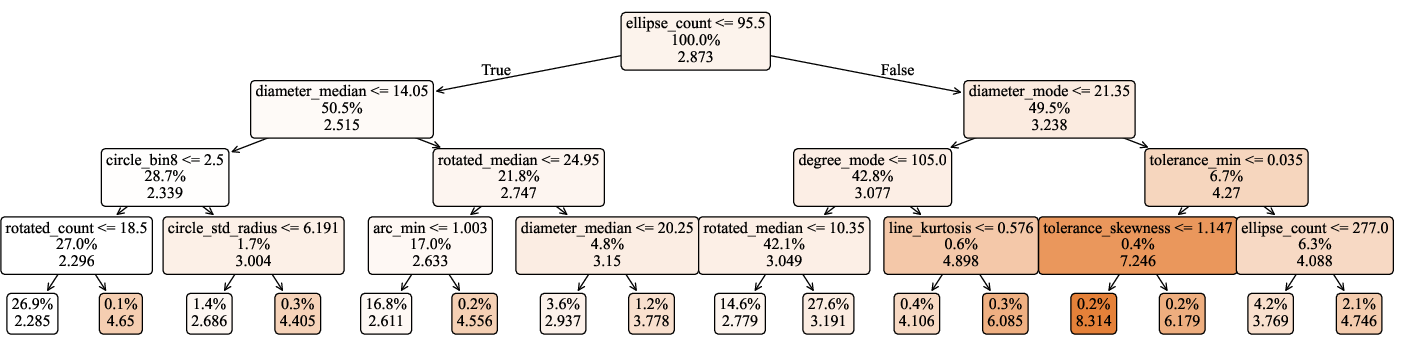
Figure 6: Simple Decision tree for the Link Stabilizer group showing feature influence on manufacturing cost. In internal nodes, the first line shows the split rule, the second line indicates the proportion of samples and the third line displays the node's prediction of cost.
SHAP analysis further quantifies feature contributions, with ellipse_count, diameter_max, and rotated_median having the highest impact on predicted cost. Material indicators (e.g., TPU) and tolerance statistics also play significant roles.
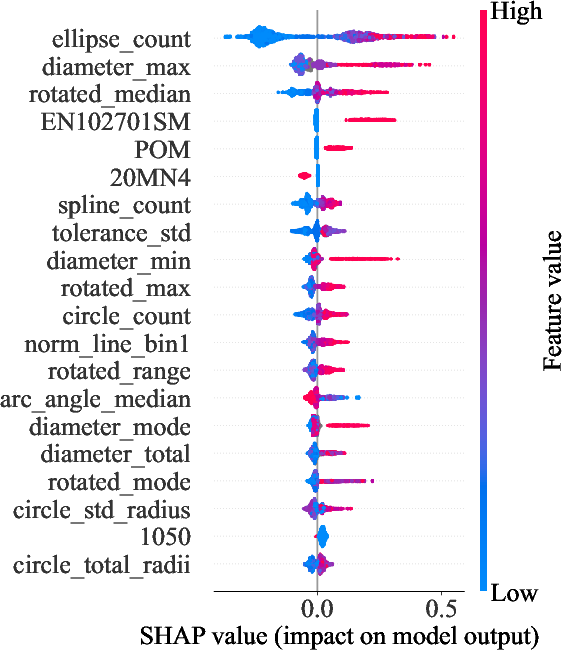
Figure 7: SHAP summary plot for the XGBoost model trained on Link Stabilizer product group.
Practical Implications and Theoretical Significance
The framework enables rapid, automated, and explainable cost estimation from 2D engineering drawings, eliminating the need for manual process planning or expert-driven heuristics. This has several practical implications:
- Quotation acceleration: Instantaneous cost feedback for online manufacturing platforms, reducing lead times from weeks to seconds.
- Design optimization: Actionable insights into cost-driving geometric features, enabling cost-aware design modifications.
- Consistency and transparency: Standardized, data-driven cost assessments across diverse product lines.
- ERP/CAD integration: The system can be embedded in digital production pipelines for real-time decision support.
Theoretically, the work demonstrates that geometric and statistical features extracted from 2D drawings are sufficient for accurate cost modeling, challenging the prevailing focus on 3D CAD-based approaches. The use of explainable ML methods bridges the gap between black-box prediction and engineering interpretability.
Limitations and Future Directions
While the models achieve strong predictive accuracy, performance degrades for high-cost, complex, or underrepresented parts. The reliance on geometric features alone may limit applicability in domains where process-specific or material-dependent factors dominate. The current approach does not explicitly model spatial relationships between geometric entities.
Future research directions include:
- Synthetic data augmentation: Generating additional drawings to address class imbalance and improve robustness.
- Graph-based modeling: Capturing spatial relationships and topological features using graph neural networks.
- Domain adaptation: Extending the feature extraction pipeline to other sectors (e.g., aerospace, civil engineering) by incorporating domain-specific entities.
- Integration with process simulation: Combining geometric features with process simulation outputs for enhanced accuracy.
Conclusion
The paper establishes a robust, interpretable, and scalable ML pipeline for manufacturing cost prediction from 2D engineering drawings, achieving MAPE values frequently below 10% across a large, diverse dataset. The approach demonstrates that geometric and statistical features, when processed with gradient-boosted decision trees and explainability tools, provide actionable insights for both cost estimation and design optimization. The framework is readily deployable in digital manufacturing environments and offers a foundation for further research into automated, geometry-driven cost modeling.