- The paper introduces AL-RNNs to produce minimal piecewise linear reconstructions that simplify interpretation of complex dynamical systems.
- It combines linear self-connections with rectified-linear units, trained via state-of-the-art algorithms, to efficiently capture system dynamics.
- Experimental evaluations on systems like Lorenz-63 and Rössler demonstrate comparable performance with reduced complexity and enhanced symbolic encoding.
AL-RNNs for Interpretable Symbolic Codes in Dynamical Systems Reconstruction
This paper introduces Almost-Linear Recurrent Neural Networks (AL-RNNs) for dynamical systems reconstruction (DSR), aiming to produce parsimonious piecewise linear (PWL) representations from time series data. AL-RNNs combine linear units and rectified-linear units (ReLUs), trained via state-of-the-art (SOTA) algorithms, to discover topologically minimal PWL representations and enable interpretable symbolic encoding of underlying dynamics.
Background and Motivation
Dynamical systems theory is fundamental for many areas of science and engineering. Piecewise linear (PWL) models are valuable in both engineering and mathematical analysis due to their tractability. However, manually creating such models is difficult, especially for high-dimensional systems, and data-driven approaches often lead to overly complex representations. AL-RNNs address this by automatically generating simplified PWL representations, facilitating mathematical and computational analysis.
AL-RNN Architecture and Training
The AL-RNN model is defined as:
zt=Azt−1+WΦ∗(zt−1)+h
where A is a diagonal matrix of linear self-connections, W represents nonlinear connections, h is a bias term, and Φ∗(zt) is a modified ReLU function applied to a subset of P<<M units. This design limits the number of linear subregions to 2P, enhancing interpretability while maintaining a large number of latent states M for capturing complex dynamics. The AL-RNN architecture is illustrated in (Figure 1).
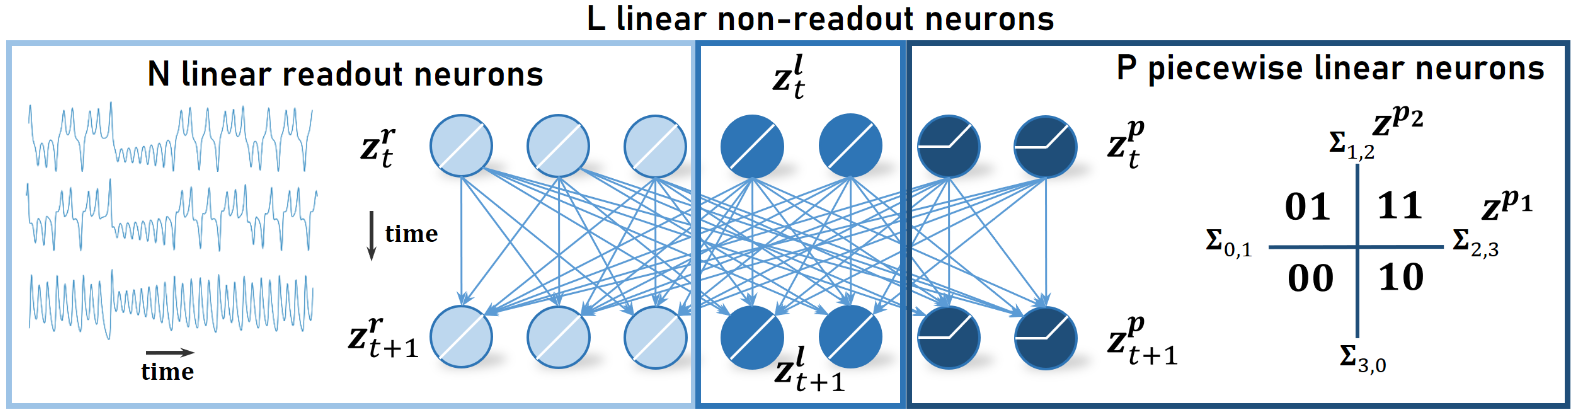
Figure 1: Illustration of the AL-RNN architecture.
Training involves identity teacher forcing, where the first N latent states are replaced by N-dimensional observations every τ time steps. This approach, combined with Mean Squared Error (MSE) loss, facilitates effective learning.
Symbolic Dynamics and Coding
The paper leverages symbolic dynamics to analyze AL-RNNs. A topological partition is formed from the AL-RNN's linear subregions, and a unique symbol is assigned to each region. As trajectories traverse these regions, a symbolic sequence is generated. This symbolic coding facilitates the construction of topological graphs, where vertices represent symbols and edges represent transitions between subregions (Figure 2).
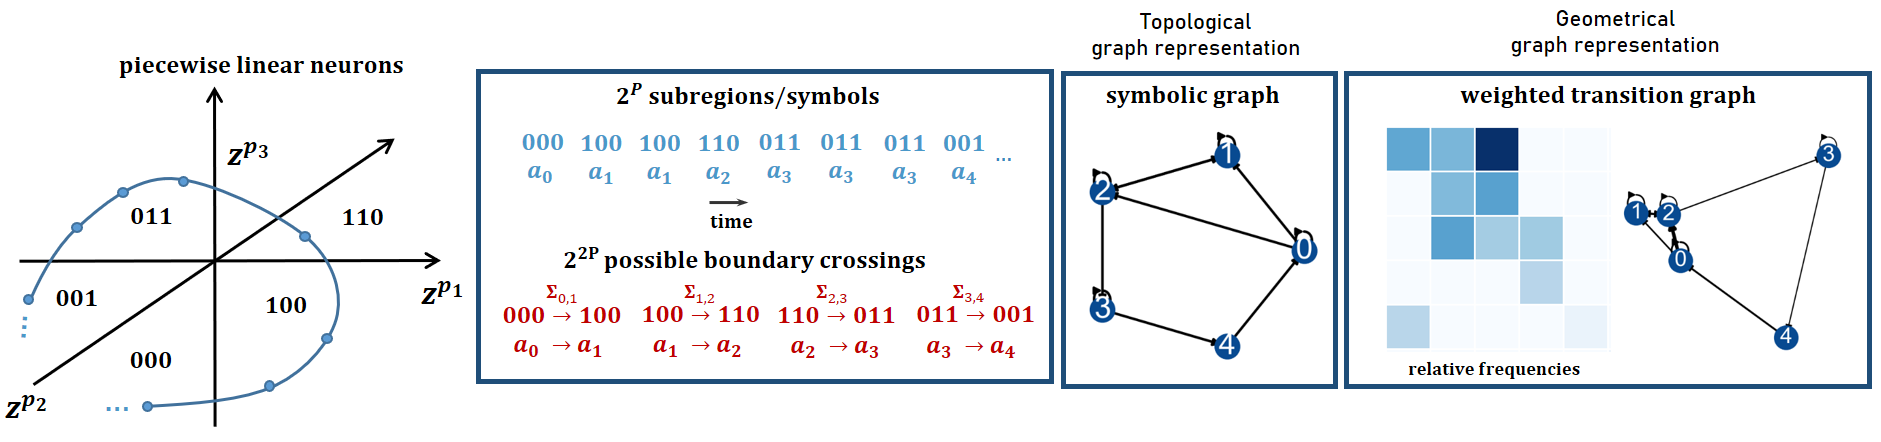
Figure 2: Illustration of symbolic approach (3 panels on the left) and geometrical graphs (right).
Theoretical Results
The paper presents theorems establishing relationships between the dynamics of AL-RNNs and their symbolic codings:
- Theorem 1: An orbit of the AL-RNN is asymptotically fixed if and only if the corresponding symbolic sequence is eventually fixed.
- Theorem 2: An orbit of the AL-RNN is asymptotically p-periodic if and only if the corresponding symbolic sequence is eventually p-periodic.
- Theorem 3: An orbit of the AL-RNN is asymptotically aperiodic if and only if the corresponding symbolic sequence is aperiodic.
These theorems confirm that the symbolic coding preserves essential topological properties, linking fixed points, cycles, and chaotic behavior in the AL-RNN to corresponding features in the symbolic representation.
Experimental Evaluation
The paper evaluates AL-RNN performance using metrics based on long-term topological, geometrical, and temporal features of reconstructed DS, specifically the Kullback-Leibler divergence (Dstsp) and the Hellinger distance (DH). AL-RNNs were tested on the Lorenz-63 system, the Rössler system, human ECG data, and human fMRI data.
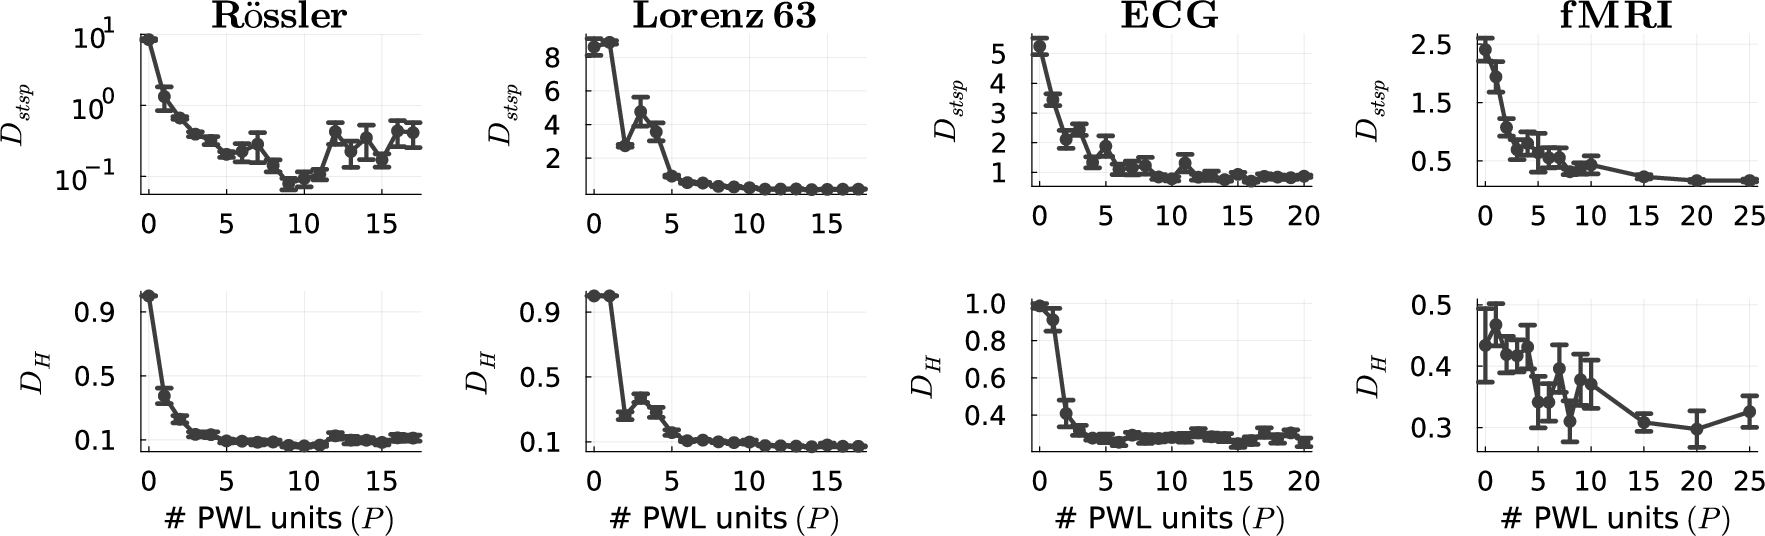
Figure 3: Quantification of DSR quality in terms of attractor geometry disagreement ($D_{\text{stsp}$
The results demonstrate that AL-RNNs achieve performance comparable to SOTA methods while using fewer PWL nonlinearities. For example, AL-RNNs can reconstruct the overall structure of chaotic attractors using only three (Lorenz-63) or two (Rössler) linear subregions (Figure 4).
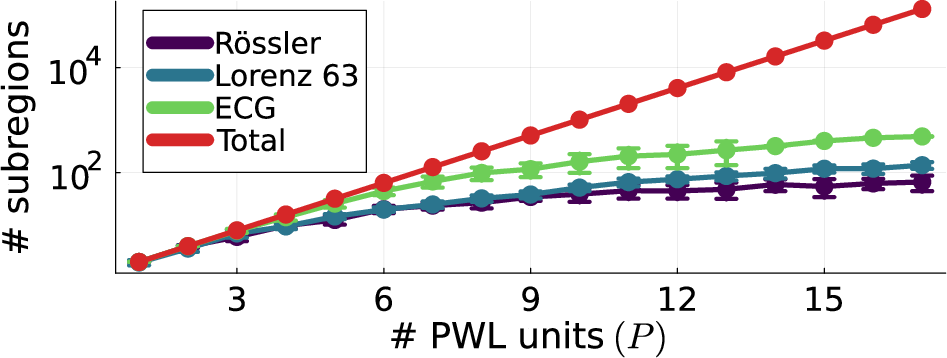
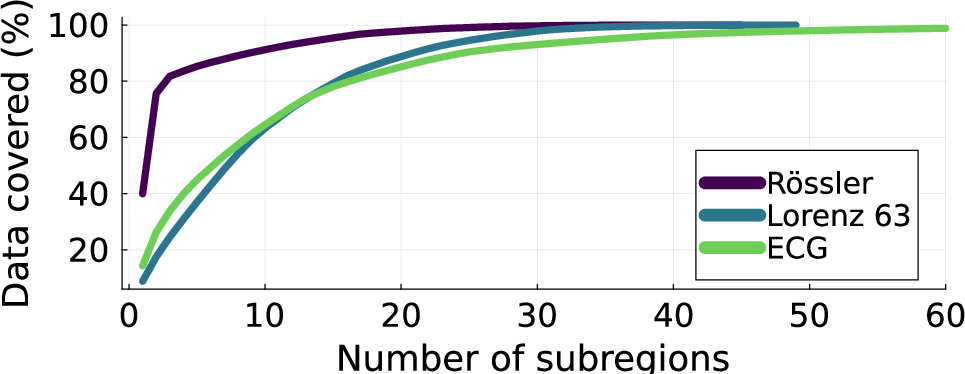
Figure 5: Left: Number of linear subregions traversed by trained AL-RNNs as a function of the number P of ReLUs. Theoretical limit (2P) in red. Right: Cumulative number of data (trajectory) points covered by linear subregions in trained AL-RNNs (Rössler: M=20, P=10, Lorenz-63: M=20, P=10, ECG: M=100, P=10), illustrating that trajectories on an attractor live in a relatively small subset of subregions.
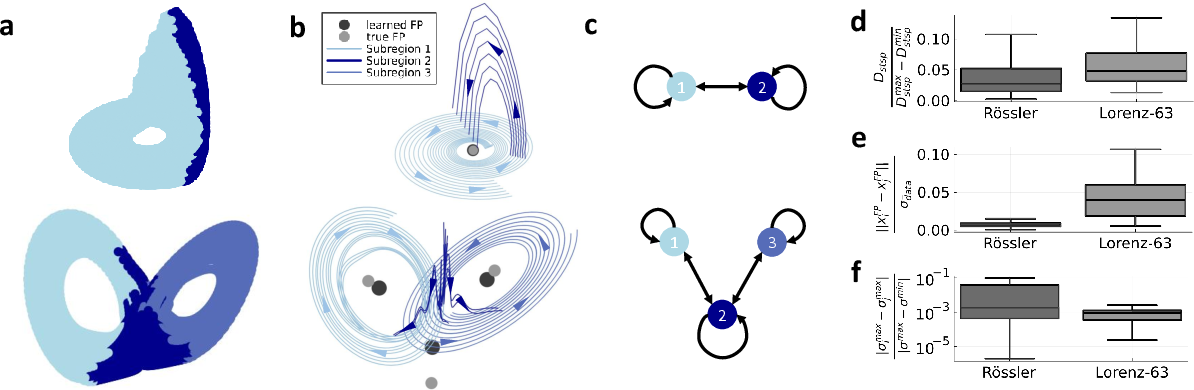
Figure 4: a: Color-coded linear subregions %(mapped to observation space)
of minimal AL-RNNs representing the Rössler (top) and Lorenz-63 (bottom) chaotic attractor. b: Illustration of how the AL-RNN creates the chaotic dynamics. For the Rössler, trajectories diverge from an unstable spiral point (true position in gray, learned position in black) into the second subregion, where
after about half a cycle
they are propelled back into the first. For the Lorenz-63, two unstable spiral points (true: gray; learned: black) create the diverging spiraling dynamics in the two lobes, separated by the
saddle node in the center. c: Topological graphs of the symbolic coding. While for the Rössler it is fully connected, for the Lorenz-63 the crucial role of the center saddle region in distributing trajectories onto the two lobes is apparent. d: Geometrical divergence ($D_{\text{stsp}$) among repeated trainings of AL-RNNs (n=20), separately evaluated within each subregion, shows close agreement among different training runs. Likewise, low e: normalized distances between fixed point locations and f: relative differences in maximum absolute eigenvalues $\sigma^{\text{max}$ across $20$ trained models indicate that these topologically minimal representations are robustly identified.
The minimal PWL reconstructions correspond closely to known topologically minimal PWL representations, like those described by \citet{amaral_piecewise_2006}. The AL-RNN can automatically discover these representations from data without prior knowledge of the system.
PWL Reconstructions of Real-World Systems
AL-RNNs were also applied to human ECG and fMRI data. In ECG data, the AL-RNN with only three linear subregions captured the complex activity patterns, with subregions corresponding to distinct phases of the ECG cycle. Similarly, in fMRI data, the AL-RNN captured the task-related activity patterns, with linear subregions aligning with different cognitive task stages (Figure 6). The weights of the PWL units were significantly larger than those of other units, indicating their critical role in modulating the dynamics and representing task-related variations in brain activity (Figure 7).
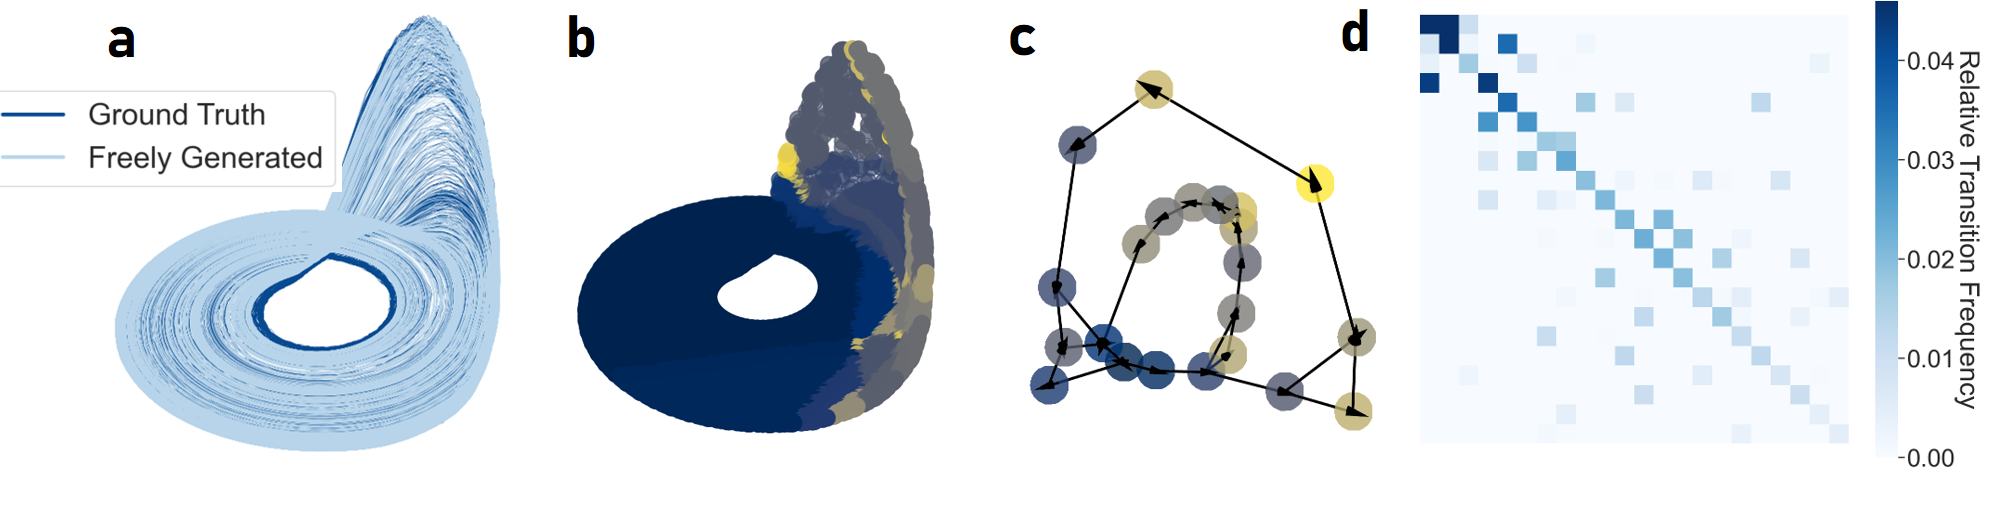
Figure 8: Geometrically minimal reconstruction and graph representation of the Rössler attractor (M=30,P=10,Dstsp
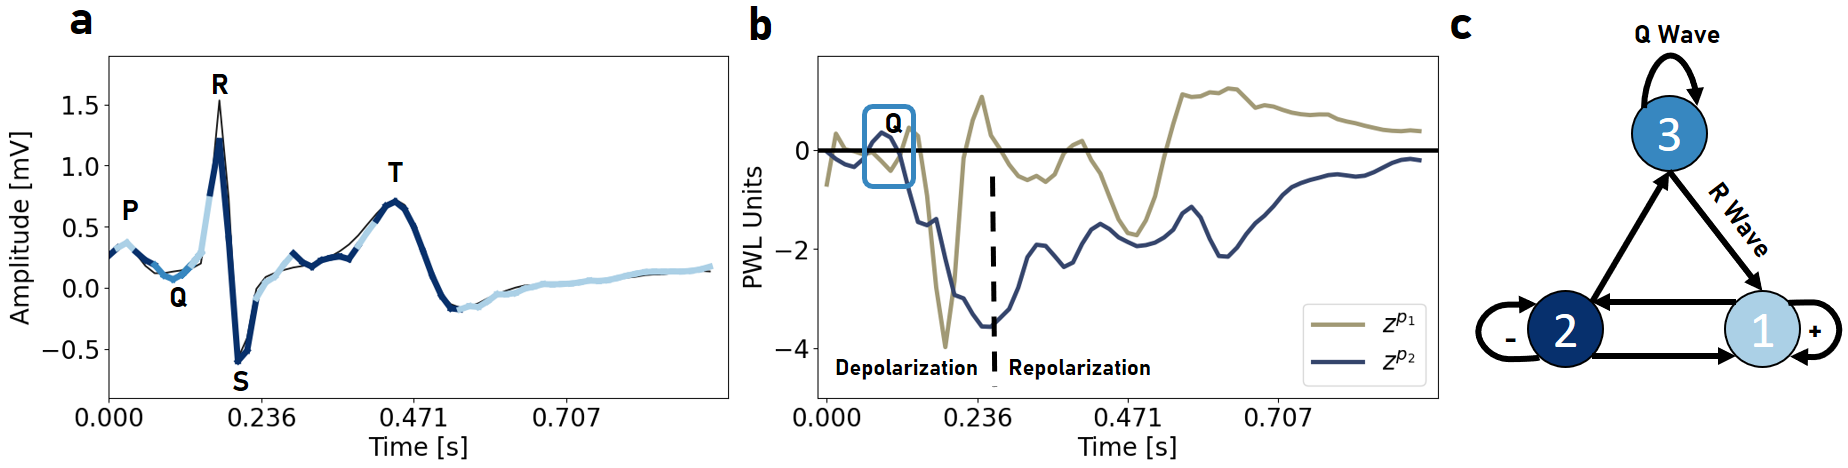
Figure 9: a: Freely generated ECG activity using an AL-RNN with 3 linear subregions (color-coded according to subregion) and ground truth time series in black. % aligning with ECG activation patterns.
b: After activation of the Q wave in the third subregion, the
c: Symbolic graph representation of the trained AL-RNN.
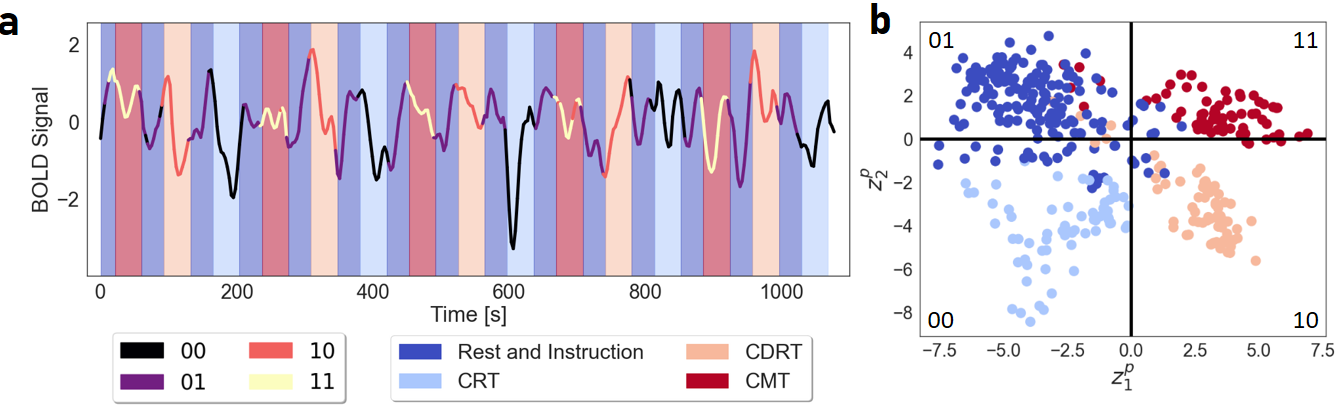
Figure 6: Reconstructions from human fMRI data using an AL-RNN with M=100 total units and P=2 PWL units. a: Mean generated BOLD activity color-coded according to the linear subregion. Background color shadings indicate the task stage. b: Generated activity (trajectory points) in the latent space of PWL units with color-coding indicating task stage as in a. %The quadrants encoding the four linear subregions closely align with the different task stages.
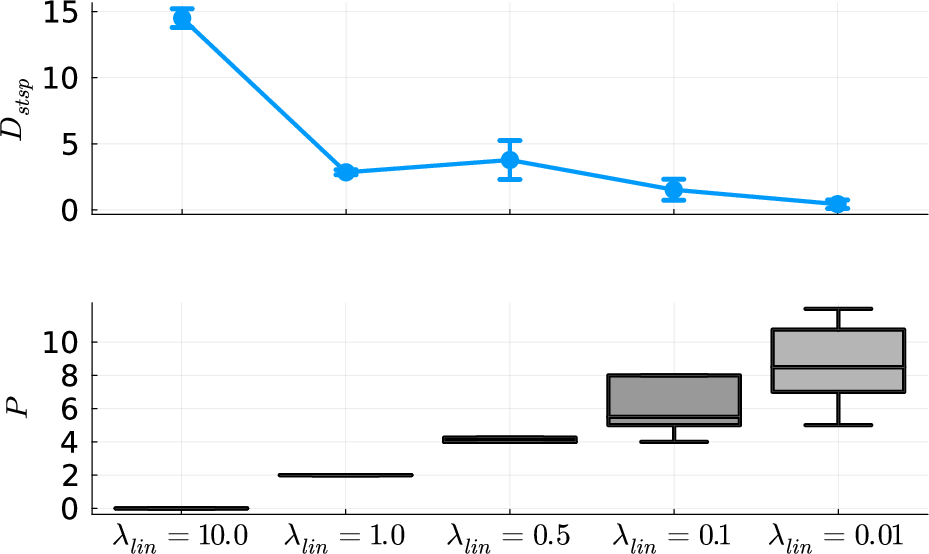
Figure 10: Top: DSR quality (assessed by Dstsp
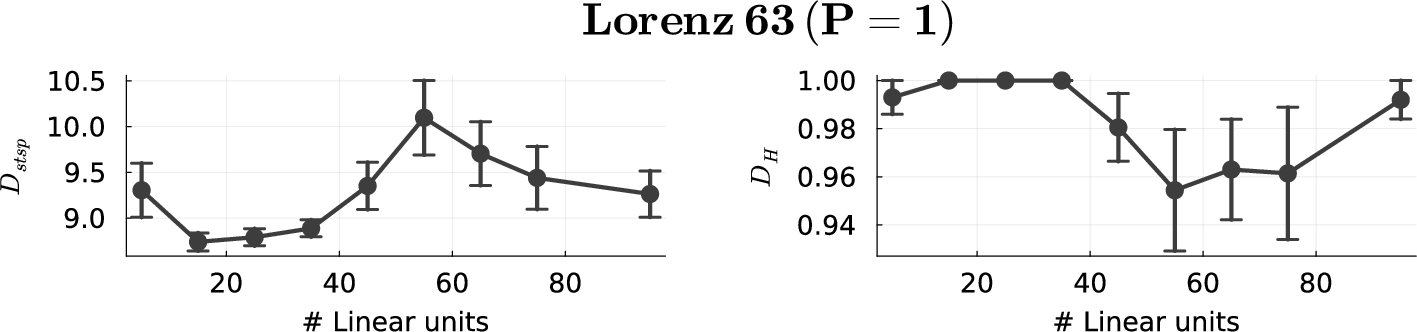
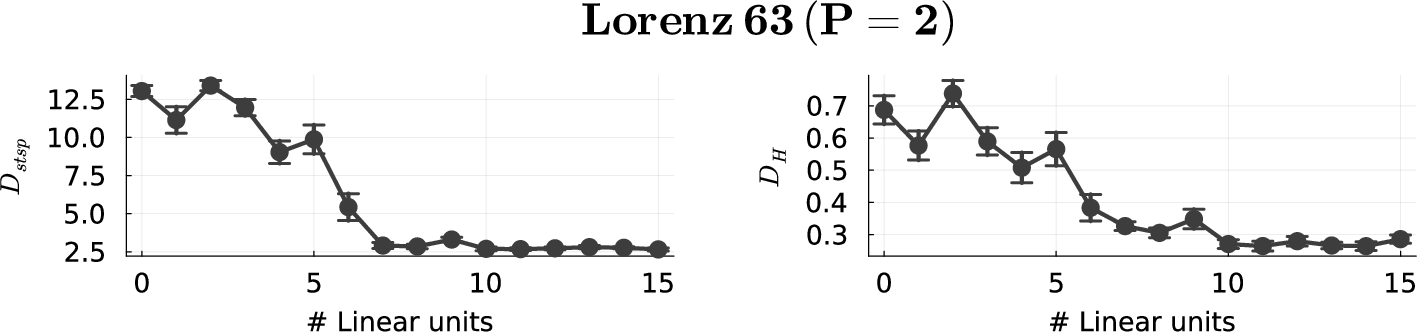
Figure 11: Reconstruction performance on Lorenz-63 system for an AL-RNN (M=20) as a function of the number of linear units, once for the case where the number of PWL units was insufficient for a topologically accurate reconstruction (P=1, top), and once for the case where it was sufficient (P=2, bottom). Results indicate performance cannot be improved by adding more linear units if P is too small, but can be -- up to some saturation level -- when P is sufficiently large. Error bars = SEM.
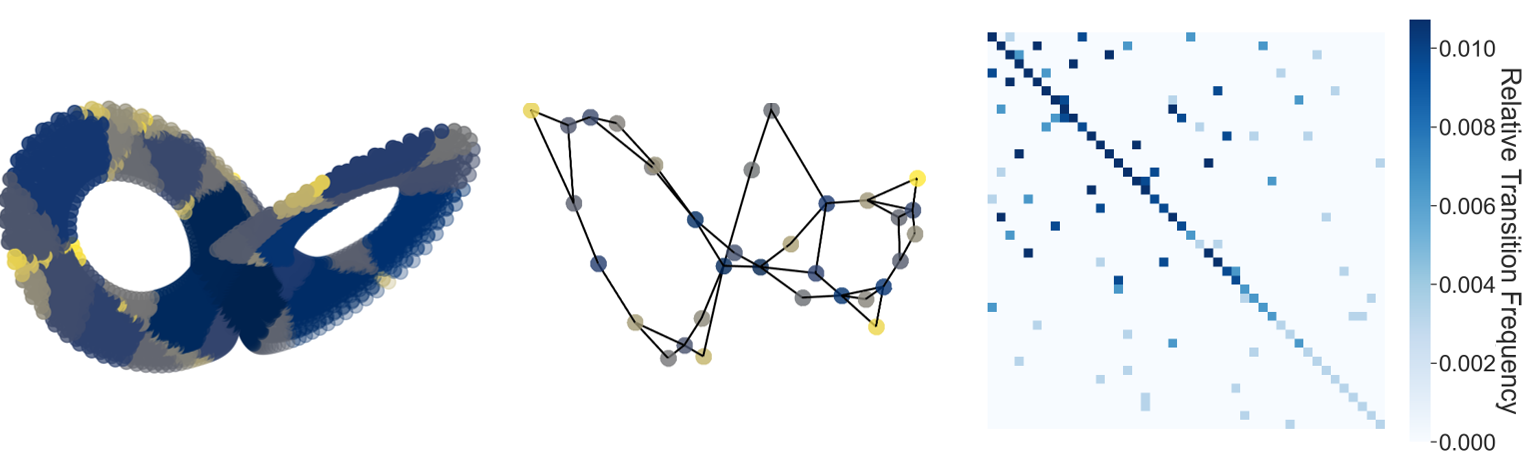
Figure 12: Optimal geometric reconstruction of a Lorenz-63 using the AL-RNN with P=8 PWL units. Left: reconstruction with subregions color-coded by frequency of trajectory visits (dark: most frequently visited regions, yellow: least frequent regions). Center: Resulting geometrical graph structure (using transition probabilities for placing the nodes) visualized using the spectral layout in networkx. Note that self-connections and directedness of edges were omitted in this representation. The resulting graph shadows the layout of the reconstructed system. Right: Connectome of transitions between subregions.
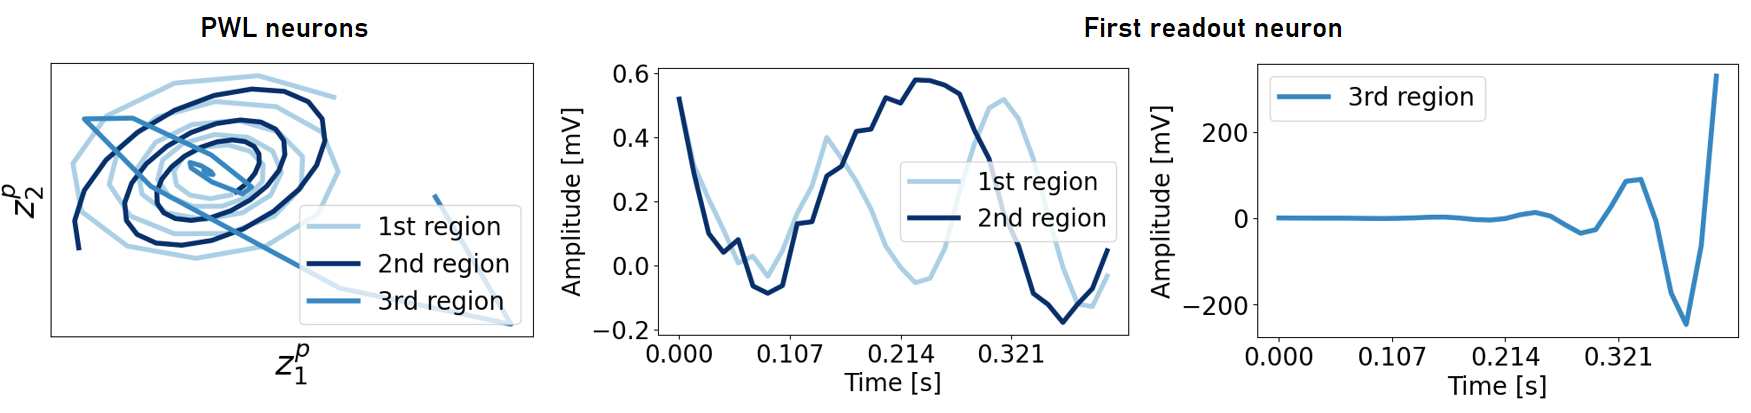
Figure 13: `Linearized' dynamics (i.e., considering the linear map from each subregion) within the three linear subregions of the AL-RNN trained on the ECG data from Fig. \ref{fig:ECG_minimal}
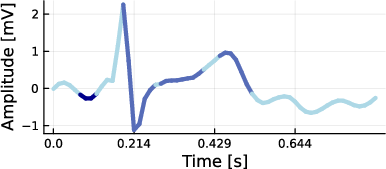
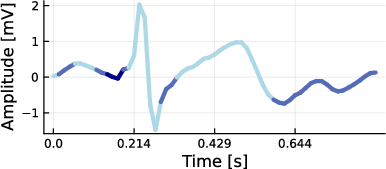
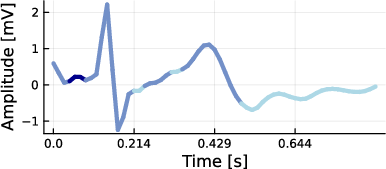

Figure 14: Freely generated ECG activity using an AL-RNN with 3 linear subregions (color-coded) shows consistent assignment of the Q wave to a distinct subregion across multiple successful reconstructions.
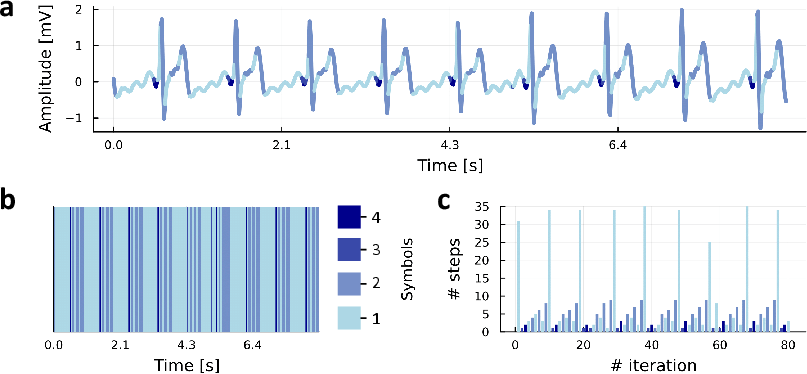
Figure 15: a: Freely generated ECG activity by the AL-RNN with M=100 total units and P=2 PWL units. b: Symbolic coding of the dynamics (with each shade of blue a different symbol/ linear subregion), reflecting the QRS phase with alternating excitation/inhibition (lighter shades of blue) following the short Q wave burst (dark blue). c: Time histogram of distinct symbols along the symbolic trajectory, exposing the mildly chaotic nature of the reconstructed ECG signal \cite{hess_generalized_2023}.
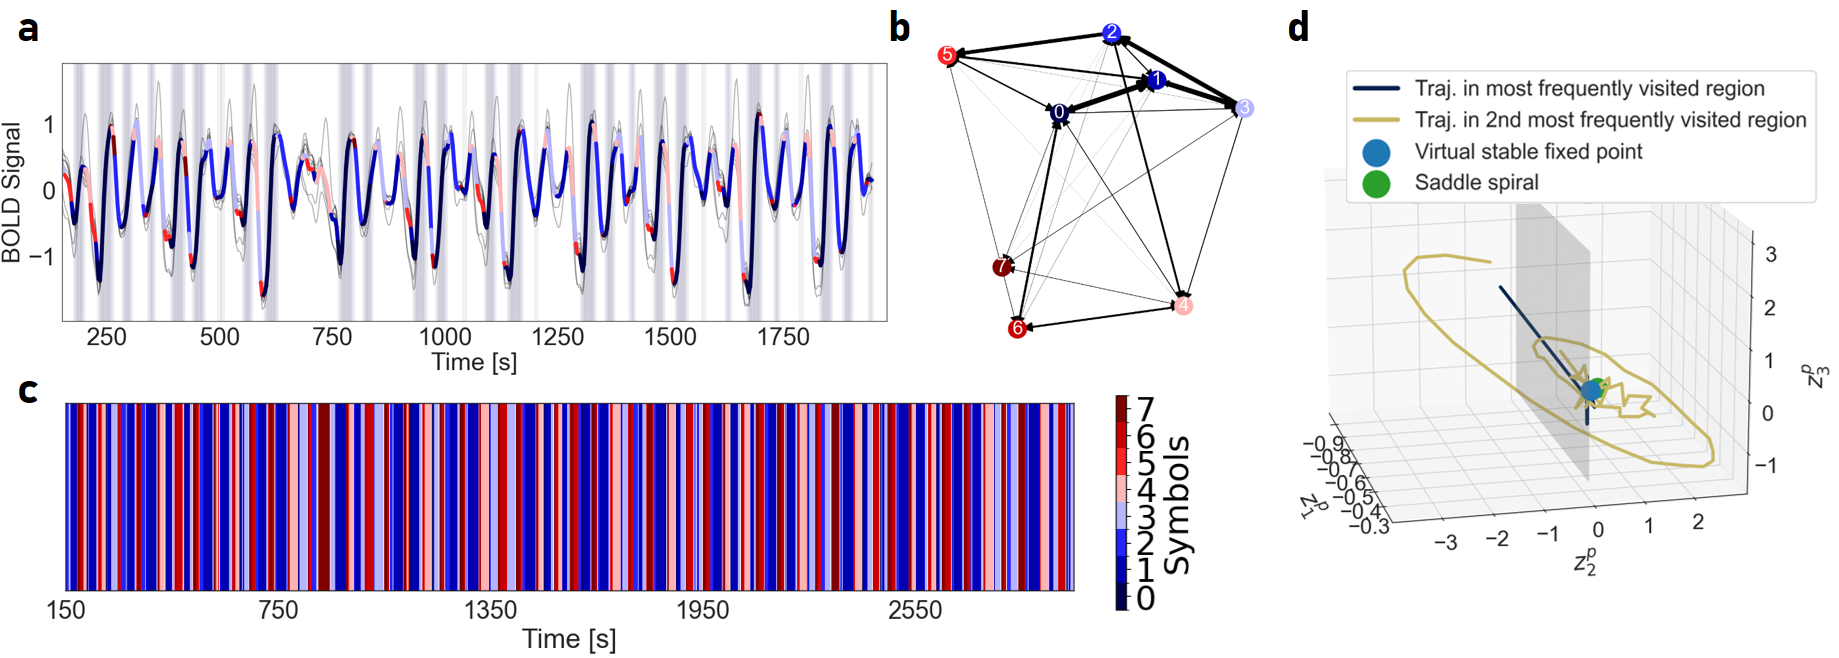
Figure 16: Freely generated fMRI activity using an AL-RNN with M=100 total units and P=3 PWL units. a: Mean generated activity color-coded according to linear subregions, with background shading highlighting the most frequently visited subregion. b: Geometrical graph representation of connections between linear subregions, with edge weights representing relative transition frequencies (self-connections omitted). c: Time series of the symbolic coding of dynamics according to linear subregions. d: Dynamics in the two most frequently visited linear subregions in the subspace of the three PWL units, with the boundary between subregions in gray. The dark blue trajectory bit in the first subregion moves towards a virtual stable fixed point located near the center of the saddle spiral in the second subregion. The yellow trajectory illustrates an orbit cycling away from this spiral point and eventually crossing into the first subregion. From there, trajectories are pulled back into the second subregion through the virtual stable fixed point located close to the saddle spiral (see also activity with background shading in a). This dynamical behavior is similar to the one observed in the chaotic benchmark systems, where locally divergent activity of the AL-RNN is propelled back into the center of an unstable manifold within another subregion.
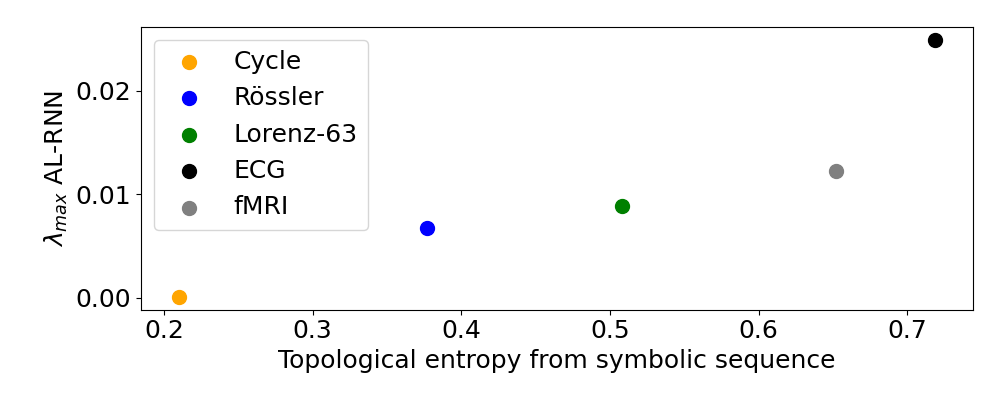
Figure 17: Topological entropy %approximated
computed from symbolic sequences (Figs. \ref{fig:ECG_symbolic} content \ref{fig:fMRI_freely_generated}) versus λmax, calculated from corresponding topologically minimal AL-RNNs (Figs. \ref{fig:minimal_reconstructions} content \ref{fig:ECG_minimal}).
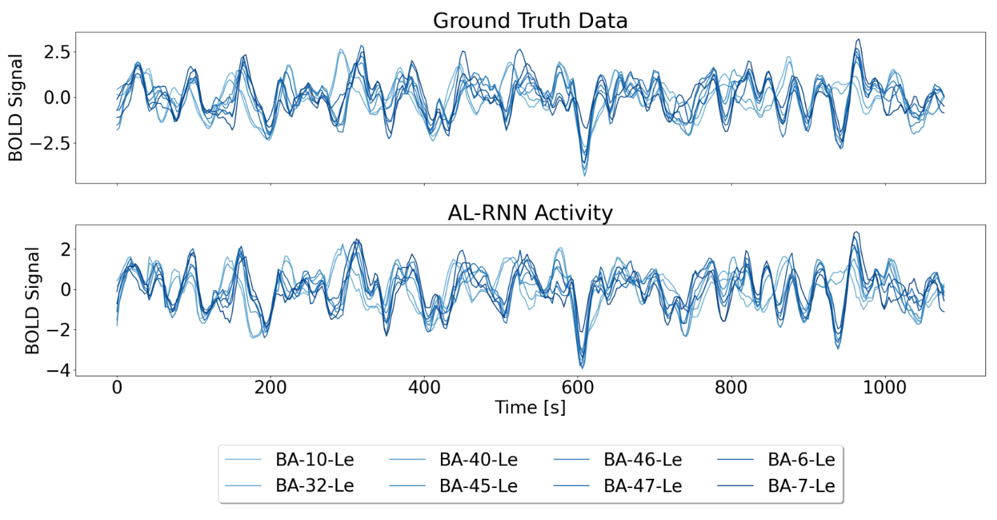
Figure 18: Generated fMRI activity using an AL-RNN with M=100 total units and P=2 PWL units, with the readout unit states replaced by observations every 7 time steps.
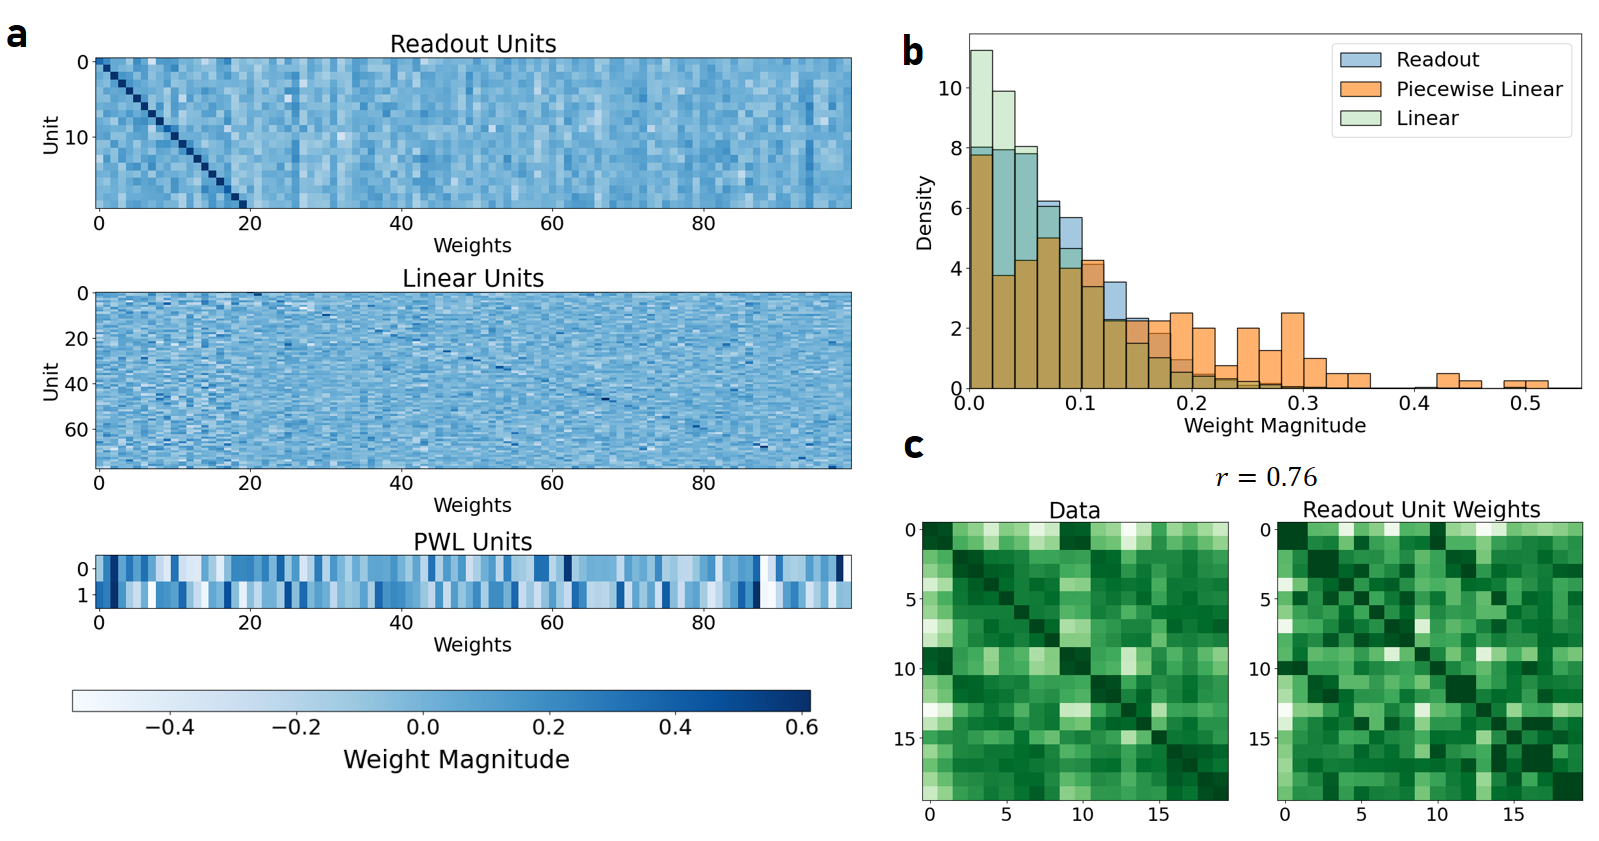
Figure 7: a: Weights of the reconstructed AL-RNN. b: Histogram of the absolute weight distributions for the different types of AL-RNN units. On average, weight magnitudes of the PWL units are much higher than those of the other unit types. c: The correlation structure among the weights of the N=20 readout units (rows in a, top) reflects the correlation structure within the observed time series variables (correlation between both matrices r≈0.76).
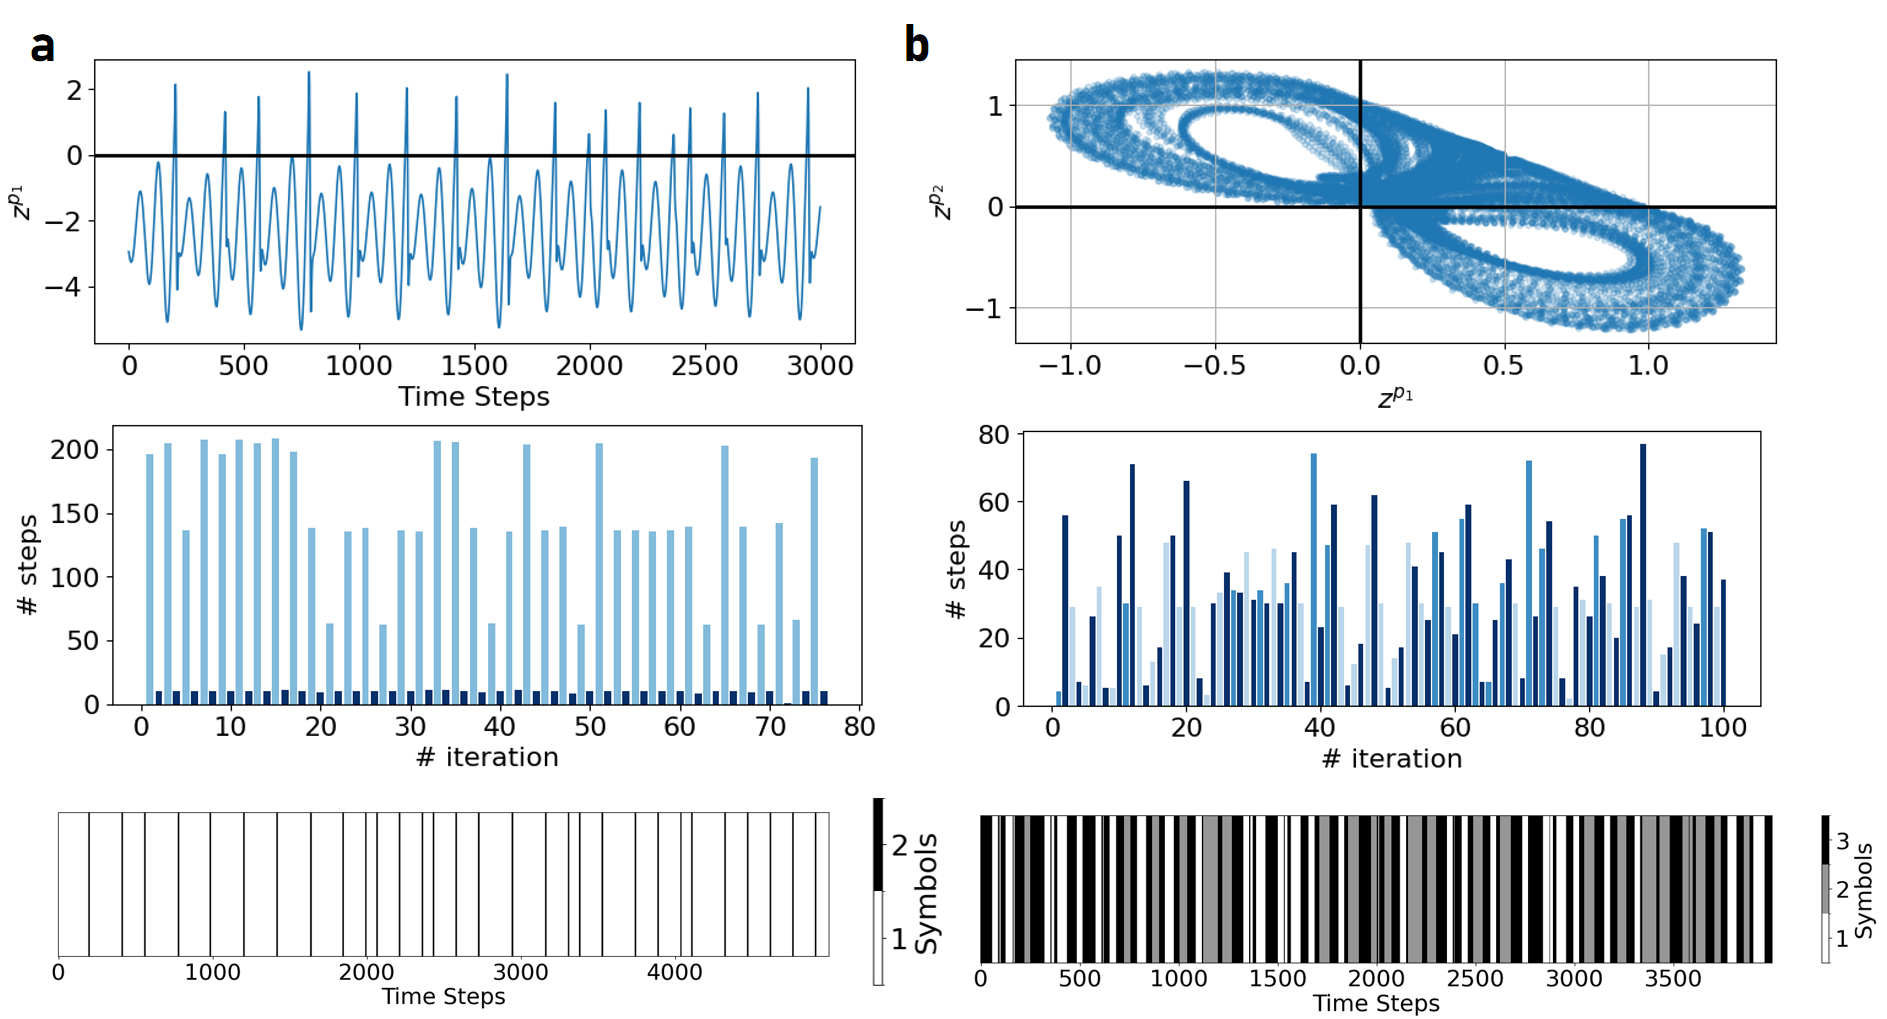
Figure 19: Top row: Activity of the PWL units for the topologically minimal representations of the Rössler (a) and Lorenz-63 attractor (b) from Fig. \ref{fig:minimal_reconstructions}
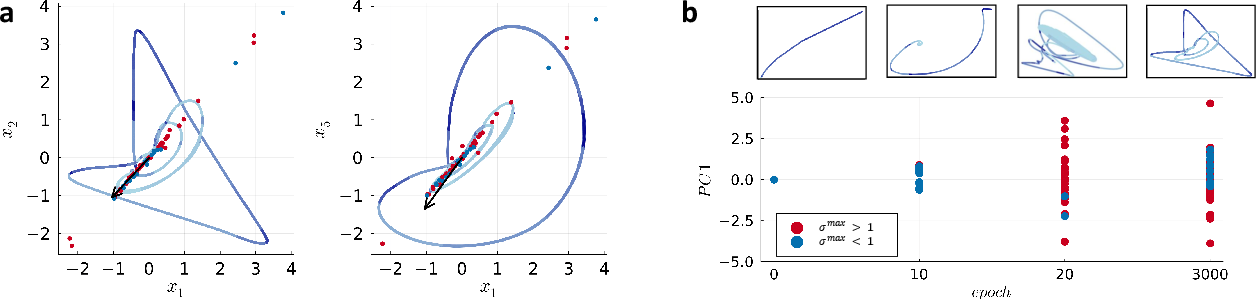
Figure 20: a: Variation in the location of the analytically computed real and virtual fixed points of the linear subregions aligns with the first PC of the data (generated trajectories in bluish, color-coded according to linear subregion). b: Fixed point location along the first principal component (with corresponding dynamics within (x1,x2)-plane of observation space on top) at different characteristic stages of training. At the early stages of training, fixed points of the linear subregions are distributed along the data manifold within the subspace of readout units. Around epoch $20$, the maximum absolute eigenvalues $\sigma^{\text{max}$ of the Jacobians in many subregions become larger than one, inducing local divergence necessary for producing the observed chaotic dynamics.
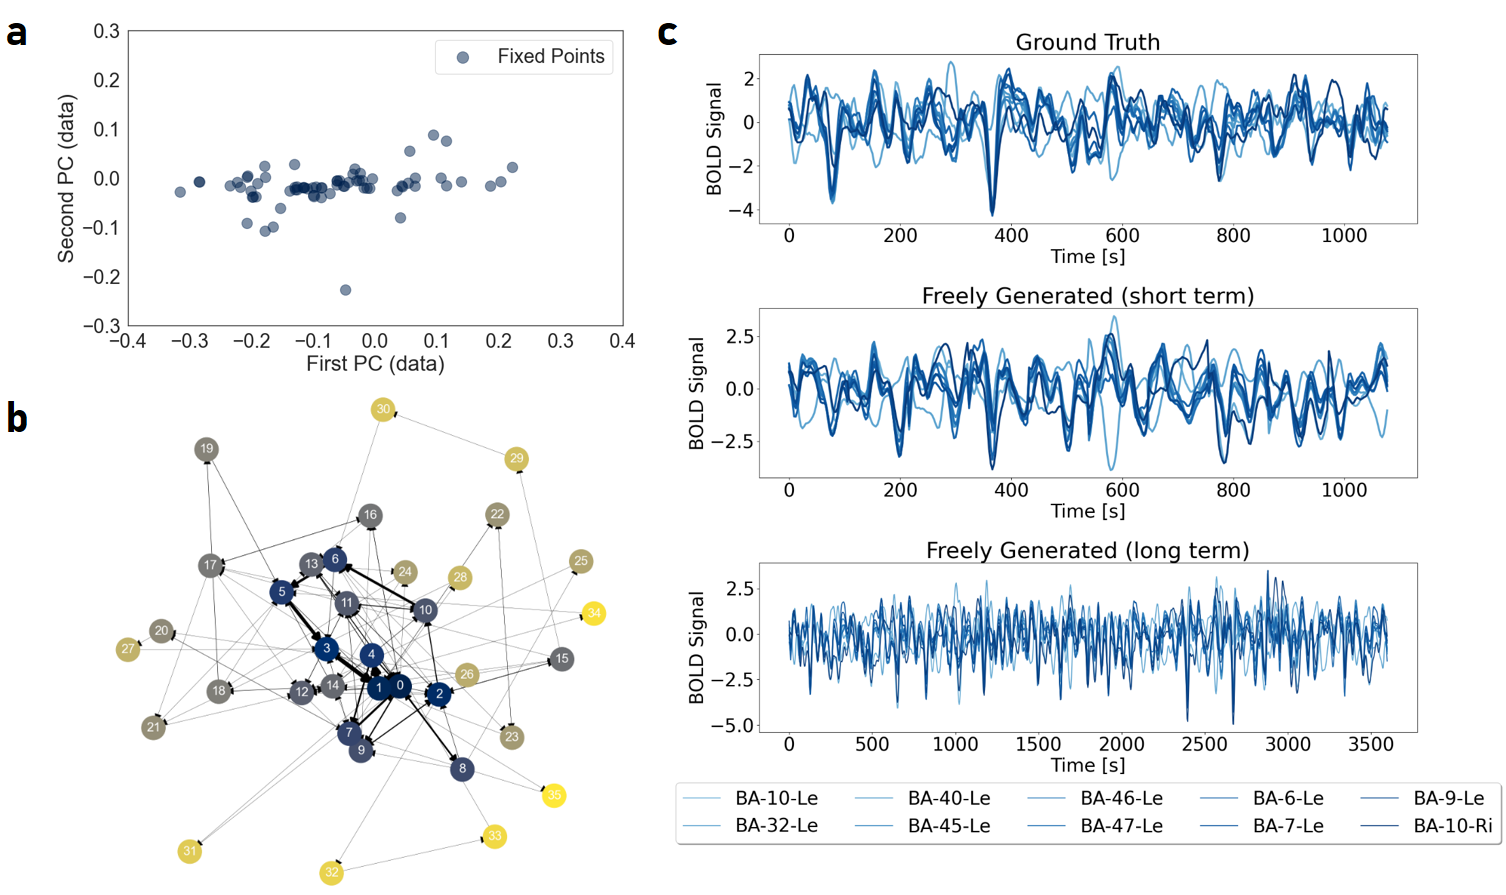
Figure 21: a: Analytically computed real and virtual fixed points of the linear subregions of a geometrically minimal AL-RNN (M=100,P=10) align with the first PC of the data within the subspace of readout units. The BOLD time series for different brain regions were highly correlated, so PC1 accounted for approximately 80% of the data variance. b: Geometrical graph representation with relative frequency of transitions between linear subregions indicated by line thickness of edges, showing a central highly connected subgraph of frequently visited (bluish) dominant subregions, as in Fig. \ref{fig:subregions_covered}. c: Example freely generated activity from ten simulated brain regions.
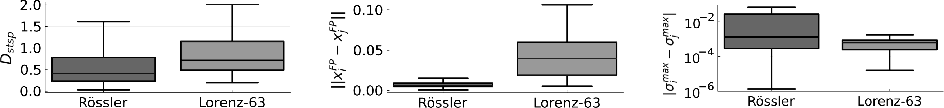
Figure 22: Same as Fig. \ref{fig:minimal_reconstructions}
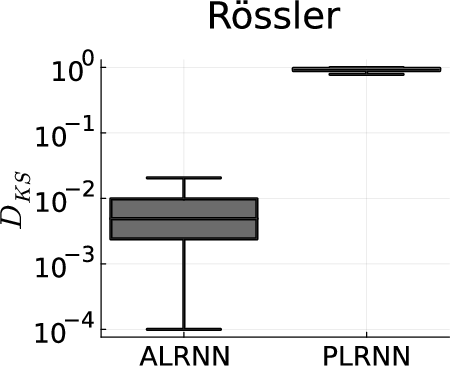
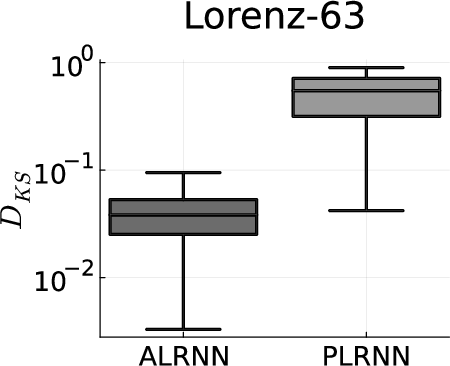
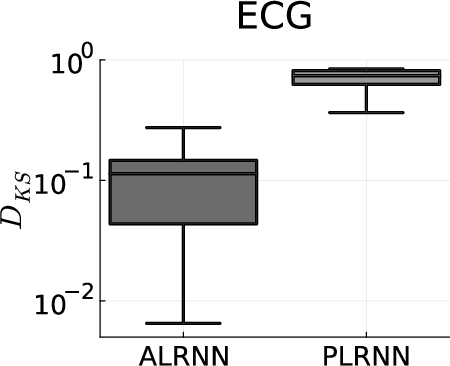
Figure 23: Pairwise differences in sorted (from lowest to highest probability) cumulative trajectory point distributions across linear subregions across all valid pairs from 20 training runs (quantified by the KolmogorovâSmirnov distance, DKS) for the AL-RNN vs. PLRNN, revealing much higher consistency for AL-RNN. Note the log-scale on the y-axis.
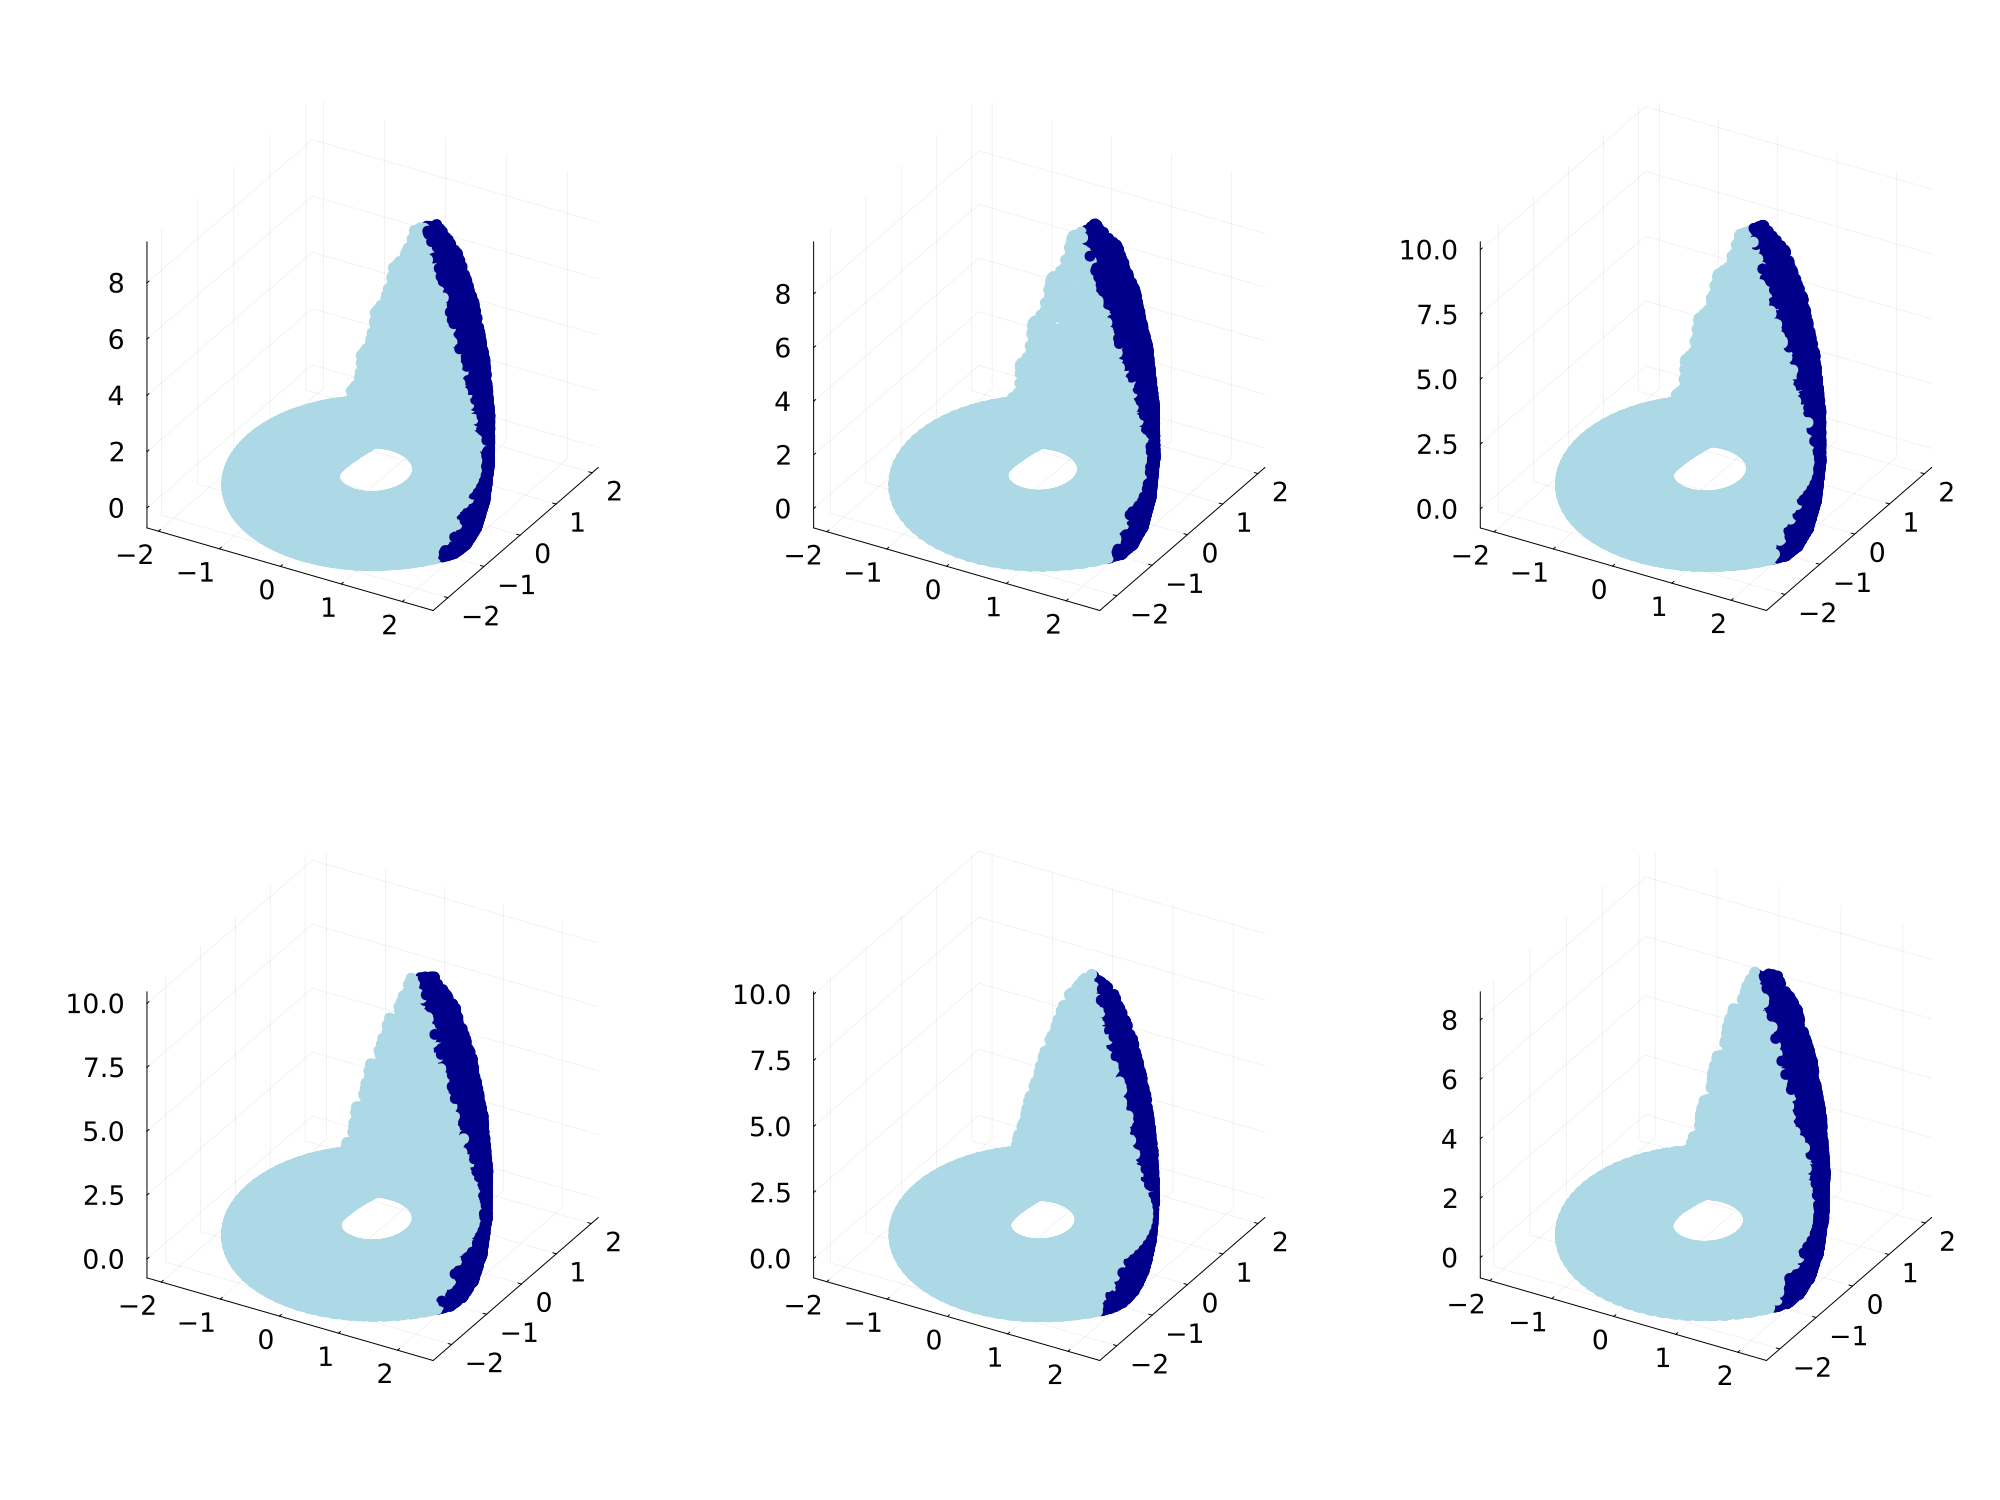
Figure 24: Linear subregions (color-coded) mapped to observation space of the Rössler system, showing a robust representation of the individual subregions across multiple training runs/ models.
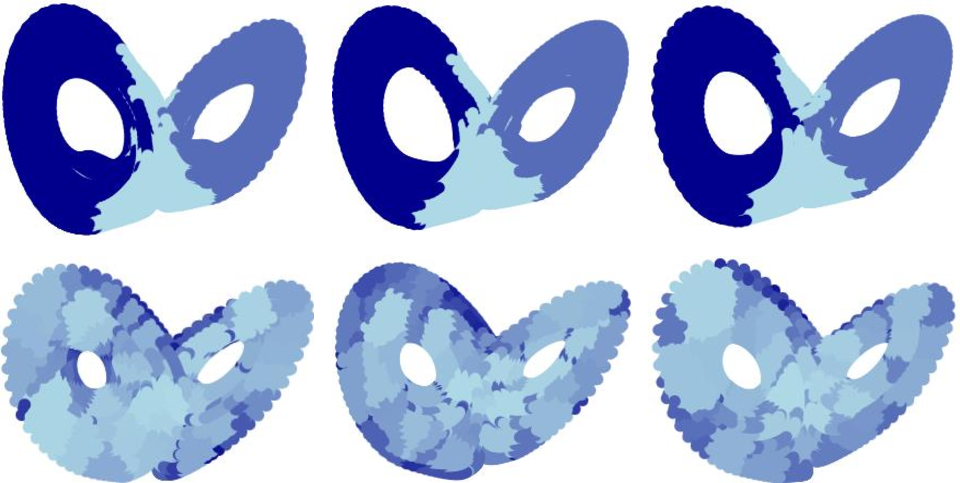
Figure 25: Top row: Robust placing of linear subregions (color coded) mapped to observation space across %20
training runs using the AL-RNN. Model recovery experiments further confirmed the robustness of the model solutions, with very similar overall performance measures across different experiments (original: Dstsp=3.14, DH=0.28; recovered: Dstsp=3.38±0.18, DH=0.28±0.03; 3 linear subregions in all cases). Bottom row: In contrast, for the PLRNN linear subregions are differently assigned (with varying boundaries) on each run.
Conclusion
The AL-RNN provides a method for learning interpretable representations of nonlinear DS. By minimizing the number of PWL nonlinearities, AL-RNNs facilitate topological analysis and offer insights into the dynamics of complex systems, even from empirical data. Future work may focus on automatically inferring the optimal number of PWL nonlinearities and exploring the applicability of AL-RNNs to a broader range of empirical scenarios.

