Chart-based Reasoning: Enhancing VLMs with LLMs' Capabilities
Introduction
The synergy between Vision-LLMs (VLMs) and LLMs is reshaping the landscape of multimodal reasoning, particularly in understanding and interpreting data through visuals such as charts and graphs. Recent studies pointed out the gap in reasoning capabilities between smaller VLMs and their larger counterparts, propelling a new methodology that leverages LLMs to bolster VLMs. This approach has been methodically explored, yielding notable enhancements in models' ability to undertake chart-based reasoning tasks.
Methodology
Focusing on the advancement of VLMs, particularly the PaLI3-5B model, a multifaceted approach was adopted to transfer reasoning skills from LLMs to VLMs. This technique encompasses several stages, commencing with an enriched chart representation phase, succeeded by a data augmentation process to create a substantially larger dataset. The crux of this methodology lies in synthesizing reasoning traces, thereby enabling VLMs to better interpret and reason about data presented in charts. Furthermore, the employment of multitask loss, as introduced by previous research, plays a pivotal role in fine-tuning VLMs, significantly ameliorating their performance on benchmarks like ChartQA, suggesting an intricate yet effective recipe for enhancing reasoning capabilities in VLMs.
Pre-training and Fine-tuning Innovations
At the heart of this methodology is an enhanced pre-training task aimed at improving chart representation by utilizing an advanced chart-to-table translation task, followed by the creation of a dataset that is magnitudes larger than the original. Noteworthy is the synthesis of reasoning traces via the table representation of charts, which, when paired with a multitask loss fine-tuning strategy, significantly heightens VLMs' reasoning faculties.
Dataset Synthesis and Reasoning Traces
A pivotal aspect of this methodology is the use of LLMs to generate synthetic datasets that include both the reasoning traces and the datasets themselves, geared towards chart understanding tasks. The ChartQA benchmark served as the primary testbed, with the data synthesis process yielding a dataset twenty times larger than the initial dataset. This extensive synthesis process facilitated the VLM's learning, demonstrating the impact of synthetic data on improving multimodal reasoning capabilities.
Experimental Setup and Results
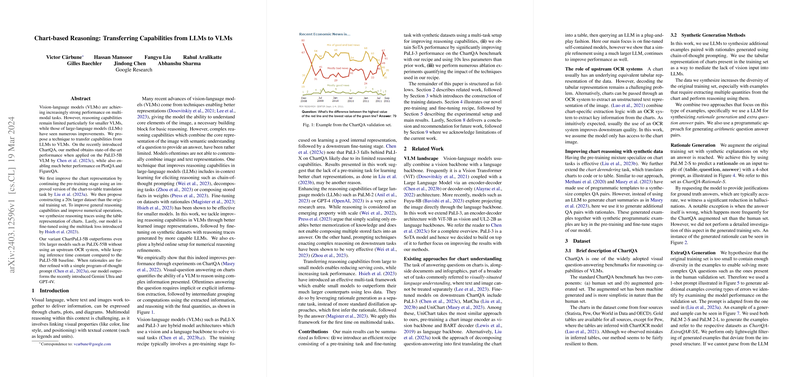
The experimental investigations, conducted primarily on the ChartQA benchmark, revealed significant improvements in the performance of PaLI3-5B, courtesy of the proposed methodological recipe. The model not only outperformed significantly larger models in the field of chart-based reasoning but also did so without the necessity for an OCR system, maintaining inference time parity with the baseline model. The experiments underscore the efficacy of the enriched chart representation, the synthesized reasoning traces, and the multitask fine-tuning approach in elevating the VLM's reasoning capabilities.
Implications and Future Prospects
The successful implementation of this methodology has far-reaching implications, both practical and theoretical, in the domain of AI and machine learning. Practically, it paves the way for the development of more efficient and capable VLMs that can seamlessly interpret and reason about complex visual data. Theoretically, it contributes to the ongoing dialogue about the integration of LLM capabilities into VLMs, stretching the horizon for future research. The exploration of color reasoning, complex reasoning involving numerous numerical operations, and the overcoming of task leakage are identified as potential avenues for further research, promising to unravel new dimensions of VLMs' reasoning capabilities.
Conclusion
The exploration into transferring reasoning capabilities from LLMs to VLMs, as outlined in this paper, marks a significant stride forward in multimodal reasoning. The methodology introduced not only advances the state-of-the-art in visual-question answering on charts but also sets a new benchmark for integrating LLMs' capabilities into vision-LLMs, heralding a new era of AI-driven chart-based reasoning.